Ecg interpretation
Reading File
Asking for Preferences
Finding Sources
Finding Sources
Finding Sources
Reading File
Reading File
Reading File
Finding Sources
Reading File
Finding Sources
Finding Sources
Reading File
Reading File
Reading File
Loading Image
Loading Image
Here is a complete, systematic approach to ECG interpretation, based on Harrison's Principles of Internal Medicine (22nd ed.) and Medical Physiology (Boron & Boulpaep).
ECG Interpretation: Complete Systematic Approach
Electrophysiologic Basis
The ECG records depolarization and repolarization of the working atrial and ventricular myocardium. The impulse follows this pathway:
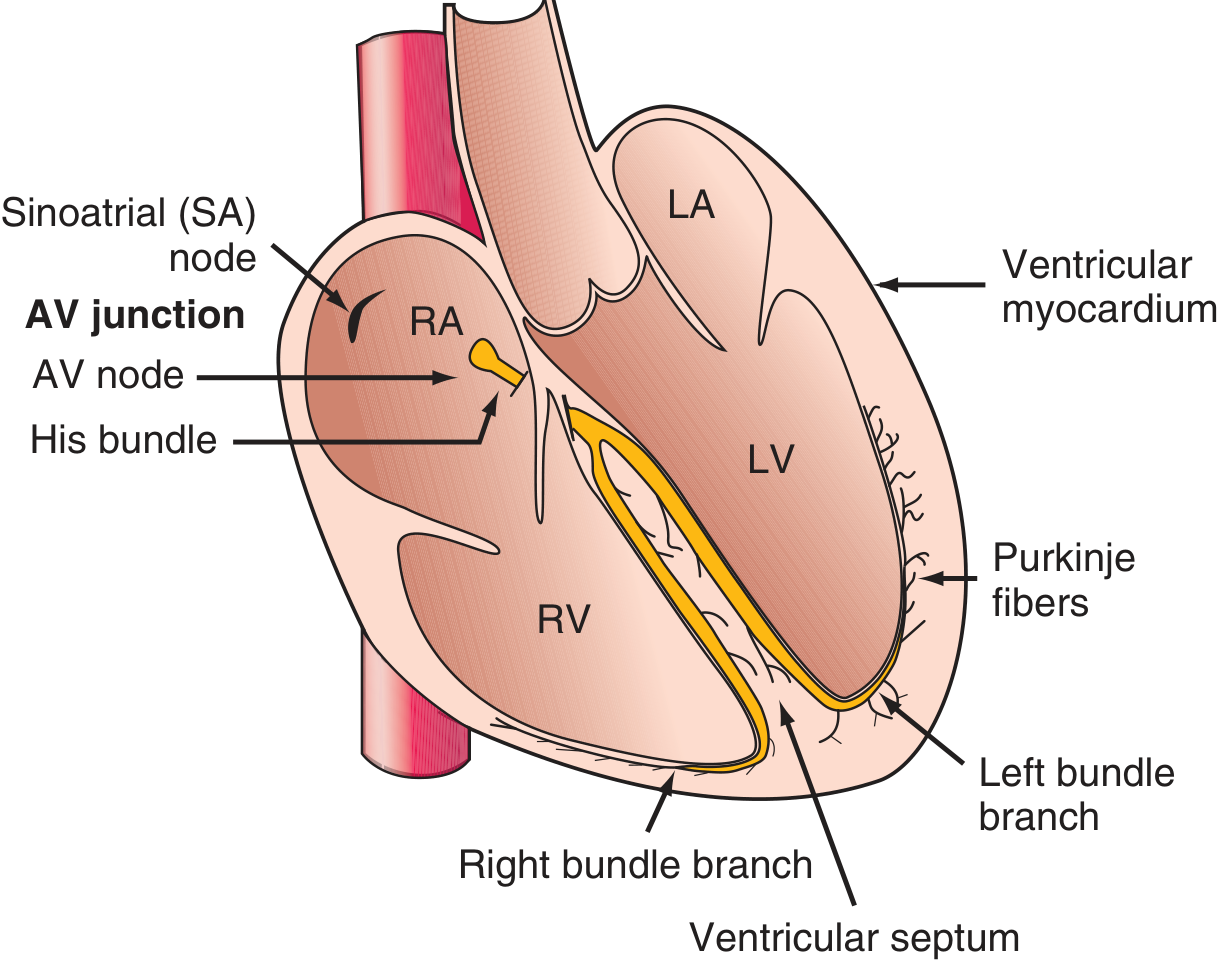
SA node → Atria → AV node → His bundle → Right & Left bundle branches → Purkinje fibers → Ventricular myocardium
The left bundle further divides into the left anterior fascicle and left posterior fascicle.
ECG Paper & Calibration
| Dimension | Small box (1 mm) | Large box (5 mm) |
|---|---|---|
| Time (horizontal) | 0.04 s | 0.20 s |
| Voltage (vertical) | 0.1 mV | 0.5 mV |
Standard calibration: 1 mV = 10 mm (10 small boxes tall). Always confirm the calibration pulse at the left margin of each row.
The 14-Step Systematic Checklist
(Per Harrison's 22nd ed. — missing any step is a common source of errors)
Step 1 — Standardization & Technical Features
- Confirm 1 mV calibration pulse is present
- Check lead placement (limb lead reversal is the most common artifact; right arm–left arm reversal inverts lead I and swaps aVR/aVL)
- Look for artifacts: muscle tremor, AC interference, baseline wander
Step 2 — Rhythm
Ask three questions:
- Where is the pacemaker? — P waves before every QRS = sinus origin
- What is the conduction path?
- Is the pacemaker regular and at the correct speed?
Normal sinus rhythm (NSR): Regular P waves, positive in I and II, negative in aVR, each followed by a QRS, rate 60–100 bpm.
| Rhythm clue | Interpretation |
|---|---|
| No P waves, irregularly irregular | Atrial fibrillation |
| Sawtooth flutter waves ~300/min | Atrial flutter (usually 2:1 or 4:1 block) |
| P waves after QRS | Junctional rhythm |
| Wide QRS, no P, rate 20–40 | Ventricular escape rhythm |
Step 3 — Heart Rate
Method 1 (regular rhythm): Count large boxes between two R waves → Rate = 300 ÷ number of large boxes
| Large boxes (R-R) | Heart rate |
|---|---|
| 1 | 300 |
| 2 | 150 |
| 3 | 100 |
| 4 | 75 |
| 5 | 60 |
| 6 | 50 |
Method 2 (irregular rhythm): Count QRS complexes in a 6-second strip × 10.
Normal: 60–100 bpm | Bradycardia: <60 | Tachycardia: >100
Step 4 — PR Interval / AV Conduction
- Normal: 0.12–0.20 s (3–5 small boxes)
- Measured from start of P to start of QRS
| Finding | Meaning |
|---|---|
| PR > 0.20 s (fixed) | 1st-degree AV block |
| PR progressively lengthens → dropped QRS | 2nd-degree block, Mobitz I (Wenckebach) |
| Fixed PR + sudden dropped QRS | 2nd-degree block, Mobitz II |
| No relationship between P and QRS | 3rd-degree (complete) AV block |
| PR < 0.12 s + delta wave | Pre-excitation (WPW) |
Step 5 — QRS Interval
- Normal: < 0.12 s (< 3 small boxes)
- Measured from start to end of QRS
| QRS Duration | Interpretation |
|---|---|
| < 0.12 s | Normal (narrow complex) |
| 0.12–0.14 s | Incomplete bundle branch block |
| ≥ 0.12 s (≥ 3 boxes) | Complete bundle branch block or ventricular rhythm |
RBBB pattern: rSR' (M-shape) in V1, wide S in I and V6
LBBB pattern: Broad monophasic R in I, aVL, V5–V6; deep QS in V1; ST interpretation unreliable
LBBB pattern: Broad monophasic R in I, aVL, V5–V6; deep QS in V1; ST interpretation unreliable
Step 6 — QT / QTc Interval
- Measured from start of QRS to end of T wave
- Rate-dependent → use corrected QT (QTc)
- Bazett formula: QTc = QT ÷ √(R-R interval in seconds)
- Normal QTc: < 440 ms (men), < 460 ms (women)
| QTc | Clinical significance |
|---|---|
| > 500 ms | High risk of torsades de pointes |
| Prolonged | Hypokalemia, hypomagnesemia, hypocalcemia, drugs (quinidine, sotalol, haloperidol, erythromycin), congenital LQTS |
| Short QT | Hypercalcemia, digitalis effect |
Step 7 — Mean QRS Axis (Frontal Plane)
Normal axis: −30° to +90°
Quick method using leads I and aVF:
| Lead I | Lead aVF | Axis |
|---|---|---|
| Positive | Positive | Normal (0° to +90°) |
| Positive | Negative | Left axis deviation (LAD) |
| Negative | Positive | Right axis deviation (RAD) |
| Negative | Negative | Extreme axis ("no man's land") |
Left axis deviation (LAD, more negative than −30°): LBBB, left anterior fascicular block (LAFB), inferior MI, LVH
Right axis deviation (RAD, > +90°): RVH, RBBB, LPFB, lateral MI, Wolff-Parkinson-White, dextrocardia
Right axis deviation (RAD, > +90°): RVH, RBBB, LPFB, lateral MI, Wolff-Parkinson-White, dextrocardia
Step 8 — P Waves
- Normal: Upright in I, II, aVF; inverted in aVR; duration < 0.12 s; amplitude < 2.5 mm
- Right atrial enlargement (P pulmonale): Tall, peaked P > 2.5 mm in II or V1 (positive component)
- Left atrial abnormality (P mitrale): Broad, notched P in limb leads (> 0.12 s); biphasic P in V1 with prominent negative terminal component (> 1 mm × 1 mm)
Step 9 — QRS Voltages
Low voltage: QRS amplitude < 5 mm in all limb leads OR < 10 mm in all precordial leads
→ Causes: pericardial effusion, obesity, COPD/emphysema, hypothyroidism, infiltrative cardiomyopathy
→ Causes: pericardial effusion, obesity, COPD/emphysema, hypothyroidism, infiltrative cardiomyopathy
Left ventricular hypertrophy (LVH):
- SV1 + RV5 (or RV6) > 35 mm (Sokolow-Lyon)
- Or R in aVL > 11 mm
- Often accompanied by ST depression + T-wave inversion in lateral leads ("strain pattern")
Right ventricular hypertrophy (RVH):
- R > S in V1 with right axis deviation
- Dominant R in V1 ≥ 7 mm
- ST-T inversion in V1–V3/V4
Step 10 — Precordial R-Wave Progression
- R wave should grow progressively from V1 (small r) to V5–V6 (tall R)
- Transition zone (R = S) normally at V3–V4
- Poor R-wave progression (PRWP): R wave ≤ 3 mm through V1–V3
- Causes: anterior MI, LBBB, LVH, COPD, lead misplacement
Step 11 — Abnormal Q Waves
- Pathological Q waves: Width ≥ 0.04 s (1 small box) AND depth ≥ 25% of the following R wave, in ≥ 2 contiguous leads
- Indicate prior transmural (Q-wave) myocardial infarction
Localization by lead:
| Leads with Q waves | Territory | Artery |
|---|---|---|
| V1–V4 | Anterior | LAD |
| I, aVL, V5–V6 | Lateral | LCx |
| II, III, aVF | Inferior | RCA (or LCx) |
| V1–V2 | Posterior (tall R in V1–V2) | RCA/LCx |
(Note: Small q waves in I, aVL, V5, V6 are normal septal q waves)
Step 12 — ST Segments
- Should be isoelectric (on the baseline)
- Measured at the J point (junction of QRS end and ST start)
ST Elevation:
- ≥ 1 mm in ≥ 2 contiguous limb leads OR ≥ 2 mm in ≥ 2 contiguous precordial leads = STEMI until proven otherwise
- Also seen in: acute pericarditis (diffuse, saddle-shaped, PR depression), Brugada syndrome (coved type in V1–V3), LBBB, LVH, early repolarization (concave upward, notched J point)
ST Depression:
- Subendocardial ischemia / NSTEMI
- Digoxin effect (scooped/reverse tick)
- LVH strain
- Reciprocal changes in STEMI
Step 13 — T Waves
- Normally upright in I, II, V3–V6; inverted in aVR; variable in III, aVL, V1
- T-wave inversion: Ischemia, ventricular hypertrophy (strain), bundle branch block, CNS events (massive T-wave inversions in subarachnoid hemorrhage)
- Peaked (hyperacute) T waves: Very early STEMI, hyperkalemia
- Flattened T waves: Ischemia, hypokalemia, hypothyroidism
Step 14 — U Waves
- Small deflection after the T wave, same polarity as T wave
- Best seen in V2–V3
- Prominent U waves: Hypokalemia, bradycardia, drugs (quinidine, amiodarone)
- Inverted U waves: LVH, ischemia
Normal 12-Lead ECG for Reference
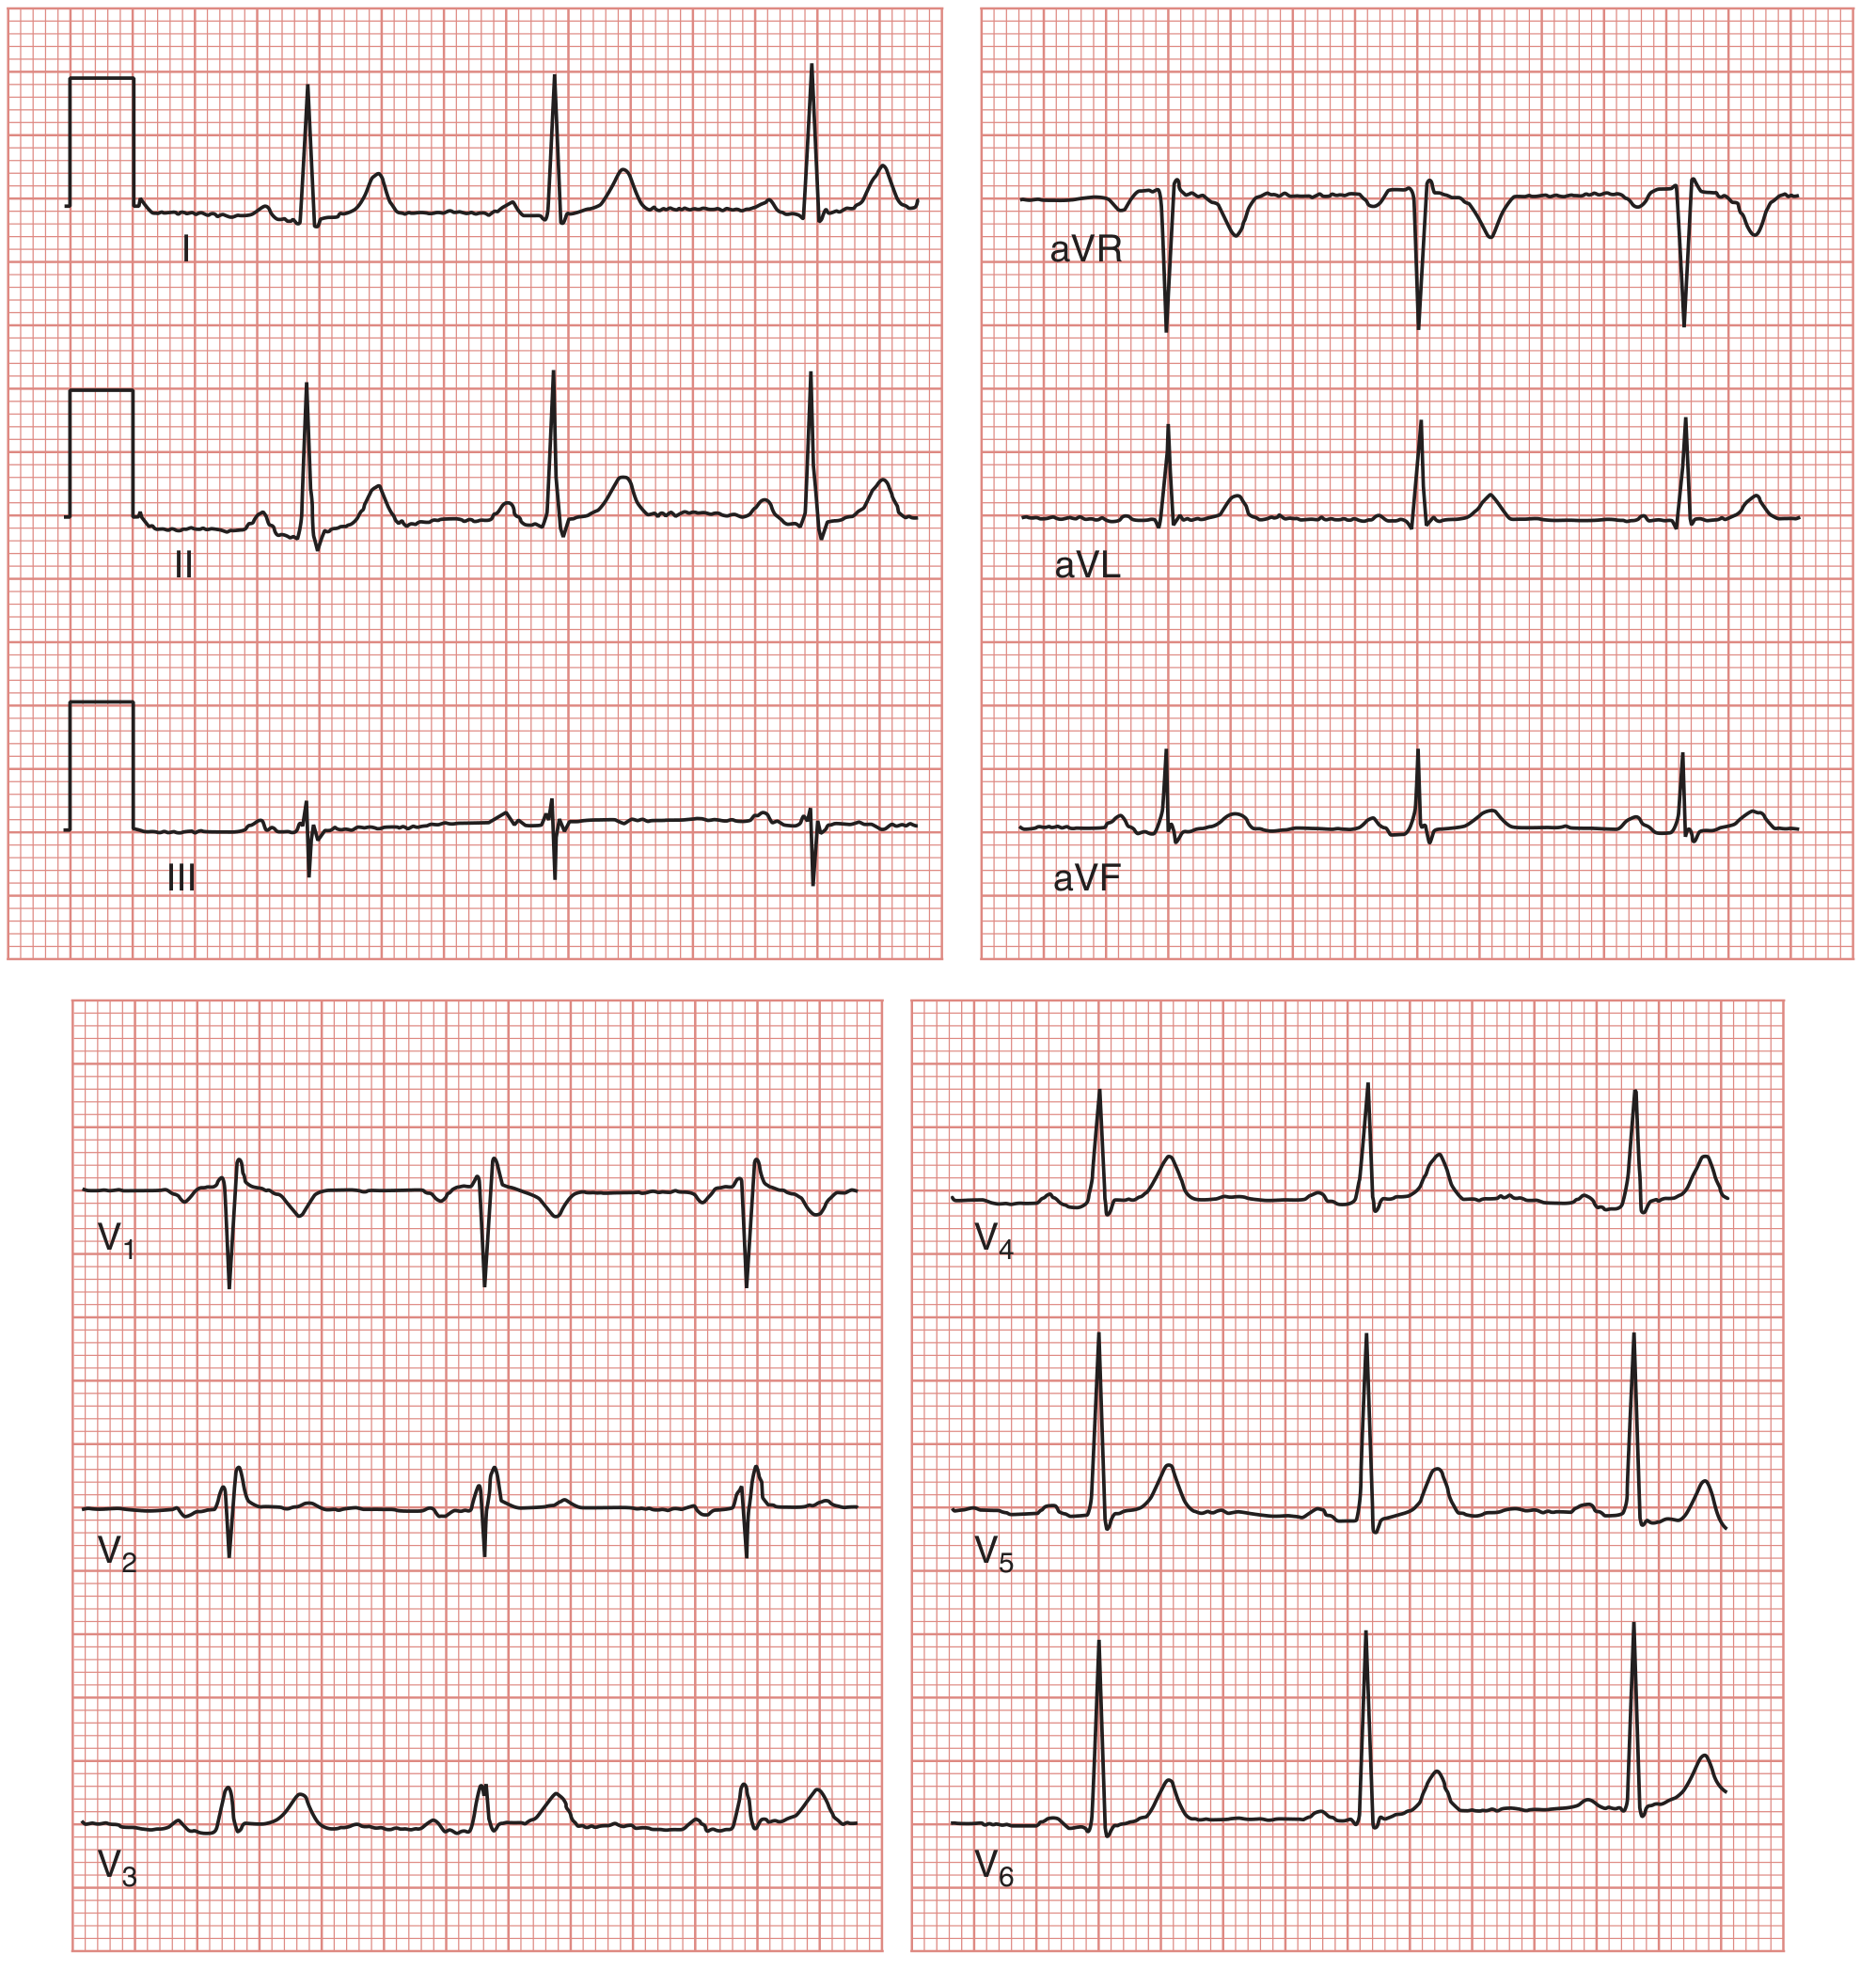
Normal 12-lead ECG showing all leads. The calibration pulse (1 mV, 200 ms) is visible at the left of each row. — Medical Physiology (Boron & Boulpaep)
Quick Reference: Normal Values
| Parameter | Normal range |
|---|---|
| Heart rate | 60–100 bpm |
| PR interval | 0.12–0.20 s |
| QRS duration | < 0.12 s |
| QTc | < 440 ms (men), < 460 ms (women) |
| QRS axis | −30° to +90° |
| P wave duration | < 0.12 s |
| P wave amplitude | < 2.5 mm |
| R-wave transition | V3–V4 |
Key Principle
"Many mistakes in ECG interpretation are errors of omission. Therefore, a systematic approach is essential." — Harrison's Principles of Internal Medicine, 22nd ed.
Always:
- Compare with previous ECGs
- Correlate with the clinical context (age, symptoms, medications)
- Do not rely solely on computer interpretation — always perform your own review
Sources: Harrison's Principles of Internal Medicine 22E (2025, McGraw-Hill); Medical Physiology, Boron & Boulpaep; Ganong's Review of Medical Physiology, 26th ed.
This is a shared conversation. Sign in to Orris to start your own chat.