
Read the content and explain everything in detail exam compatible manner for an mcq based quiz today i should score high its based on physiology reference from stuart fox and ganong
I need to see the content you'd like me to explain. It seems no file or image was attached to your message.
Asking for Preferences
What content would you like me to explain? Please share it below.
Go ahead and upload your image or PDF - once you share it, I'll analyze the content and give you a detailed, exam-ready breakdown optimized for MCQ scoring based on Stuart Fox and Ganong physiology.
explain me everything regarding cardiac output and venous return from zero to hero
Reading File
Finding Sources
Finding Sources
Finding Sources
Good - I found Ganong's and Guyton. Now let me search specifically for Stuart Fox and pull all the key sections in parallel.
Finding Sources
Finding Sources
Reading File
Reading File
Finding Sources
Reading File
Reading File
Reading File
Finding Sources
Finding Sources
Reading File
Reading File
Reading File
Reading File
I now have rich content from both Ganong and Guyton-Hall. Let me fetch the key diagrams and get the Stuart Fox-specific content on cardiac output.
Loading Image
Loading Image
Finding Sources
I have extensive content from Ganong and Guyton-Hall. Now let me get the Costanzo and Medical Physiology stroke volume / cardiac output sections for completeness.
Reading File
Loading Image
Now I have everything I need. Here is the complete, MCQ-optimized masterclass on Cardiac Output and Venous Return.
🫀 CARDIAC OUTPUT & VENOUS RETURN — Zero to Hero MCQ Master Guide
References: Ganong's Review of Medical Physiology (26th Ed.) | Guyton & Hall (14th Ed.) | Costanzo Physiology (7th Ed.)
PART 1 — FOUNDATIONS & KEY NUMBERS (HIGH MCQ YIELD)
What is Cardiac Output?
Cardiac Output (CO) = volume of blood ejected by one ventricle per minute.
CO = Stroke Volume (SV) × Heart Rate (HR)
| Parameter | Normal Value | MCQ Key Point |
|---|---|---|
| Heart Rate | 72 beats/min | Controlled mainly by autonomic nerves |
| Stroke Volume | ~70 mL/beat | EDV - ESV |
| Cardiac Output | ~5 L/min | 5000 mL/min in 70-kg man |
| Cardiac Index | 3.2 L/min/m² | CO corrected for body surface area |
| End-Diastolic Vol (EDV) | ~120-130 mL | Volume BEFORE ejection |
| End-Systolic Vol (ESV) | ~50-60 mL | Volume AFTER ejection |
| Ejection Fraction (EF) | ~55-65% | SV/EDV × 100 |
MCQ TRAP: Cardiac Index, not raw CO, is used to compare cardiac function across body sizes. Normal = 3.2 L/min/m².
MCQ TRAP: Both ventricles eject the SAME cardiac output. The right ventricle output = left ventricle output (otherwise blood would accumulate).
Stroke Volume Formula
$$SV = EDV - ESV$$
- Increased SV = more EDV (more filling) OR less ESV (better ejection)
- Ejection Fraction = SV/EDV → indicator of contractility
- Normal EF ≥ 55%; EF < 40% = systolic heart failure
PART 2 — MEASURING CARDIAC OUTPUT (MCQ GOLDMINE)
1. Fick's Principle (Direct Fick Method)
"The amount of a substance taken up by an organ per unit time = (arterial level - venous level) × blood flow"
$$CO = \frac{O_2 \text{ consumption (mL/min)}}{[A_{O2}] - [V_{O2}] \text{ (mL/L)}}$$
Classic MCQ calculation:
- O₂ consumption = 250 mL/min
- Arterial O₂ = 190 mL/L
- Venous O₂ (pulmonary artery) = 140 mL/L
- CO = 250 / (190 - 140) = 250/50 = 5 L/min ✓
Key: The pulmonary artery sample is used for mixed venous blood (not peripheral vein) — Ganong p.544.
2. Indicator Dilution Method
$$CO = \frac{\text{Amount of indicator injected}}{\text{Average concentration in arterial blood × time}}$$
- Dye or radioactive isotope injected into an arm vein
- Log of concentration vs. time plotted; initial decline extrapolated to abscissa
3. Thermodilution (Most Common Clinically)
- Indicator = cold saline, injected into the right atrium
- Temperature change recorded in the pulmonary artery via a thermistor
- Advantages: saline is harmless; no recirculation problem; easy to repeat
- MCQ key: Temperature change is inversely proportional to cardiac output
4. Electromagnetic Flow Meter
- Used in experimental animals on the ascending aorta
- Not applicable to routine clinical use
PART 3 — FACTORS CONTROLLING CARDIAC OUTPUT
CO is determined by two variables: Heart Rate and Stroke Volume.
CO = HR × SV
     ↑         ↑
  Chronotropic  Inotropic
   (rate)       (strength)
A) HEART RATE
- Controlled primarily by autonomic nerves
- Sympathetic → ↑HR (positive chronotropy) via β₁ receptors
- Parasympathetic (vagus) → ↓HR (negative chronotropy)
- Catecholamines (epinephrine) → ↑HR
B) STROKE VOLUME — The Big Three Determinants
PART 4 — THE BIG THREE: PRELOAD, AFTERLOAD, CONTRACTILITY
This is the most heavily tested area in cardiac physiology MCQs.
1. PRELOAD
Preload = the degree to which the myocardium is stretched before contraction = filling of the ventricle = End-Diastolic Volume (EDV)
- Corresponds to the sarcomere length at end-diastole
- Increased preload → longer sarcomere length → stronger contraction (up to a limit)
- Clinically measured as: Left Ventricular End-Diastolic Pressure (LVEDP) or Central Venous Pressure (CVP)
What increases preload?
- ↑ Blood volume (IV fluids, fluid retention)
- Venoconstriction (sympathetic tone on veins)
- Lying down (supine position)
- Exercise (muscle pump)
- Bradycardia (more time to fill)
What decreases preload?
- Hemorrhage / dehydration
- Venodilation (nitrates, standing)
- Tachycardia (less filling time)
- Positive pressure ventilation (↑ intrathoracic pressure → ↓ venous return)
2. THE FRANK-STARLING LAW (MOST TESTED CONCEPT)
"The energy of contraction is proportional to the initial length of the cardiac muscle fiber" — Starling's Law of the Heart
- Heterometric regulation = regulation by changes in muscle length (preload)
- Homometric regulation = regulation by changes in contractility independent of length
Frank-Starling Curve: Plots Stroke Volume vs. End-Diastolic Volume
| EDV increases → | SV increases → | CO increases |
|---|
Why it works: Greater stretch → more optimal overlap of actin-myosin → stronger contraction → more Ca²⁺ sensitivity of troponin C → ↑ force.
The physiological importance: Allows the heart to automatically match its output to venous return. If venous return ↑ → EDV ↑ → SV ↑ → CO ↑.
MCQ TRAP: The Frank-Starling mechanism operates even in denervated (transplanted) hearts — this is how transplant patients increase CO during exercise.
MCQ TRAP: Beyond the optimal sarcomere length (~2.2 μm), further stretch causes DECLINING force — the descending limb. However, this is rare in a normal in-vivo heart because the pericardium physically limits overdistension.
3. AFTERLOAD
Afterload = the resistance against which blood is expelled from the ventricle = effectively arterial blood pressure / total peripheral resistance (TPR)
- The tension the ventricle must develop to open the aortic valve and eject blood
- ↑ Afterload → ↓ SV (ventricle can't eject as much) → ↑ ESV remains
- ↓ Afterload → ↑ SV (easier ejection) → ↓ ESV
Clinical example: In hypertension → high afterload → ventricle hypertrophies (to compensate), but long term → heart failure.
Drugs that reduce afterload (vasodilators): ACE inhibitors, hydralazine, amlodipine → ↑ SV → ↑ CO in heart failure.
4. CONTRACTILITY (Inotropy)
Contractility = the intrinsic ability of cardiac muscle to contract at any given length (independent of preload)
- ↑ Contractility = positive inotropy → shifts Frank-Starling curve UP and LEFT
- ↓ Contractility = negative inotropy → shifts curve DOWN
Positive inotropes (↑ contractility):
- Sympathetic stimulation / catecholamines (↑ intracellular Ca²⁺ via β₁ → cAMP → PKA)
- Digoxin (inhibits Na⁺/K⁺ ATPase → ↑ intracellular Na⁺ → ↑ intracellular Ca²⁺ via Na/Ca exchanger)
- Exercise
- Hypercalcemia
Negative inotropes (↓ contractility):
- Parasympathetic stimulation (vagal)
- Hypoxia, hypercapnia, acidosis
- Quinidine, procainamide, barbiturates
- Beta blockers (β-blockers)
- Heart failure (intrinsic depression + β-receptor downregulation)
MCQ KEY: Ejection fraction is the best clinical index of contractility. EF = SV/EDV. Normal EF ≥ 55%.
PART 5 — CARDIAC OUTPUT CURVES (Frank-Starling Graph)
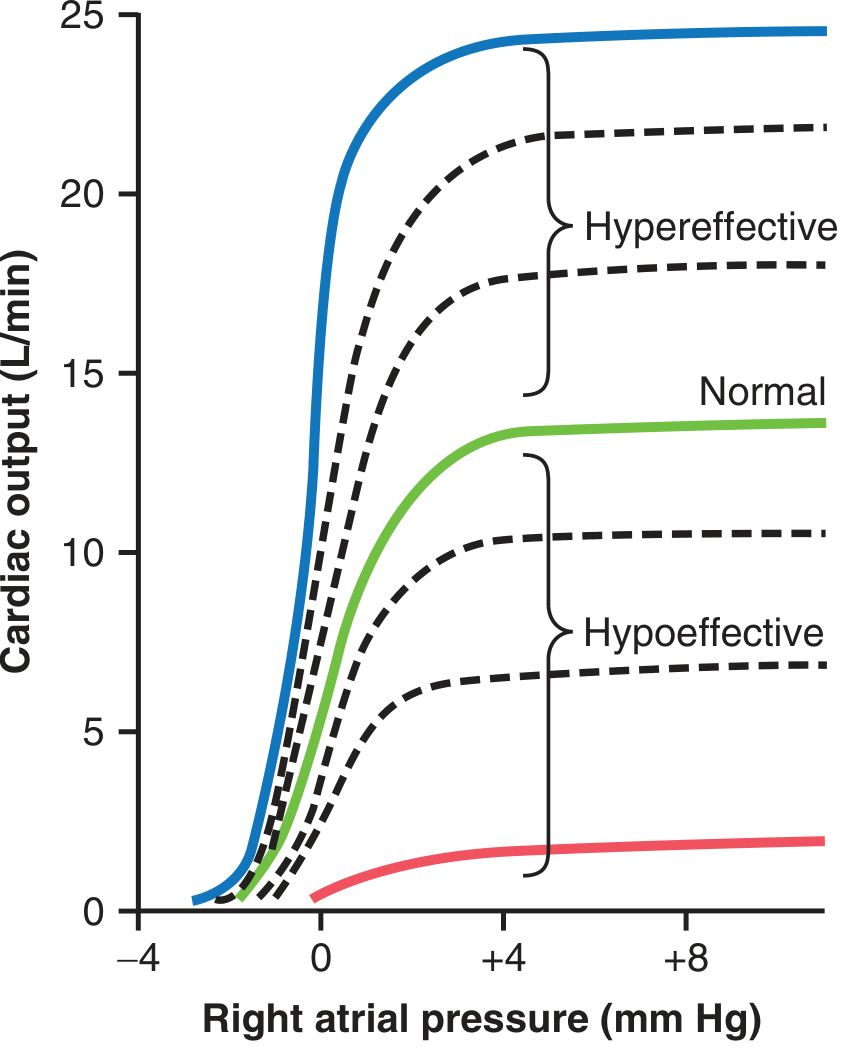
From Guyton & Hall: Cardiac output curves. The Y-axis is cardiac output (L/min), X-axis is right atrial pressure (mm Hg). Higher/leftward curves = hypereffective heart; lower/rightward = hypoeffective.
| Curve | Plateau CO | Examples |
|---|---|---|
| Hypereffective | ~25 L/min | Sympathetic stimulation, exercise, athlete hypertrophy |
| Normal | ~13 L/min | Resting state |
| Hypoeffective | 2-6 L/min | Heart failure, MI, valvular disease, tamponade |
MCQ KEY: Sympathetic maximum stimulation can raise plateau CO to nearly 25 L/min (almost double normal). In trained marathon runners + sympathetic activation = up to 30-40 L/min.
PART 6 — CARDIAC OUTPUT IN VARIOUS CONDITIONS
| Condition | Effect on CO | Mechanism |
|---|---|---|
| Exercise | ↑↑ up to 700% | ↑HR, ↑SV, ↑venous return (muscle pump) |
| Anxiety/excitement | ↑ 50-100% | Sympathetic activation |
| Eating | ↑ 30% | Splanchnic vasodilation |
| Pregnancy | ↑ | ↑ Blood volume, ↓ TPR |
| Epinephrine | ↑ | β₁ + α₁ effects |
| Standing from supine | ↓ 20-30% | Venous pooling → ↓ venous return |
| Sleep | No change | — |
| Rapid arrhythmias | ↓ | ↓ Filling time → ↓ EDV |
| Hemorrhage | ↓ | ↓ Blood volume → ↓ venous return |
| Septic shock (early) | ↑ | ↓ TPR (vasodilation) |
| Cardiogenic shock | ↓↓ | ↓ Pump function |
| A-V fistula | ↑ | ↓ TPR → ↑ venous return |
| Hyperthyroidism | ↑ 40-80% | ↑ Metabolism → vasodilation → ↓ TPR |
| Anemia | ↑ | ↓ Blood viscosity + tissue hypoxia → vasodilation |
PART 7 — VENOUS RETURN
Definition
Venous Return (VR) = the flow of blood from the systemic veins into the right atrium per unit time.
At steady state: Venous Return = Cardiac Output = 5 L/min
This is the most fundamental principle: the heart can only pump out what comes in.
The Three Principal Determinants of Venous Return (Guyton's Model)
- Right Atrial Pressure (PRA) - impedes venous return (back-pressure)
- Mean Systemic Filling Pressure (Psf) - the driving force pushing blood toward the heart
- Resistance to Venous Return (RVR)
Guyton's Formula:
$$VR = \frac{Psf - PRA}{RVR}$$
Normal values (Guyton & Hall):
| Parameter | Normal Value |
|---|---|
| Venous Return | 5 L/min |
| Psf (Mean Systemic Filling Pressure) | 7 mm Hg |
| Right Atrial Pressure | 0 mm Hg |
| Resistance to Venous Return | 1.4 mm Hg/L/min |
MCQ KEY: When PRA rises to equal Psf (+7 mm Hg), venous return falls to ZERO. This is the x-intercept of the venous return curve.
Mean Systemic Filling Pressure (Psf) — Critical Concept
Psf = the pressure measured everywhere in the systemic circulation when all blood flow is stopped. It represents the "filling" of the vascular system.
- Normal Psf = 7 mm Hg
- Represents the elastic recoil pressure of the vascular system
- ↑ Psf → ↑ venous return (curve shifts RIGHT on graph)
- ↓ Psf → ↓ venous return (curve shifts LEFT on graph)
Causes of ↑ Psf (↑ venous return):
- Blood transfusion / fluid infusion
- Venoconstriction (sympathetic activation)
- Shift of blood from peripheral to central (lying down)
Causes of ↓ Psf (↓ venous return):
- Hemorrhage
- Venodilation (nitrates)
PART 8 — THE VENOUS RETURN CURVE
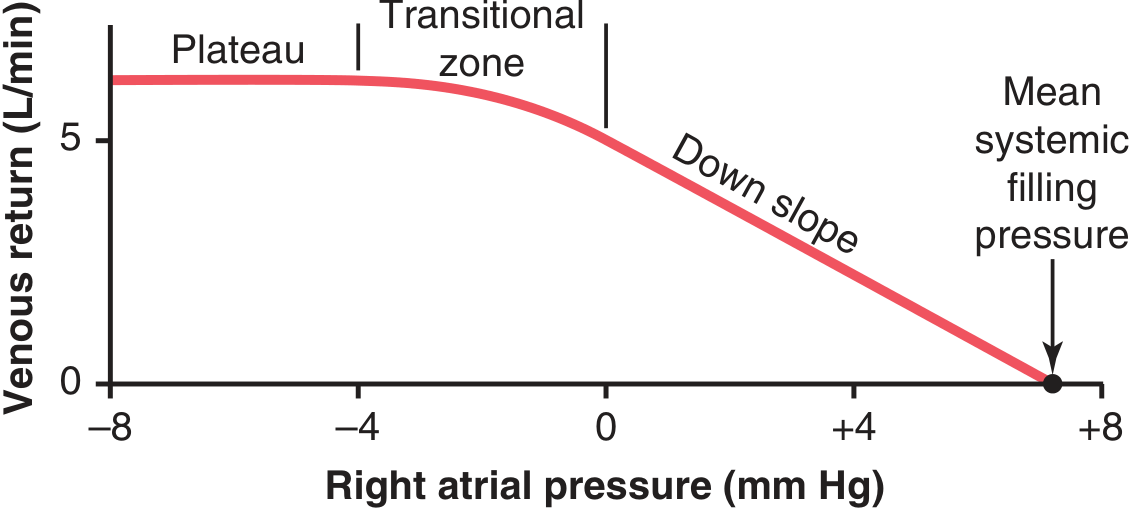
From Guyton & Hall: Normal venous return curve. X-axis = right atrial pressure; Y-axis = venous return (L/min). Venous return drops to zero when PRA = Psf = +7 mm Hg.
3 Segments of the Venous Return Curve:
| Segment | PRA | What Happens |
|---|---|---|
| Plateau (flat top) | Negative (< -4 mmHg) | Large veins entering thorax COLLAPSE; no further increase in VR |
| Transitional zone | -4 to 0 mmHg | Normal operating range |
| Down slope | 0 to +7 mmHg | VR decreases as PRA rises |
MCQ KEY: The plateau occurs because when PRA goes very negative (subatmospheric), the large veins entering the chest collapse and act as a waterfall - further reducing PRA cannot increase VR beyond ~6-7 L/min under resting conditions.
MCQ KEY: Venous return = 0 when PRA = Psf = +7 mm Hg (the x-intercept).
PART 9 — RESISTANCE TO VENOUS RETURN
~2/3 of resistance to venous return is in the VEINS; ~1/3 is in the arterioles/small arteries.
Why veins dominate resistance to venous return:
- Veins are highly distensible (capacitance ~30x that of arteries)
- When venous resistance increases, blood dams up in veins but venous pressure rises very little (because veins stretch easily)
- This small pressure rise is not sufficient to overcome the resistance → VR drops dramatically
MCQ KEY: Arteriolar resistance, when increased, raises arterial pressure markedly (less compliant), which helps overcome resistance → effect on VR is less severe than venous resistance.
Effect on venous return curve: ↑ Resistance → ROTATES the curve clockwise (pivot around Psf, steeper downslope) → less VR at any given PRA.
PART 10 — ANALYSIS OF CARDIAC OUTPUT + VENOUS RETURN CURVES (Equilibrium Point)
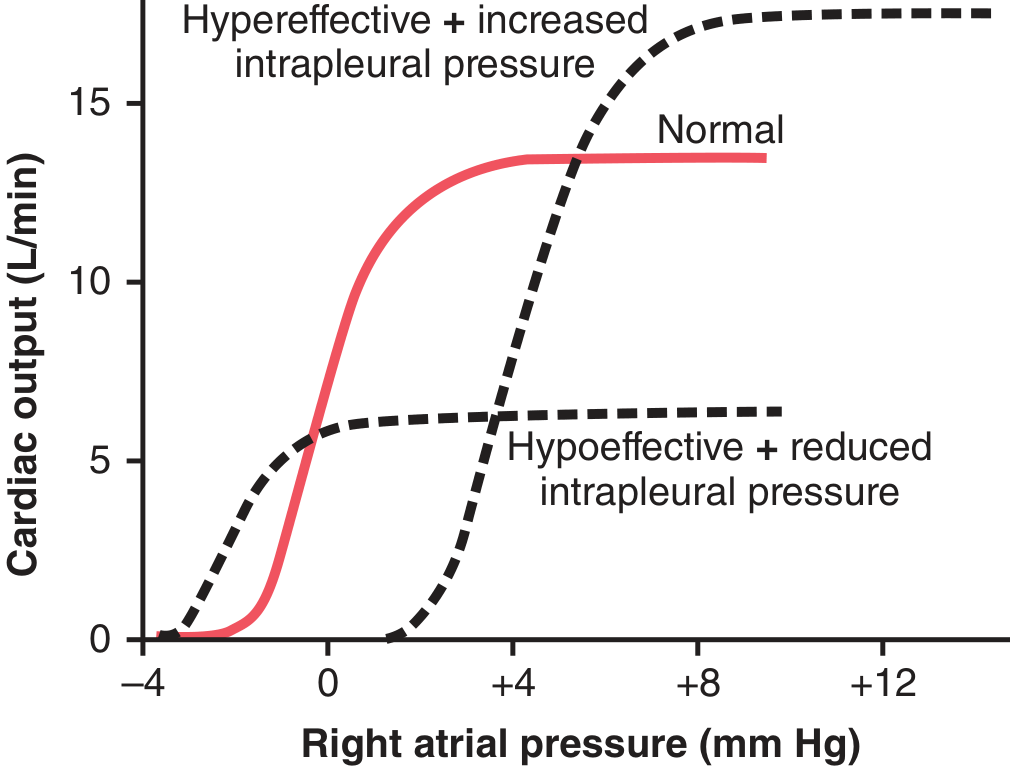
Guyton & Hall: The cardiac output curve (red/solid) and venous return curve (dashed) intersect at the equilibrium point. CO and VR are equal ONLY at this point.
The Equilibrium Point (Point A):
- Only one point where CO curve and VR curve intersect
- At this point: CO = VR = 5 L/min, PRA = 0 mmHg (normal resting state)
Effect of Increased Blood Volume:
- Psf ↑ (from 7 → 16 mmHg)
- VR curve shifts to the right
- Reduced vascular resistance (vessels are distended)
- New equilibrium at higher CO and higher PRA
MCQ KEY: Sudden 20% ↑ in blood volume → CO transiently rises to 2.5-3× normal — but then compensatory mechanisms restore it:
- Capillary filtration → fluid moves to interstitium
- Stretch of atria → ANP release → natriuresis
- Kidneys excrete excess fluid over hours-days
PART 11 — FACTORS AFFECTING VENOUS RETURN (Summary Table)
| Factor | Effect on VR | Mechanism |
|---|---|---|
| ↑ Blood volume | ↑ | ↑ Psf |
| Venoconstriction | ↑ | ↑ Psf (less venous pooling) |
| Supine position | ↑ | Gravity no longer pools blood in legs |
| Skeletal muscle pump | ↑ | Squeezes blood centrally with venous valves |
| Respiratory pump (inspiration) | ↑ | ↑ Negative intrathoracic pressure → ↑ gradient to heart |
| Sympathetic stimulation | ↑ | Venoconstriction → ↑ Psf |
| Atrial contraction | ↑ | Aids ventricular filling |
| Exercise | ↑ | Muscle pump + respiratory pump + sympathetic venoconstriction |
| Hemorrhage | ↓ | ↓ Blood volume → ↓ Psf |
| Venodilation (nitrates) | ↓ | ↑ Venous pooling → ↓ Psf |
| Standing | ↓ | Venous pooling in legs |
| ↑ Intrathoracic pressure (PPV/PEEP) | ↓ | Compresses vena cava/RA → ↓ gradient |
| Cardiac tamponade | ↓ | ↑ Pericardial pressure → limits ventricular filling |
| Increased PRA (e.g., RV failure) | ↓ | Back-pressure effect |
PART 12 — HIGH/LOW CARDIAC OUTPUT STATES (Clinical MCQs)
High Output States (↑ CO with normal heart pump):
All caused by decreased TPR → ↓ afterload → ↑ venous return → ↑ CO
- A-V Fistula - shunt bypasses arterioles → ↓ TPR
- Hyperthyroidism - ↑ metabolism → vasodilation → CO ↑ 40-80%
- Anemia - ↓ blood viscosity + tissue hypoxia vasodilation → ↑ CO
- Septic shock (early/warm phase) - profound vasodilation → ↑ CO
- Beriberi (Vitamin B1 deficiency) - peripheral vasodilation → ↑ CO
- Pregnancy - ↑ blood volume + ↓ TPR
- Paget's disease of bone - ↑ vascularity of bone
Low Output States:
Cardiac causes (pump failure):
- Myocardial infarction
- Severe valvular disease
- Cardiomyopathy
- Myocarditis
- Cardiac tamponade (obstructive)
- Cardiac metabolic derangements
Non-cardiac (↓ venous return):
- Hemorrhage / hypovolemia
- Acute venous dilation (anaphylaxis, neurogenic shock)
- Tension pneumothorax (obstructive - ↑ intrathoracic pressure)
PART 13 — INTEGRATED CONTROL OF CARDIAC OUTPUT (Exercise Model)
During exercise:
- ↑ Sympathetic discharge → ↑ HR + ↑ contractility (↑ SV)
- ↑ HR is the dominant mechanism (more important than ↑ SV) in normal individuals
- ↑ Venous return (muscle pump + respiratory pump)
- ↑ Venous return → ↑ EDV → Frank-Starling → ↑ SV
- Vasodilation in exercising muscles → ↓ afterload → ↑ SV
- Net result: CO can ↑ up to 700% (35 L/min in elite athletes)
MCQ KEY: In a denervated (transplanted) heart, HR cannot rise quickly (no sympathetic). CO during exercise is maintained by the Frank-Starling mechanism - as muscle pump increases VR → ↑ EDV → ↑ SV → ↑ CO. Also, circulating catecholamines help.
PART 14 — HETEROMETRIC vs HOMOMETRIC REGULATION
| Term | Mechanism | Example |
|---|---|---|
| Heterometric regulation | ↑ CO via ↑ fiber LENGTH (preload) | Frank-Starling mechanism |
| Homometric regulation | ↑ CO via ↑ contractility (no length change) | Sympathetic stimulation, digoxin, Anrep effect |
Anrep Effect = ↑ afterload → ↑ contractility after a short delay (an intrinsic autoregulatory response). Bowditch/Treppe Effect (Staircase phenomenon) = ↑ HR → ↑ contractility (due to ↑ intracellular Ca²⁺).
PART 15 — FACTORS AFFECTING END-DIASTOLIC VOLUME (↑ Preload)
| Factor | Effect on EDV |
|---|---|
| ↑ Venous return | ↑ EDV |
| Slow HR (more filling time) | ↑ EDV |
| Atrial contraction (atrial kick) | ↑ EDV (contributes ~20-25%) |
| ↑ Ventricular compliance | ↑ EDV |
| ↑ Total blood volume | ↑ EDV |
| Venoconstriction | ↑ EDV |
| ↑ Negative intrathoracic pressure | ↑ EDV |
| Pericardial tamponade | ↓ EDV (limits filling) |
| ↓ Ventricular compliance (fibrosis, MI) | ↓ EDV |
| AF (loss of atrial kick) | ↓ EDV by ~20-25% |
QUICK MCQ RECALL TABLE — MUST-KNOW NUMBERS
| Parameter | Value | Source |
|---|---|---|
| Normal CO | 5 L/min | Ganong, Guyton |
| Normal SV | 70 mL | Ganong, Costanzo |
| Normal HR | 70-72 bpm | All sources |
| Cardiac index | 3.2 L/min/m² | Ganong |
| Ejection fraction | 55-65% | All sources |
| Mean systemic filling pressure | 7 mm Hg | Guyton |
| Right atrial pressure (normal) | 0 mm Hg | Guyton |
| VR = 0 when PRA = | 7 mm Hg | Guyton |
| Max CO (sympathetic + hypertrophy) | 30-40 L/min | Guyton |
| CO increase in exercise | Up to 700% | Ganong |
| CO increase in anxiety | 50-100% | Ganong |
| CO increase in hyperthyroidism | 40-80% | Guyton |
| VR increase when blood vol ↑ 20% | 2.5-3× | Guyton |
| Veins' share of resistance to VR | ~2/3 | Guyton |
| Arterioles' share of resistance to VR | ~1/3 | Guyton |
TOP 10 MCQ TRAPS TO AVOID
- CO = 5 L/min, NOT 5000 mL/min when options are in L/min - but know both units.
- Cardiac Index corrects for body surface area - use this when comparing across patients.
- VR = 0 when PRA = Psf = 7 mmHg - not when PRA = 0.
- Plateau of venous return curve = caused by venous collapse (not pump failure).
- Frank-Starling works in transplanted hearts (intrinsic, not neural).
- Atrial fibrillation → loses atrial kick → ↓ EDV → ↓ CO (especially in stiff ventricles).
- Digoxin → ↑ contractility via Na/K ATPase inhibition → ↑ intracellular Ca²⁺.
- Nitrates reduce PRELOAD (venodilation, ↓ VR, ↓ EDV); ACE inhibitors reduce AFTERLOAD.
- Positive pressure ventilation → ↑ intrathoracic pressure → ↓ venous return → ↓ CO.
- Exercise: HR increase is more important than SV increase in normal hearts for raising CO.
Good luck on your quiz! This covers everything from basic definitions through Guyton's venous return analysis to clinical high/low output states - exactly the range Stuart Fox and Ganong target in MCQs. - Ganong's Review of Medical Physiology 26th Ed., pp.544-548; Guyton & Hall Medical Physiology 14th Ed., pp.253-265; Costanzo Physiology 7th Ed., pp.155-160
oxygen dissociation curve and bohr effect
Reading File
Finding Sources
Finding Sources
Finding Sources
Reading File
Reading File
Reading File
Reading File
Loading Image
Loading Image
Loading Image
Reading File
Reading File
Reading File
Loading Image
Finding Sources
I now have all the key content and diagrams. Let me compile the full MCQ master guide.# 🩸 OXYGEN DISSOCIATION CURVE & BOHR EFFECT — Zero to Hero MCQ Master Guide
References: Ganong 26th Ed. | Guyton & Hall 14th Ed. | Fishman's Pulmonary | Basic Medical Biochemistry
PART 1 — OXYGEN TRANSPORT: THE BASICS
How is O₂ carried in blood?
| Form | Amount | % of Total |
|---|---|---|
| Bound to hemoglobin (HbO₂) | ~19.5 mL/dL | 97% |
| Dissolved in plasma | ~0.29 mL/dL | 3% |
| Total arterial O₂ content | ~19.8 mL/dL | 100% |
MCQ KEY: O₂ is transported primarily bound to Hb (~97%). Dissolved O₂ is only 3%, but it is the ONLY form that can diffuse across membranes (Hb cannot cross endothelial or RBC membranes). Dissolved O₂ is physiologically critical even though its amount is tiny.
Hemoglobin Oxygen-Carrying Capacity
- Normal Hb = 15 g/dL of blood
- Each gram Hb binds 1.34 mL O₂ (chemically pure Hb = 1.39 mL/g; impurities like methemoglobin reduce this)
- Maximum O₂ capacity = 15 × 1.34 = ~20 mL/dL (20 vol%) — this is 100% saturation
MCQ TRAP: The value is 1.34 mL/g (not 1.39) for real blood because methemoglobin and other Hb variants are included. Use 1.34 in clinical calculations.
PART 2 — THE OXYGEN-HEMOGLOBIN DISSOCIATION CURVE
The Curve
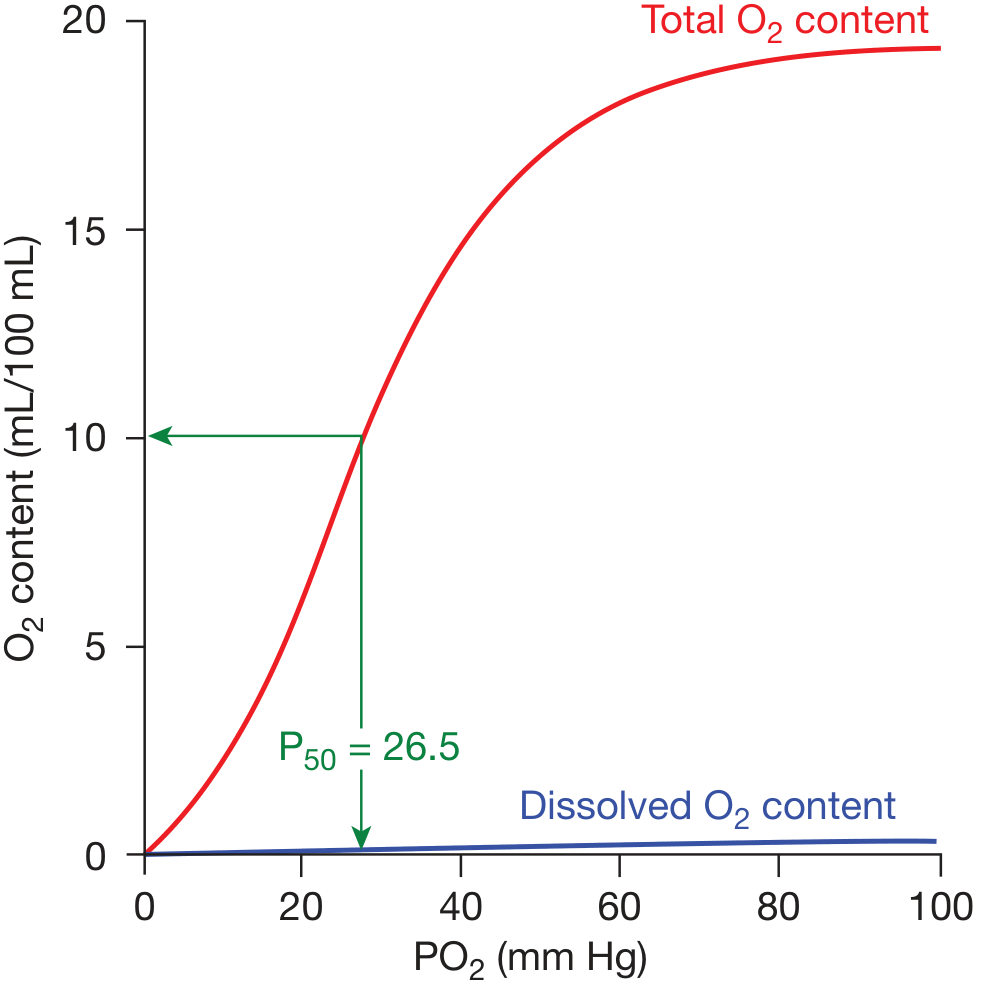
Fishman's Pulmonary Diseases: The sigmoid O₂ dissociation curve. Red = total O₂ content; blue = dissolved O₂. P50 = 26.5 mm Hg.
Key Features of the Curve
Shape: SIGMOID (S-shaped) - not hyperbolic like myoglobin
- Reason: cooperative binding — when O₂ binds to one heme, it changes the quaternary structure of Hb, increasing the affinity of remaining heme groups for O₂
- This is called positive cooperativity
Standard Conditions (Normal Curve):
- pH = 7.40
- Temperature = 37°C
- PaCO₂ = 40 mm Hg
PART 3 — CRITICAL KEY POINTS ON THE CURVE (MCQ HOTSPOTS)
Important PO₂ Values:
| Location/Condition | PO₂ | Hb Saturation | O₂ Content |
|---|---|---|---|
| Alveoli / Arterial blood | 95-100 mm Hg | 97% | ~19.4 mL/dL |
| Mixed venous blood (at rest) | 40 mm Hg | 75% | ~14.4 mL/dL |
| Tissues (capillary) | ~40 mm Hg | 75% | ~14.4 mL/dL |
| P50 (normal) | 26-27 mm Hg | 50% | ~10 mL/dL |
O₂ Extraction at Rest:
- Delivered: ~19.4 mL/dL
- Returned in venous: ~14.4 mL/dL
- O₂ delivered to tissues = 5 mL per 100 mL blood (= a-v O₂ difference)
- Only 1/4 of total O₂ is extracted at rest → large reserve
PART 4 — THE TWO CRITICAL SEGMENTS OF THE CURVE
         Flat top (Upper/Plateau zone)        Steep middle zone
         PO₂ 60-100 mm Hg                     PO₂ 20-60 mm Hg
         |_________________________|           |_________________|
              LOADING zone                         UNLOADING zone
              (in the lungs)                       (in the tissues)
Upper Flat Portion (60-100 mm Hg) — LOADING ZONE
- Even if PO₂ drops from 100 → 60 mm Hg, saturation only falls from 97% → 89%
- This is the "safety margin" of the body
- Clinical significance: Patients with mild lung disease (PO₂ drops to 60 mm Hg) still have 89% Hb saturation — adequate O₂ loading
MCQ KEY: A PO₂ of 60 mm Hg is considered the critical threshold. Below this, saturation drops RAPIDLY (entering the steep zone).
Lower Steep Portion (20-60 mm Hg) — UNLOADING ZONE
- Small drop in PO₂ → large release of O₂
- Facilitates O₂ delivery to tissues
- Also where the Bohr effect has its maximum benefit
PART 5 — P50: THE INDEX OF Hb-O₂ AFFINITY
P50 = the PO₂ at which hemoglobin is 50% saturated with O₂
- Normal P50 = 26-27 mm Hg (for adult HbA)
- P50 is the standard index for comparing shifts in the ODC
| P50 change | Meaning | Curve direction |
|---|---|---|
| ↑ P50 (e.g., 30-35 mm Hg) | ↓ Hb-O₂ affinity | Shift RIGHT |
| ↓ P50 (e.g., 18-20 mm Hg) | ↑ Hb-O₂ affinity | Shift LEFT |
MCQ RULE: Higher P50 = lower affinity (needs more O₂ pressure to saturate) = right shift = O₂ releases more readily to tissues.
PART 6 — THE BOHR EFFECT ⭐ (Highest Yield MCQ Topic)
Definition:
The Bohr Effect = the decrease in Hb-O₂ affinity (rightward shift of ODC) caused by a decrease in pH (rise in H⁺) or an increase in PCO₂.
Named after Christian Bohr (Danish physiologist, 1904)
The Molecular Mechanism (Ganong + Biochemistry):
At the tissues:
Metabolism → CO₂ produced
   ↓
CO₂ enters RBCs
   ↓
CO₂ + H₂O → H₂CO₃  [catalyzed by carbonic anhydrase]
   ↓
H₂CO₃ → H⁺ + HCO₃⁻
   ↓
H⁺ binds amino acid residues of DEOXYHEMOGLOBIN
   ↓
Conformational change in Hb → ↓ O₂ affinity
   ↓
O₂ is RELEASED to tissues (curve shifts RIGHT)
At the lungs:
CO₂ diffuses OUT of blood into alveoli
   ↓
↓ PCO₂ → ↓ H⁺ (↑ pH)
   ↓
H⁺ dissociates from Hb
   ↓
Hb returns to high-O₂ affinity state
   ↓
O₂ BINDS to Hb (curve shifts LEFT)
Key biochemical point: Deoxyhemoglobin binds H⁺ MORE actively than oxyhemoglobin. This is why lowering pH (adding H⁺) promotes O₂ release.
MCQ KEY: The Bohr effect is bidirectional - it enhances O₂ LOADING in lungs AND O₂ UNLOADING in tissues. It is an elegant physiological coupling mechanism.
Bohr Effect Graphs:
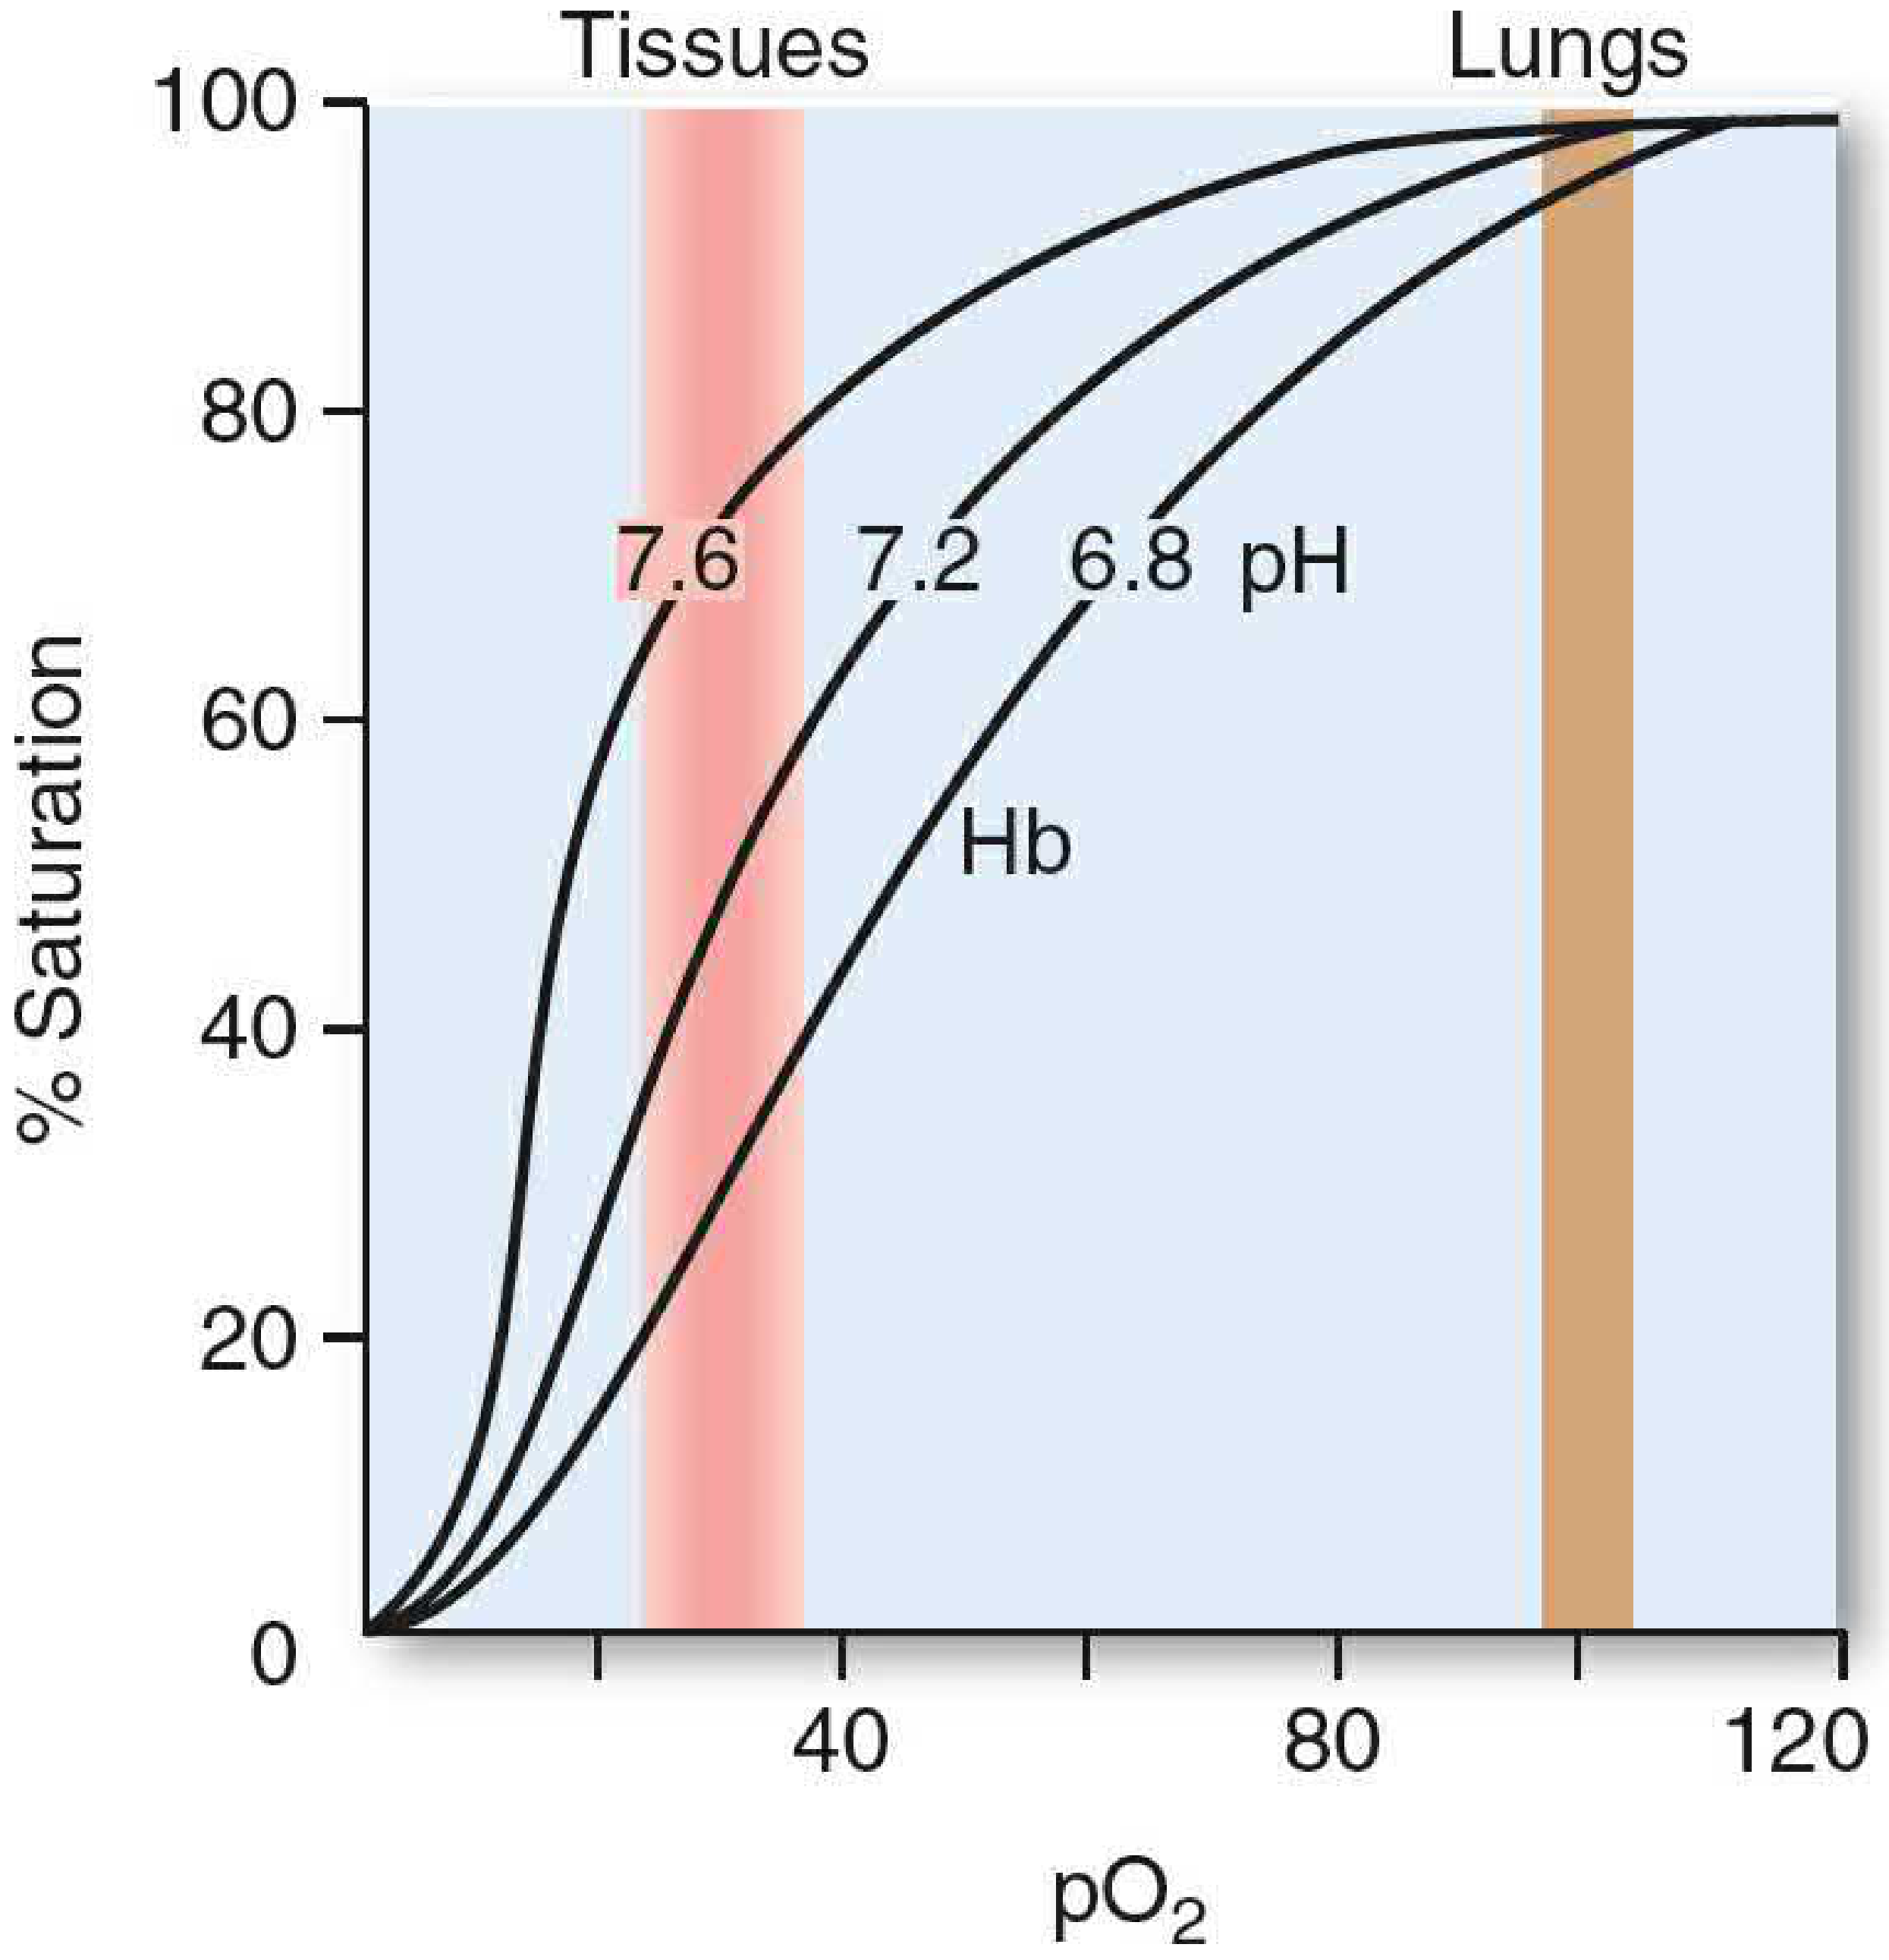
Basic Medical Biochemistry: Effect of pH on Hb-O₂ saturation. As pH decreases (6.8 → 7.2 → 7.6), curve shifts RIGHT. At tissues (low pO₂ zone) more O₂ is released; at lungs (high pO₂ zone) O₂ loading is maintained.
Quantification of Bohr Effect (Ganong):
- Most desaturation in tissues is due to the fall in PO₂ itself
- But an extra 1-2% unsaturation is due to the rise in PCO₂/fall in pH via Bohr effect
- Small but physiologically important augmentation
PART 7 — ALL FACTORS SHIFTING THE ODC
Summary Diagram (Guyton & Hall):
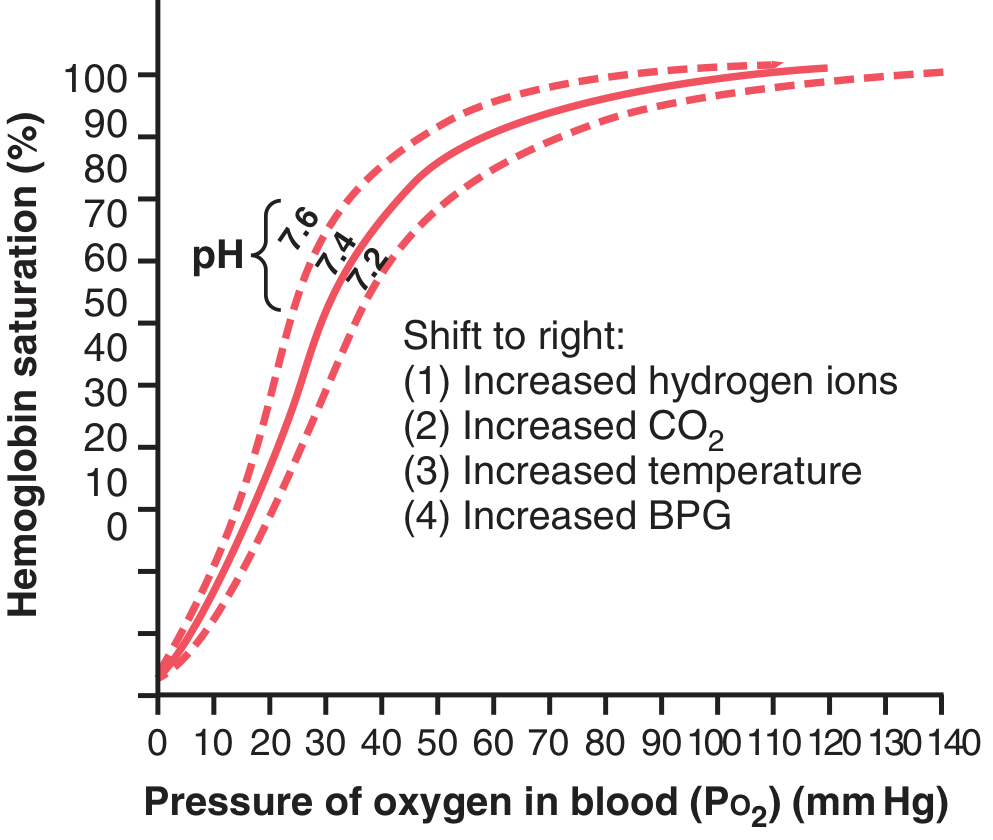
Guyton & Hall: Four factors shift the ODC right — ↑H⁺, ↑CO₂, ↑Temperature, ↑BPG (2,3-DPG). The curve for pH 7.2 is to the right of 7.4.
Effect of Temperature and pH (Ganong):
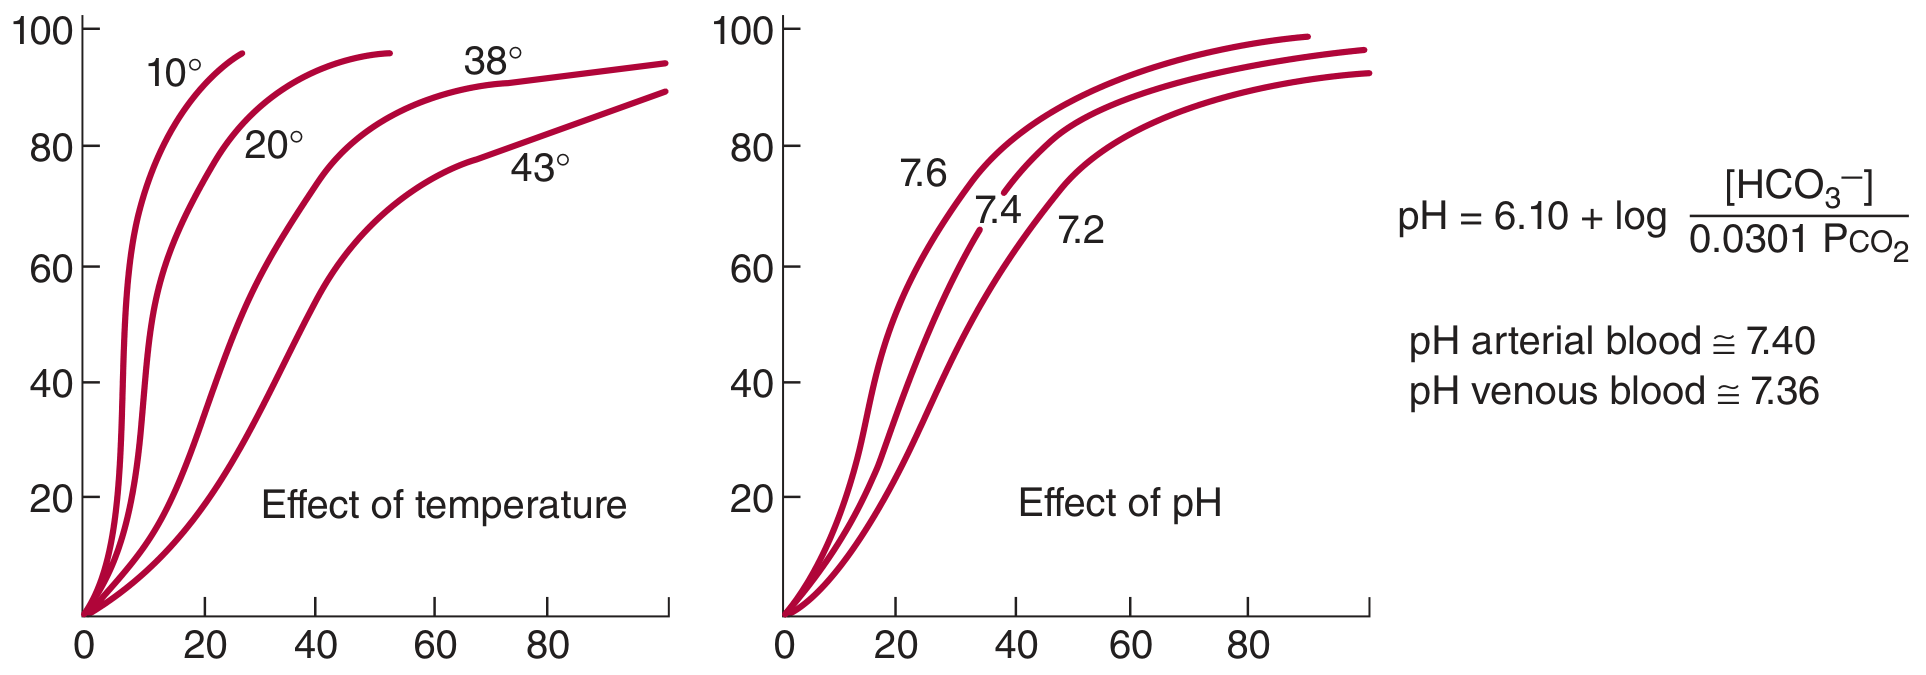
Ganong Figure 35-2: Left panel shows temperature effect (10°C curves shift left; 43°C shifts right). Right panel shows pH effect (7.6 = left shift; 7.2 = right shift).
Complete Master Table: Shifts of ODC
| Factor | Right Shift (↓ affinity, ↑ P50) | Left Shift (↑ affinity, ↓ P50) |
|---|---|---|
| pH | ↓ pH (acidosis) — BOHR EFFECT | ↑ pH (alkalosis) |
| PCO₂ | ↑ PCO₂ — BOHR EFFECT | ↓ PCO₂ |
| Temperature | ↑ Temp (fever, exercise) | ↓ Temp (hypothermia) |
| 2,3-DPG (BPG) | ↑ 2,3-DPG | ↓ 2,3-DPG |
| Hemoglobin type | HbS (sickle) | HbF (fetal), HbA₂ |
| CO | — | CO → carboxyhemoglobin (left shift + ↓ capacity) |
| Methemoglobin | — | Left shift (of remaining Hb) |
| Altitude/chronic hypoxia | ↑ 2,3-DPG → Right shift | — |
Mnemonic for RIGHT shift: "CADET, face RIGHT!"
- CO₂ increased
- Acidosis (↓ pH)
- DPG (2,3-DPG) increased
- Exercise
- Temperature increased
PART 8 — 2,3-DPG (2,3-BPG) — THE MASTER MODULATOR
What is 2,3-DPG?
- Full name: 2,3-diphosphoglycerate (now called 2,3-bisphosphoglycerate / 2,3-BPG)
- A byproduct of glycolysis (Rapoport-Luebering shunt) in RBCs
- Very plentiful in RBCs — at millimolar concentrations
Mechanism:
HbO₂ + 2,3-DPG ⇌ Hb-2,3-DPG + O₂
- 2,3-DPG binds to the β-chains of deoxyhemoglobin (in the central cavity)
- Stabilizes the T (tense/deoxy) state of Hb → ↓ O₂ affinity → RIGHT shift
- ↑ 2,3-DPG → ↑ P50 → more O₂ released
When does 2,3-DPG increase? (→ Right shift)
- Chronic hypoxia (high altitude, anemia, lung disease)
- Exercise (within 60 min - though may not rise in trained athletes)
- Hyperthyroidism (thyroid hormone increases 2,3-DPG)
- Growth hormone, androgens (increase 2,3-DPG)
- Alkalosis (stimulates RBC glycolysis)
When does 2,3-DPG decrease? (→ Left shift)
- Acidosis (inhibits RBC glycolysis)
- Stored blood (bank blood stored in citrate-phosphate-dextrose; 2,3-DPG falls rapidly within 1-2 weeks) → Hb holds O₂ more tightly → O₂ not released well to tissues
MCQ TRAP: Stored blood (transfusion blood) has LOW 2,3-DPG → LEFT shift → ↑ Hb-O₂ affinity → O₂ is NOT released to tissues properly. This is the "storage lesion" of blood transfusion.
2,3-DPG and Altitude Adaptation:
- Acute hypoxia → hyperventilation → respiratory alkalosis → stimulates glycolysis → ↑ 2,3-DPG
- ↑ 2,3-DPG → RIGHT shift → more O₂ released to tissues despite ↓ PO₂
PART 9 — SPECIAL HEMOGLOBIN COMPARISONS (MCQ Classics)
HbA (Adult) vs HbF (Fetal) vs Myoglobin
| Property | HbA (Adult) | HbF (Fetal) | Myoglobin |
|---|---|---|---|
| Subunits | 2α + 2β | 2α + 2γ | Single chain |
| O₂ affinity | Normal | Higher than HbA | Highest of all |
| P50 | ~27 mm Hg | ~20 mm Hg (LEFT shift) | ~3-5 mm Hg |
| Curve shape | Sigmoid | Sigmoid (LEFT) | Hyperbola |
| 2,3-DPG binding | Yes (β-chains bind DPG) | Poor (γ-chains bind DPG weakly) | N/A |
| Function | O₂ transport | Fetal O₂ extraction from maternal blood | O₂ storage in muscle |
| Cooperativity | Yes | Yes | NO cooperativity |
MCQ KEY: HbF has HIGHER O₂ affinity than HbA (LEFT shift) because γ-chains bind 2,3-DPG poorly. This allows the fetus to "steal" O₂ from maternal HbA across the placenta.
MCQ KEY: Myoglobin curve is a rectangular hyperbola (not sigmoid) because it binds only 1 O₂ and has no cooperativity. Its P50 is only ~3-5 mm Hg — it releases O₂ only at VERY low PO₂ (during strenuous exercise when muscle PO₂ drops extremely low).
PART 10 — ABNORMAL HEMOGLOBINS (MCQ Traps)
Carboxyhemoglobin (CO poisoning):
- CO binds Hb with 240× the affinity of O₂
- Double effect:
- ↓ Hb available for O₂ (CO occupies binding sites)
- Left shift of remaining Hb-O₂ curve (CO makes remaining Hb hold O₂ more tightly)
- Result: O₂ not delivered to tissues even if some O₂ is bound
MCQ TRAP: In CO poisoning, SpO₂ (pulse oximetry) reads falsely NORMAL because the oximeter cannot distinguish HbCO from HbO₂. PaO₂ also normal! Diagnosis needs co-oximetry.
Methemoglobin (MetHb):
- Fe²⁺ oxidized to Fe³⁺ (cannot bind O₂)
- Causes: nitrites, dapsone, benzocaine, nitrates
- Left shift of remaining functional Hb (because MetHb stabilizes R state of functional subunits via allosteric effect)
- Treatment: Methylene blue (reduces Fe³⁺ back to Fe²⁺)
HbS (Sickle Cell):
- Right shift of ODC (lower O₂ affinity)
- In deoxy form, HbS polymerizes → sickling
- P50 is higher than normal HbA
PART 11 — TISSUE O₂ BUFFER FUNCTION OF HEMOGLOBIN (Guyton)
This is a beautiful concept:
- When alveolar PO₂ falls to 60 mm Hg (from normal 104 mmHg) → Hb still 89% saturated (only drops 8%)
- The flat upper portion "buffers" O₂ content from wide swings in PO₂
- Even when alveolar PO₂ rises to 500 mm Hg → Hb saturation only rises 3% (97% → 100%)
- Tissue PO₂ stays nearly constant despite massive swings in alveolar PO₂
This is why pulse oximetry (SpO₂) can look fine even when a patient is mildly hypoxic — as long as PO₂ stays above 60 mmHg.
PART 12 — THE BOHR EFFECT IN EXERCISE (Integrated)
During exercise:
- Working muscles produce ↑ CO₂, ↑ lactic acid, ↑ H⁺
- ↑ H⁺ → Bohr effect → RIGHT shift → more O₂ released at any given PO₂
- ↑ Temperature in muscle → further right shift → more O₂ release
- ↑ 2,3-DPG (within ~60 min) → further right shift
- All three factors working together release O₂ at PO₂ as high as 40 mm Hg even when 70% of O₂ already removed
In the lungs during exercise:
- CO₂ is exhaled → ↓ PCO₂ → ↑ pH → LEFT shift → more O₂ loaded onto Hb
- This is the Haldane effect (reverse Bohr in the lungs)
MCQ KEY: The Bohr effect operates at the tissue level (promotes unloading) and is reversed in the lungs (promotes loading). Both are part of the same mechanism.
PART 13 — HALDANE EFFECT (Related, Often Tested Together)
Haldane Effect = when O₂ binds Hb, CO₂ is released (opposite of Bohr effect)
- Oxygenation of Hb in lungs → releases H⁺ → H⁺ + HCO₃⁻ → H₂CO₃ → CO₂ exhaled
- OxyHb is a stronger acid than deoxyHb → releases H⁺ when O₂ binds
- This helps "pump" CO₂ out of blood in the lungs
| Effect | Location | Trigger | Result |
|---|---|---|---|
| Bohr effect | Tissues | ↑ H⁺/CO₂ → ↓ Hb-O₂ affinity | O₂ released |
| Haldane effect | Lungs | O₂ binds Hb → H⁺ released → CO₂ expelled | CO₂ removed |
PART 14 — OXYGEN CONTENT CALCULATIONS (MCQ Math)
Formula:
$$\text{O}_2 \text{ content} = (1.34 \times Hb \times SaO_2) + (0.003 \times PaO_2)$$
Where:
- 1.34 = mL O₂ per gram Hb
- 0.003 = solubility coefficient (mL O₂/dL/mm Hg)
- SaO₂ in decimal form
Example (Normal arterial blood):
= (1.34 × 15 × 0.97) + (0.003 × 95)
= (19.5) + (0.285)
= ~19.8 mL/dL
Example (Venous blood):
= (1.34 × 15 × 0.75) + (0.003 × 40)
= (15.1) + (0.12)
= ~15.2 mL/dL
A-V O₂ difference = 19.8 - 15.2 = ~4.6 mL/dL (~5 mL/dL)
PART 15 — COMPLETE BLOOD GAS VALUES TABLE (Stuart Fox / Ganong)
| Parameter | Arterial | Mixed Venous |
|---|---|---|
| PO₂ | 95-100 mm Hg | 40 mm Hg |
| PCO₂ | 40 mm Hg | 46 mm Hg |
| pH | 7.40 | 7.36 |
| Hb saturation | 97% | 75% |
| O₂ content (dissolved) | 0.29 mL/dL | 0.12 mL/dL |
| O₂ content (combined) | 19.5 mL/dL | 15.1 mL/dL |
PART 16 — TOP MCQ TRAPS TO AVOID
- Sigmoid curve = hemoglobin (cooperative). Hyperbola = myoglobin (no cooperativity).
- P50 normal = 26-27 mm Hg (not 40, not 50, not 30 — it's 26-27).
- Right shift = ↑ P50 = ↓ affinity = more O₂ delivered to tissues (good for delivery).
- Left shift = ↓ P50 = ↑ affinity = O₂ holds on tightly (good for loading, bad for delivery).
- HbF has LEFT shift — γ-chains don't bind 2,3-DPG well → ↑ affinity → extracts O₂ from maternal HbA.
- Stored blood = left shift (↓ 2,3-DPG) — transfused Hb holds O₂ but won't release it well.
- CO poisoning: PaO₂ is NORMAL; SpO₂ is FALSELY NORMAL — diagnose with co-oximetry.
- Methylene blue treats methemoglobinemia (not CO poisoning — that is 100% O₂/hyperbaric O₂).
- Bohr effect ≠ Haldane effect. Bohr = CO₂/H⁺ causes O₂ release. Haldane = O₂ binding causes CO₂ release.
- At PO₂ = 60 mm Hg, Hb saturation is still 89% — the "critical cliff" is below 60 mm Hg.
- Acidosis DECREASES 2,3-DPG (inhibits glycolysis) but STILL shifts curve right (direct Bohr effect dominates acutely).
- Myoglobin P50 ≈ 3-5 mm Hg — extremely high affinity, only releases O₂ under severe local hypoxia.
QUICK RECALL CHEAT SHEET
| Fact | Value |
|---|---|
| O₂ carried by Hb | 97% |
| O₂ dissolved | 3% |
| O₂ capacity (per gram Hb) | 1.34 mL/g |
| Max O₂ capacity (Hb = 15 g/dL) | ~20 mL/dL |
| Arterial Hb saturation | 97% |
| Venous Hb saturation | 75% |
| Normal P50 | 26-27 mm Hg |
| HbF P50 | ~20 mm Hg (left shift) |
| Myoglobin P50 | ~3-5 mm Hg (far left) |
| CO affinity vs O₂ | 240× greater |
| Critical PO₂ threshold | 60 mm Hg |
| a-v O₂ difference | ~5 mL/dL |
| pH arterial | 7.40 |
| pH venous | 7.36 |
Sources: Ganong's Review of Medical Physiology 26th Ed. pp.641-643; Guyton & Hall Medical Physiology 14th Ed. pp.523-528; Fishman's Pulmonary Diseases; Basic Medical Biochemistry 6th Ed. pp.201-203
This is a shared conversation. Sign in to Orris to start your own chat.