
Specific dynamic Action (SDA), explain it
Reading File
Specific Dynamic Action (SDA) refers to the increase in metabolic rate (heat production) that occurs after eating a meal. It is also called the thermic effect of food (TEF) or diet-induced thermogenesis. Proteins cause the greatest SDA (20-30%), carbohydrates less (~5-10%), and fats the least (~2-5%).
Searching sources...
Finding Sources
Finding Sources
Good results. Now let me read the detailed content from the best sources.
Reading File
Reading File
Finding Sources
Now let me read a couple more sections for the biochemical mechanism detail.
Reading File
Reading File
I now have comprehensive information from multiple authoritative textbooks. Here is a complete explanation:
Specific Dynamic Action (SDA)
Definition and Synonyms
Specific Dynamic Action (SDA) is the increase in metabolic rate (heat production) that occurs after ingestion of food. The term is now largely replaced by its modern equivalents:
- Diet-Induced Thermogenesis (DIT) - preferred biochemistry term
- Thermic Effect of Food (TEF) - preferred nutrition/physiology term
These all describe the same phenomenon. As stated in Basic Medical Biochemistry (6e): "DIT was formerly called the specific dynamic action (SDA)."
What Causes SDA?
After eating, the metabolic rate rises because energy is consumed by several processes:
- Secretion of digestive enzymes - energy cost of synthesis and secretion
- Active transport of absorbed nutrients across the intestinal epithelium
- Digestion and absorption of macronutrients
- Synthesis of metabolic reserves - building glycogen, triacylglycerols, and proteins from absorbed nutrients (this is the major part of the cost)
- Distribution and storage of nutrients throughout the body
Per Harper's Illustrated Biochemistry (32e): "A small part of this is the energy cost of secreting digestive enzymes and of active transport of the products of digestion; the major part is the energy cost of synthesizing reserves of glycogen, triacylglycerol, and protein."
Magnitude of SDA by Macronutrient
This is the most exam-important aspect:
| Macronutrient | Rise in Metabolic Rate | Duration |
|---|---|---|
| Protein | ~30% above normal | 3-12 hours |
| Carbohydrate | ~4% above normal | Shorter |
| Fat | ~4% above normal | Shorter |
| Mixed diet (typical) | ~8-10% of total daily intake | - |
-
"After a meal high in protein, the metabolic rate usually begins rising within an hour, reaching a maximum of about 30% above normal, and this rate lasts for 3 to 12 hours. This effect of protein on the metabolic rate is called the specific dynamic action of protein." - Guyton & Hall Medical Physiology
-
Proteins have the highest thermic effect because amino acid catabolism and protein synthesis (including urea cycle activity) are energetically expensive processes.
Why Does Protein Have the Highest SDA?
Several biochemical reasons:
- Deamination and urea synthesis are ATP-consuming processes
- Gluconeogenesis from amino acids requires energy
- Protein synthesis itself has a high ATP cost (~4 ATP equivalents per peptide bond)
- Storage of amino acids as protein or conversion to fat/glucose is metabolically intensive
Contribution to Total Daily Energy Expenditure (TDEE)
The three major components of TDEE are:
- Resting/Basal Metabolic Rate (BMR/RMR) - largest component (~60-70%)
- Physical Activity - variable component
- SDA/DIT/TEF - ~8-10% of total daily energy expenditure
Per Guyton & Hall: "The thermogenic effect of food accounts for about 8% of the total daily energy expenditure in many persons."
Per Basic Medical Biochemistry: "The energy required to process the types and quantities of food in the typical American diet is probably equal to approximately 10% of the kilocalories ingested."
Because DIT is roughly ~10% of intake, it is often ignored in clinical caloric calculations (it approximately cancels out the rounding error in assigning 4/4/9 kcal/g to protein/carbohydrate/fat).
Clinical Relevance
- Obesity assessment: In very sedentary individuals, DIT can represent a meaningful fraction of TDEE. Conditions that blunt DIT (e.g., hypothyroidism, insulin resistance) can contribute to weight gain.
- Thyroid disease: Thyroid hormone is a major regulator of thermogenesis - hyperthyroidism increases BMR and thermogenesis overall.
- Cachexia/cancer: Increased protein catabolism and futile metabolic cycles elevate thermogenesis pathologically.
- Nutritional calculations: DIT is typically not separately calculated in clinical practice; formulas like Harris-Benedict incorporate it implicitly.
Summary Table
| Feature | Detail |
|---|---|
| Old name | Specific Dynamic Action (SDA) |
| Modern names | Diet-Induced Thermogenesis (DIT), Thermic Effect of Food (TEF) |
| Trigger | Food ingestion (all macronutrients) |
| Highest SDA | Protein (~30% rise) |
| Lowest SDA | Fat and carbohydrate (~4% rise) |
| Overall contribution | ~8-10% of total daily energy expenditure |
| Mechanism | Enzyme secretion, active transport, synthesis of metabolic reserves |
Sources:
- Guyton and Hall Textbook of Medical Physiology - "Thermogenic Effect of Food" section
- Basic Medical Biochemistry (6e) - "Diet-Induced Thermogenesis" section
- Harper's Illustrated Biochemistry (32e) - energy reserves section
- Medical Physiology (Boron & Boulpaep) - "Energy expenditure" section
Glycemic index
Glycemic Index (GI) ranks carbohydrate-containing foods by how fast they raise blood glucose compared to a reference food (glucose or white bread). High-GI foods cause rapid spikes; low-GI foods cause slower, steadier rises. It matters clinically in diabetes management, weight control, and cardiovascular risk.
Searching sources...
Finding Sources
Finding Sources
Reading File
Reading File
Reading File
Now let me grab the Harper's content and the GI graph image from Lippincott.
Reading File
Reading File
I have a GI graph image URL. Let me fetch it and compile the full answer.
Loading Image
Here is a comprehensive explanation of Glycemic Index from multiple authoritative textbooks:
Glycemic Index (GI)
Definition
The Glycemic Index is a numerical ranking of carbohydrate-containing foods based on how much they raise blood glucose levels compared to a reference food (glucose or white bread), measured over 2 hours after ingestion of a fixed 50 g carbohydrate portion.
Formula:
GI = (Area under blood glucose curve of test food / Area under blood glucose curve of reference food) × 100
- The reference food (glucose or white bread) is assigned a GI of 100
- Measured as the area under the curve (AUC) of blood glucose above the basal level over 2 hours
(Sleisenger & Fordtran's GI and Liver Disease)
The GI Graph
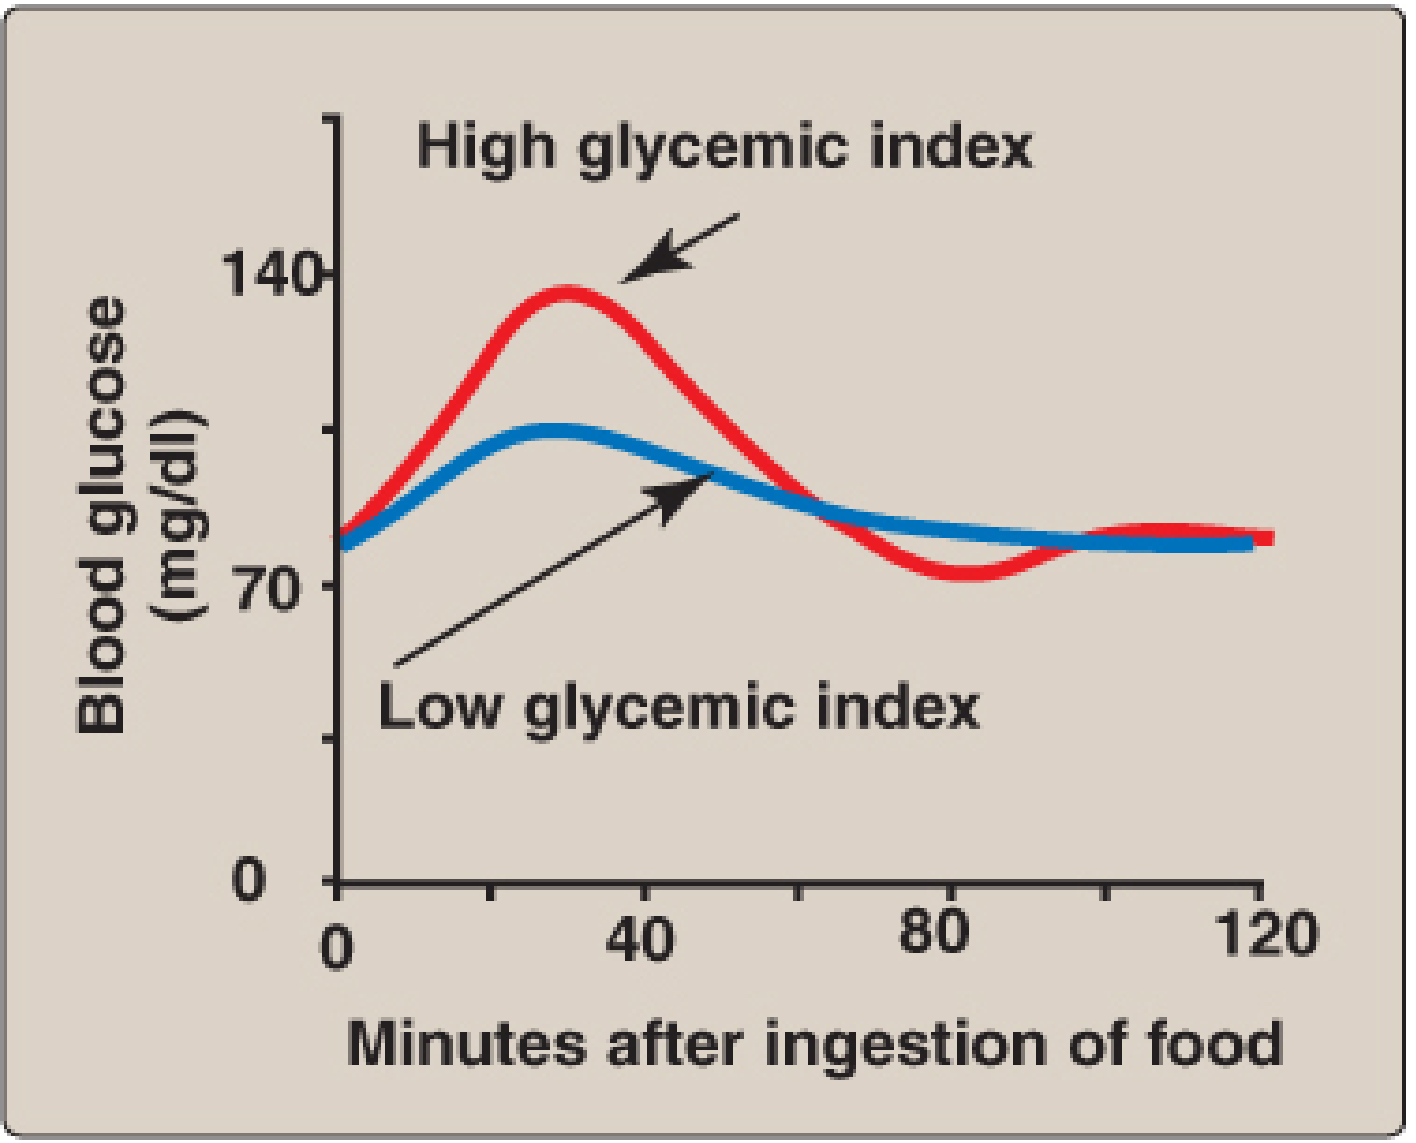
Figure: Blood glucose after high-GI vs. low-GI food. High-GI peaks sharply ~140 mg/dL at ~35 min then drops below baseline. Low-GI produces a modest, sustained rise. - Lippincott Illustrated Reviews: Biochemistry (8e)
GI Classification
| Category | GI Value | Examples |
|---|---|---|
| Low GI | ≤ 55 | Legumes, lentils, most fruits, non-starchy vegetables, nuts, oats |
| Medium GI | 56-69 | Whole wheat bread, brown rice, sweet potato |
| High GI | ≥ 70 | White bread, white rice, potatoes, candy, soda, fruit juice |
- GI ≤ 55 is considered "good"; GI ≥ 70 is considered "bad" (Sleisenger & Fordtran's)
Factors That Determine GI
Several intrinsic and extrinsic factors affect the GI of a food:
1. Type of carbohydrate / starch structure
- Amylose vs. amylopectin: Amylose (straight chain) is hydrolyzed more slowly → lower GI. Amylopectin (branched) is hydrolyzed faster → higher GI
- Monosaccharides: Glucose and galactose have GI ~100%. Fructose and sugar alcohols are absorbed more slowly → lower GI
- Nonstarch polysaccharides (dietary fiber): GI = 0 - not hydrolyzed at all
2. Food processing and physical form
- Whole grain vs. refined flour - grinding disrupts the food matrix and increases GI
- Cooked vs. raw - cooking gelatinizes starch, making it more accessible to amylase → raises GI
- Particle size - finer grinding → faster digestion → higher GI
3. Fiber content
- Soluble fiber slows gastric emptying and glucose absorption → lowers GI
4. Ripeness of fruit
- Riper fruits have more free sugars → higher GI
5. Fat and protein content
- Fat and protein in a meal slow gastric emptying → lower the effective GI of the meal
(Yamada's Textbook of Gastroenterology 7e; Harper's Illustrated Biochemistry 32e)
GI vs. Glycemic Load (GL)
A critical limitation of GI: it measures only the quality of carbohydrate, not the quantity actually consumed.
Glycemic Load = GI × (grams of carbohydrate per serving) / 100
Example - Carrots:
- Carrots have a high GI (rapid hydrolysis)
- But you cannot realistically eat 50 g of carbohydrate from carrots in one serving
- Therefore, carrots have a low glycemic load
| Food | GI | Typical Serving | Carbs/Serving | GL |
|---|---|---|---|---|
| Carrots | High | 1 cup | ~6 g | Low |
| White rice | High | 1 cup | ~45 g | High |
| Watermelon | High | 1 slice | ~11 g | Low |
- A high GL meal: Pancakes + syrup + orange juice
- A low GL meal: Fish + brown rice + mixed greens (Textbook of Family Medicine 9e)
Physiological Effects of High vs. Low GI Foods
| Effect | High GI | Low GI |
|---|---|---|
| Blood glucose rise | Rapid, large spike | Gradual, modest rise |
| Insulin response | Large, rapid spike | Smaller, sustained response |
| Post-meal hunger | Returns quickly (reactive hypoglycemia) | Satiety maintained longer |
| Fat synthesis risk | Higher (excess glucose → lipogenesis) | Lower |
- High-GI foods cause more fluctuation in insulin secretion, which over time promotes insulin resistance
- Low-GI foods result in less fluctuation in insulin secretion and are considered more beneficial (Harper's 32e)
Resistant Starch and GI = 0
Resistant starch and nonstarch polysaccharides have a GI of 0 - they are not digested in the small intestine. Instead, they pass to the large intestine where bacterial fermentation produces butyrate and short-chain fatty acids (SCFAs):
- SCFAs are a fuel source for colonocytes
- Butyrate has antiproliferative activity - protective against colorectal cancer (Harper's 32e)
Clinical Relevance
Diabetes (Type 2)
- Low-GI diets improve postprandial glycemic control and reduce HbA1c
- However, the ADA questions universal adoption of GI as a standard treatment tool for prediabetes/diabetes due to practical complexity
- Glycemic control is improved in type 2 DM when some carbohydrate is replaced by fat (Yamada's 7e)
Obesity
- Low-GI + low glycemic load diets promote greater weight loss vs. conventional low-fat diets, particularly in overweight adolescents
Acne
- High-GI diets are associated with elevated IGF-1, insulin, and leptin levels, which may promote acne (Fitzpatrick's Dermatology)
Ketogenic/epilepsy diet
- Low-GI diet is one dietary therapy for epilepsy, restricting high-GI foods to reduce postprandial glucose and insulin spikes (Bradley & Daroff's Neurology)
Cardiovascular risk
- Diets with high glycemic load are linked to increased cardiovascular risk through hyperinsulinemia, inflammation, and dyslipidemia
Key Points to Remember
- GI compares the area under the 2-hour blood glucose curve vs. a reference food (glucose = 100)
- Low GI ≤ 55; High GI ≥ 70
- Amylose → lower GI; Amylopectin → higher GI
- Fructose → lower GI than glucose
- Dietary fiber → GI = 0 (not digested)
- GI measures quality; Glycemic Load measures quantity × quality
- Low-GI diets benefit diabetic control, weight management, and possibly cancer prevention via butyrate production
Sources:
- Sleisenger & Fordtran's GI and Liver Disease - GI definition and classification
- Yamada's Textbook of Gastroenterology (7e) - factors affecting GI
- Harper's Illustrated Biochemistry (32e) - GI by carbohydrate type, resistant starch
- Lippincott Illustrated Reviews: Biochemistry (8e) - simple sugars and GI graph
- Textbook of Family Medicine (9e) - GI vs. glycemic load with food examples
This is a shared conversation. Sign in to Orris to start your own chat.