Give me a step-by-step: Algorithm to manage ::-- 1) hyponatremia and hypernatremia - What are the different complications to be kept in mind? - How to correct hyponatremia or hypotnatremia, each one selectively step by step? - How to calculate total body water for different ages? - How to calculate sodium body deficit and the rate of correction of serum sodium? 2) How to manage bicarb deficit or anion gaps for metabolic acidosis or other different scenarios? How to calculate deficit and correct sodium bicarb in the body according to weight. How to prepare the ampoules. For bicarb correction, especially those ampoules present in the Pakistani market, 8.4% Or other formulations that are present in the market in Pakistan . At what rate should the correction be used . 3) How to calculate potassium deficit and manage hypo- or hyperkalemia, especially in a calculated way, and what formulas are used for maintaining balances and what formulations of potassium chloride can be used to correct the potassium in the body. What rate should be used. What are the most common clinical mistakes that can happen and should be kept in mind before treating or managing the above balances ( sodium , potassium , bicarb) issues in wards and ER ? What are the most common questions asked in the exam , especially related to FCPS Part 2/ MRCP exams / UsMLe ? Also give memorable mnemonics to remember the most common causes of each balance abnormality. Take references from the latest textbooks of medicine, especially Davidson, Harrison, and Kumar and Clark textbook of medicine. Also give me algorithms, images, and tables for visual representation and remembering. Also give me memorable mnemonics, especially relatable to the disease and easier to remember. Don't give redundant or recurrent mnemonics that are unnecessary and unrelated to the disease.

Reading File
Finding Sources
Finding Sources
Finding Sources
Finding Sources
Finding Sources
Finding Sources
Reading File
Reading File
Reading File
Reading File
Reading File
Reading File
Reading File
Reading File
Searching Images

hyponatremia hypernatremia algorithm management flowchart

Summary : This flowchart provides a comprehensive management algorithm for adults with atopic dermatitis, detailing baseline management, topical therapies, phototherapy, and systemic therapies, including FDA-approved and recommended treatments, maintenance strategies, and escalation steps for inadequate control.

flowchart:
# Baseline Management :
  • Severity Assessment: Assessment of signs of disease, severity of symptoms, comorbidities, and impact on quality of life (QOL).
  • Exacerbating Factor Avoidance: Identify trigger factors (allergens, irritants, etc.) and counsel patients on avoidance.
  • Baseline Therapy: Moisturizers/Emollients (strong recommendation), Bathing Practices (conditional recommendation).

# Initial Pathways :
  • Mild to Severe: Proceed to Topical Therapies.
  • Moderate to Severe: Proceed to Phototherapy & Systemic Therapy.

# Topical Therapies :
  ## Optimized Topical Therapy for Inflamed Areas :
    • TCS (Topical corticosteroids) (FDA, strong recommendation)
    • TCIs (Topical calcineurin inhibitors) (FDA, strong recommendation)
    • Crisaborole ointment (FDA, strong recommendation)
    • Ruxolitinib cream (FDA, strong recommendation)
    • Wet Dressings (strong recommendation)
  ## Ongoing Maintenance with Topical Therapies :
    • Reactive or proactive application for maintenance.
    • Shared decision-making for long-term treatment.
    • Consider patient satisfaction and adherence.
  ## Inadequate Control :
    • If topical therapy and basic management optimized, consider alternative diagnoses.
    • Consider additional treatment with phototherapy and/or systemic agents.

# Phototherapy & Systemic Therapy :
  • Topical agents can be used concurrently with phototherapy or systemic agents for maintenance, rescue, or flares.

# Phototherapy :
  • No specific agents listed; included as a treatment option for moderate to severe cases.

# Systemic Therapies :
  ## Biologics :
    • Dupilumab (FDA, strong recommendation)
    • Tralokinumab (FDA, strong recommendation)
  ## JAK Inhibitors :
    • Upadacitinib (FDA, strong recommendation)
    • Abrocitinib (FDA, strong recommendation)
    • Baricitinib (strong recommendation)
  ## Immunosuppressants :
    • Methotrexate (strong recommendation)
    • Azathioprine (strong recommendation)
    • Cyclosporine (strong recommendation)
    • Mycophenolate mofetil (strong recommendation)
    • Systemic corticosteroids (FDA, strong recommendation against use)

# Key :
  • Green circle: Strong recommendation in favor.
  • Yellow circle: Conditional recommendation in favor.
  • Red circle: Strong recommendation against.
  • Orange circle: Conditional recommendation against.
  • FDA: Indicated for atopic dermatitis.

# Abbreviations :
  • QOL: Quality of Life
  • FDA: Food and Drug Administration
  • TCS: Topical corticosteroids
  • TCI: Topical calcineurin inhibitor

# Layout :
  • The flowchart is organized from baseline management at the top, splitting into two main pathways (mild to severe and moderate to severe), with further branches into topical, phototherapy, and systemic therapies.
  • Maintenance and escalation steps are included for ongoing management and inadequate control.

# Analysis :
  • The algorithm emphasizes starting with baseline management and topical therapies, escalating to phototherapy and systemic therapies for more severe or refractory cases.
  • Strong recommendations are visually highlighted for first-line agents, with systemic corticosteroids strongly discouraged.
  • FDA-approved options are clearly marked, supporting evidence-based decision-making.
  • The flowchart supports a stepwise, patient-centered approach, integrating maintenance and escalation strategies.

Summary : This flowchart provides a comprehensive management algorithm for adults with atopic dermatitis, detailing baseline management, topical therapies, phototherapy, and systemic therapies, including FDA-approved and recommended treatments, maintenance strategies, and escalation steps for inadequate control. flowchart: # Baseline Management : • Severity Assessment: Assessment of signs of disease, severity of symptoms, comorbidities, and impact on quality of life (QOL). • Exacerbating Factor Avoidance: Identify trigger factors (allergens, irritants, etc.) and counsel patients on avoidance. • Baseline Therapy: Moisturizers/Emollients (strong recommendation), Bathing Practices (conditional recommendation). # Initial Pathways : • Mild to Severe: Proceed to Topical Therapies. • Moderate to Severe: Proceed to Phototherapy & Systemic Therapy. # Topical Therapies : ## Optimized Topical Therapy for Inflamed Areas : • TCS (Topical corticosteroids) (FDA, strong recommendation) • TCIs (Topical calcineurin inhibitors) (FDA, strong recommendation) • Crisaborole ointment (FDA, strong recommendation) • Ruxolitinib cream (FDA, strong recommendation) • Wet Dressings (strong recommendation) ## Ongoing Maintenance with Topical Therapies : • Reactive or proactive application for maintenance. • Shared decision-making for long-term treatment. • Consider patient satisfaction and adherence. ## Inadequate Control : • If topical therapy and basic management optimized, consider alternative diagnoses. • Consider additional treatment with phototherapy and/or systemic agents. # Phototherapy & Systemic Therapy : • Topical agents can be used concurrently with phototherapy or systemic agents for maintenance, rescue, or flares. # Phototherapy : • No specific agents listed; included as a treatment option for moderate to severe cases. # Systemic Therapies : ## Biologics : • Dupilumab (FDA, strong recommendation) • Tralokinumab (FDA, strong recommendation) ## JAK Inhibitors : • Upadacitinib (FDA, strong recommendation) • Abrocitinib (FDA, strong recommendation) • Baricitinib (strong recommendation) ## Immunosuppressants : • Methotrexate (strong recommendation) • Azathioprine (strong recommendation) • Cyclosporine (strong recommendation) • Mycophenolate mofetil (strong recommendation) • Systemic corticosteroids (FDA, strong recommendation against use) # Key : • Green circle: Strong recommendation in favor. • Yellow circle: Conditional recommendation in favor. • Red circle: Strong recommendation against. • Orange circle: Conditional recommendation against. • FDA: Indicated for atopic dermatitis. # Abbreviations : • QOL: Quality of Life • FDA: Food and Drug Administration • TCS: Topical corticosteroids • TCI: Topical calcineurin inhibitor # Layout : • The flowchart is organized from baseline management at the top, splitting into two main pathways (mild to severe and moderate to severe), with further branches into topical, phototherapy, and systemic therapies. • Maintenance and escalation steps are included for ongoing management and inadequate control. # Analysis : • The algorithm emphasizes starting with baseline management and topical therapies, escalating to phototherapy and systemic therapies for more severe or refractory cases. • Strong recommendations are visually highlighted for first-line agents, with systemic corticosteroids strongly discouraged. • FDA-approved options are clearly marked, supporting evidence-based decision-making. • The flowchart supports a stepwise, patient-centered approach, integrating maintenance and escalation strategies.

Summary : This flowchart presents a sample management algorithm for patients who are medically inoperable, specifically addressing those with Stage I disease and the use of stereotactic body radiotherapy (SBRT).

flowchart:
# Nodes :
  • Medically Inoperable Patients (rounded rectangle, green)
  • Stage I (rectangle, yellow)
  • SBRT (rectangle, blue)

# Connectors :
  • Downward arrow from "Medically Inoperable Patients" to "Stage I"
  • Downward arrow from "Stage I" to "SBRT"

# Layout :
  • Single vertical sequence: three nodes stacked from top to bottom, each connected by a single downward arrow.

# Analysis :
  • The flowchart outlines a straightforward clinical pathway: Medically inoperable patients with Stage I disease are directed to receive SBRT as the management strategy. There are no branches or alternative pathways depicted.

Summary : This flowchart presents a sample management algorithm for patients who are medically inoperable, specifically addressing those with Stage I disease and the use of stereotactic body radiotherapy (SBRT). flowchart: # Nodes : • Medically Inoperable Patients (rounded rectangle, green) • Stage I (rectangle, yellow) • SBRT (rectangle, blue) # Connectors : • Downward arrow from "Medically Inoperable Patients" to "Stage I" • Downward arrow from "Stage I" to "SBRT" # Layout : • Single vertical sequence: three nodes stacked from top to bottom, each connected by a single downward arrow. # Analysis : • The flowchart outlines a straightforward clinical pathway: Medically inoperable patients with Stage I disease are directed to receive SBRT as the management strategy. There are no branches or alternative pathways depicted.

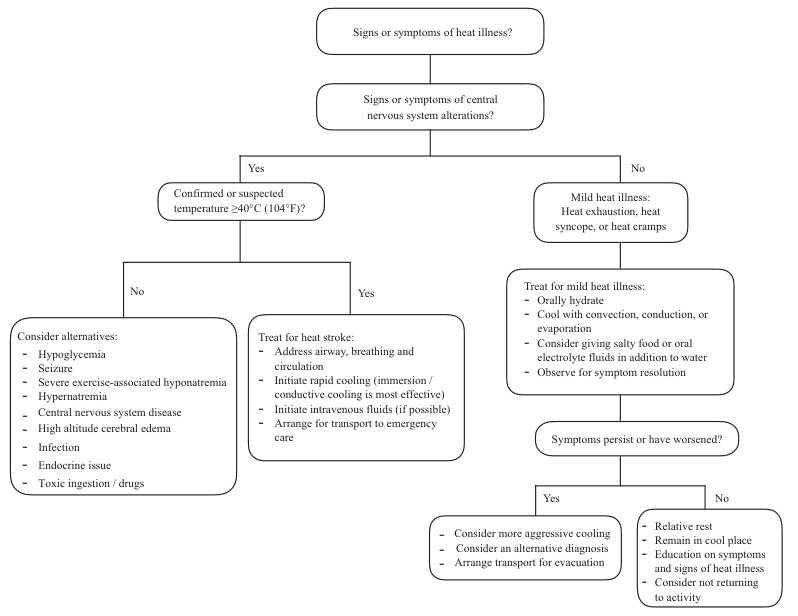
Summary : This flowchart provides a clinical decision-making pathway for the assessment and management of heat illness, distinguishing between mild and severe forms, and guiding further action based on symptoms and temperature findings.

flowchart:
# Nodes :
  • "Signs or symptoms of heat illness?" (rounded rectangle)
  • "Signs or symptoms of central nervous system alterations?" (rounded rectangle)
  • "Confirmed or suspected temperature ≥40°C (104°F)?" (rounded rectangle)
  • "Consider alternatives: Hypoglycemia, Seizure, Severe exercise-associated hyponatremia, Hypernatremia, Central nervous system disease, High altitude cerebral edema, Infection, Endocrine issue, Toxic ingestion / drugs" (rectangle)
  • "Treat for heat stroke: Address airway, breathing and circulation; Initiate rapid cooling (immersion / conductive cooling is most effective); Initiate intravenous fluids (if possible); Arrange for transport to emergency care" (rectangle)
  • "Mild heat illness: Heat exhaustion, heat syncope, or heat cramps" (rounded rectangle)
  • "Treat for mild heat illness: Orally hydrate; Cool with convection, conduction, or evaporation; Consider giving salty food or oral electrolyte fluids in addition to water; Observe for symptom resolution" (rectangle)
  • "Symptoms persist or have worsened?" (rounded rectangle)
  • "Consider more aggressive cooling; Consider an alternative diagnosis; Arrange transport for evacuation" (rectangle)
  • "Relative rest; Remain in cool place; Education on symptoms and signs of heat illness; Consider not returning to activity" (rectangle)

# Connectors :
  • Downward arrows connect each decision node to the next step.
  • From "Signs or symptoms of central nervous system alterations?", "Yes" leads to "Confirmed or suspected temperature ≥40°C (104°F)?", "No" leads to "Mild heat illness: Heat exhaustion, heat syncope, or heat cramps".
  • From "Confirmed or suspected temperature ≥40°C (104°F)?", "Yes" leads to "Treat for heat stroke...", "No" leads to "Consider alternatives...".
  • From "Treat for mild heat illness...", arrow leads to "Symptoms persist or have worsened?".
  • From "Symptoms persist or have worsened?", "Yes" leads to "Consider more aggressive cooling...", "No" leads to "Relative rest...".

# Layout :
  • The flowchart is organized top-down, starting with general symptoms and branching based on the presence of central nervous system alterations and temperature findings.
  • The left branch addresses severe illness (heat stroke and alternatives), while the right branch addresses mild illness and its management.
  • Decision diamonds are not used; all nodes are rounded rectangles or rectangles.
  • Branches merge only at the initial and symptom-persistence decision points.

# Analysis :
  • The flowchart provides a clear, stepwise approach to differentiating between mild and severe heat illness.
  • It emphasizes the importance of central nervous system symptoms and core temperature in identifying heat stroke.
  • Alternative diagnoses are considered if temperature is not elevated despite CNS symptoms.
  • The right branch ensures that mild cases are managed conservatively, with escalation if symptoms persist.
  • The structure supports rapid triage and appropriate escalation of care for potentially life-threatening heat illness.

Summary : This flowchart provides a clinical decision-making pathway for the assessment and management of heat illness, distinguishing between mild and severe forms, and guiding further action based on symptoms and temperature findings. flowchart: # Nodes : • "Signs or symptoms of heat illness?" (rounded rectangle) • "Signs or symptoms of central nervous system alterations?" (rounded rectangle) • "Confirmed or suspected temperature ≥40°C (104°F)?" (rounded rectangle) • "Consider alternatives: Hypoglycemia, Seizure, Severe exercise-associated hyponatremia, Hypernatremia, Central nervous system disease, High altitude cerebral edema, Infection, Endocrine issue, Toxic ingestion / drugs" (rectangle) • "Treat for heat stroke: Address airway, breathing and circulation; Initiate rapid cooling (immersion / conductive cooling is most effective); Initiate intravenous fluids (if possible); Arrange for transport to emergency care" (rectangle) • "Mild heat illness: Heat exhaustion, heat syncope, or heat cramps" (rounded rectangle) • "Treat for mild heat illness: Orally hydrate; Cool with convection, conduction, or evaporation; Consider giving salty food or oral electrolyte fluids in addition to water; Observe for symptom resolution" (rectangle) • "Symptoms persist or have worsened?" (rounded rectangle) • "Consider more aggressive cooling; Consider an alternative diagnosis; Arrange transport for evacuation" (rectangle) • "Relative rest; Remain in cool place; Education on symptoms and signs of heat illness; Consider not returning to activity" (rectangle) # Connectors : • Downward arrows connect each decision node to the next step. • From "Signs or symptoms of central nervous system alterations?", "Yes" leads to "Confirmed or suspected temperature ≥40°C (104°F)?", "No" leads to "Mild heat illness: Heat exhaustion, heat syncope, or heat cramps". • From "Confirmed or suspected temperature ≥40°C (104°F)?", "Yes" leads to "Treat for heat stroke...", "No" leads to "Consider alternatives...". • From "Treat for mild heat illness...", arrow leads to "Symptoms persist or have worsened?". • From "Symptoms persist or have worsened?", "Yes" leads to "Consider more aggressive cooling...", "No" leads to "Relative rest...". # Layout : • The flowchart is organized top-down, starting with general symptoms and branching based on the presence of central nervous system alterations and temperature findings. • The left branch addresses severe illness (heat stroke and alternatives), while the right branch addresses mild illness and its management. • Decision diamonds are not used; all nodes are rounded rectangles or rectangles. • Branches merge only at the initial and symptom-persistence decision points. # Analysis : • The flowchart provides a clear, stepwise approach to differentiating between mild and severe heat illness. • It emphasizes the importance of central nervous system symptoms and core temperature in identifying heat stroke. • Alternative diagnoses are considered if temperature is not elevated despite CNS symptoms. • The right branch ensures that mild cases are managed conservatively, with escalation if symptoms persist. • The structure supports rapid triage and appropriate escalation of care for potentially life-threatening heat illness.

Summary : This flowchart presents a comprehensive management algorithm for erectile dysfunction (ED), detailing the diagnostic steps, treatment options, and follow-up actions based on patient outcomes and specific ED etiologies.

flowchart:
# Nodes :
  • Comprehensive medical and sexual history (rectangle)
  • Before any therapeutic suggestions: Identify patient needs and expectations, shared decision-making, offer conjoint psycho-sexual and medical/physical treatment (rectangle)
  • Identify and treat “curable” causes of erectile dysfunction (rectangle)
  • Lifestyle changes and risk factor modifications (rectangle)
  • Provide education and counselling to patient (and their partner, where appropriate) (rectangle)
  • Intracavernosal injection (rectangle)
  • Vacuum device (rectangle)
  • Oral therapy with PDE5Is (rectangle)
  • Topical/Intra-urethral alprostadil (rectangle)
  • Vasculogenic ED only (rectangle)
  • LI-SWT (with/without PDE5Is) (rectangle)
  • Patients with definitive severe ED (Major non nerve-sparing pelvic surgery/neurogenic or traumatic causes) (rectangle)
  • Assess therapeutic outcomes in terms of: patient self-perceived treatment invasiveness, treatment-associated improvement of erectile function, treatment-related side effects, treatment-associated satisfaction (rectangle)
  • Inadequate treatment outcome (rectangle)
  • Assess adequate use of treatment options, provide new instructions and counselling, re-trial, treatment-associated satisfaction, consider treatment alternative or combined therapies (rectangle)
  • Inadequate treatment outcome (rectangle)
  • Penile prostheses implant (rectangle)

# Connectors :
  • Downward arrows from history and initial assessment to three parallel branches: curable causes, lifestyle changes, education/counselling.
  • Arrows from these branches to four main treatment options: intracavernosal injection, vacuum device, oral therapy with PDE5Is, topical/intra-urethral alprostadil.
  • Vasculogenic ED only leads to LI-SWT (with/without PDE5Is).
  • Arrows from treatment options to assessment of therapeutic outcomes.
  • Patients with definitive severe ED branch directly to assessment of therapeutic outcomes.
  • If outcome is inadequate, arrow leads to reassessment and possible re-trial or alternative/combined therapies.
  • If still inadequate, arrow leads to penile prostheses implant.

# Layout :
  • Top-down hierarchical structure.
  • Initial assessment at the top, branching into three parallel diagnostic/treatment preparation steps.
  • Middle section contains four main treatment modalities in parallel.
  • Vasculogenic ED and severe ED have separate branches.
  • Assessment and follow-up steps are sequential, with possible loops for re-trial.
  • Final node (penile prostheses implant) at the bottom.

# Colour Coding :
  • Diagnosis steps: light blue.
  • Treatment steps: teal green.
  • Follow-up/assessment steps: darker blue.

# Analysis :
  • The algorithm emphasizes a patient-centered approach, starting with comprehensive history and shared decision-making.
  • Multiple initial treatment options are available, with specific branches for vasculogenic and severe ED.
  • Outcomes are regularly assessed, with opportunities for re-trial or alternative therapies before considering surgical intervention.
  • The flowchart supports iterative management, ensuring that less invasive options are exhausted before penile prosthesis implantation.
  • Colour coding helps distinguish between diagnosis, treatment, and follow-up phases.

Summary : This flowchart presents a comprehensive management algorithm for erectile dysfunction (ED), detailing the diagnostic steps, treatment options, and follow-up actions based on patient outcomes and specific ED etiologies. flowchart: # Nodes : • Comprehensive medical and sexual history (rectangle) • Before any therapeutic suggestions: Identify patient needs and expectations, shared decision-making, offer conjoint psycho-sexual and medical/physical treatment (rectangle) • Identify and treat “curable” causes of erectile dysfunction (rectangle) • Lifestyle changes and risk factor modifications (rectangle) • Provide education and counselling to patient (and their partner, where appropriate) (rectangle) • Intracavernosal injection (rectangle) • Vacuum device (rectangle) • Oral therapy with PDE5Is (rectangle) • Topical/Intra-urethral alprostadil (rectangle) • Vasculogenic ED only (rectangle) • LI-SWT (with/without PDE5Is) (rectangle) • Patients with definitive severe ED (Major non nerve-sparing pelvic surgery/neurogenic or traumatic causes) (rectangle) • Assess therapeutic outcomes in terms of: patient self-perceived treatment invasiveness, treatment-associated improvement of erectile function, treatment-related side effects, treatment-associated satisfaction (rectangle) • Inadequate treatment outcome (rectangle) • Assess adequate use of treatment options, provide new instructions and counselling, re-trial, treatment-associated satisfaction, consider treatment alternative or combined therapies (rectangle) • Inadequate treatment outcome (rectangle) • Penile prostheses implant (rectangle) # Connectors : • Downward arrows from history and initial assessment to three parallel branches: curable causes, lifestyle changes, education/counselling. • Arrows from these branches to four main treatment options: intracavernosal injection, vacuum device, oral therapy with PDE5Is, topical/intra-urethral alprostadil. • Vasculogenic ED only leads to LI-SWT (with/without PDE5Is). • Arrows from treatment options to assessment of therapeutic outcomes. • Patients with definitive severe ED branch directly to assessment of therapeutic outcomes. • If outcome is inadequate, arrow leads to reassessment and possible re-trial or alternative/combined therapies. • If still inadequate, arrow leads to penile prostheses implant. # Layout : • Top-down hierarchical structure. • Initial assessment at the top, branching into three parallel diagnostic/treatment preparation steps. • Middle section contains four main treatment modalities in parallel. • Vasculogenic ED and severe ED have separate branches. • Assessment and follow-up steps are sequential, with possible loops for re-trial. • Final node (penile prostheses implant) at the bottom. # Colour Coding : • Diagnosis steps: light blue. • Treatment steps: teal green. • Follow-up/assessment steps: darker blue. # Analysis : • The algorithm emphasizes a patient-centered approach, starting with comprehensive history and shared decision-making. • Multiple initial treatment options are available, with specific branches for vasculogenic and severe ED. • Outcomes are regularly assessed, with opportunities for re-trial or alternative therapies before considering surgical intervention. • The flowchart supports iterative management, ensuring that less invasive options are exhausted before penile prosthesis implantation. • Colour coding helps distinguish between diagnosis, treatment, and follow-up phases.

Reading File
Searching Images

hypokalemia hyperkalemia ECG potassium management

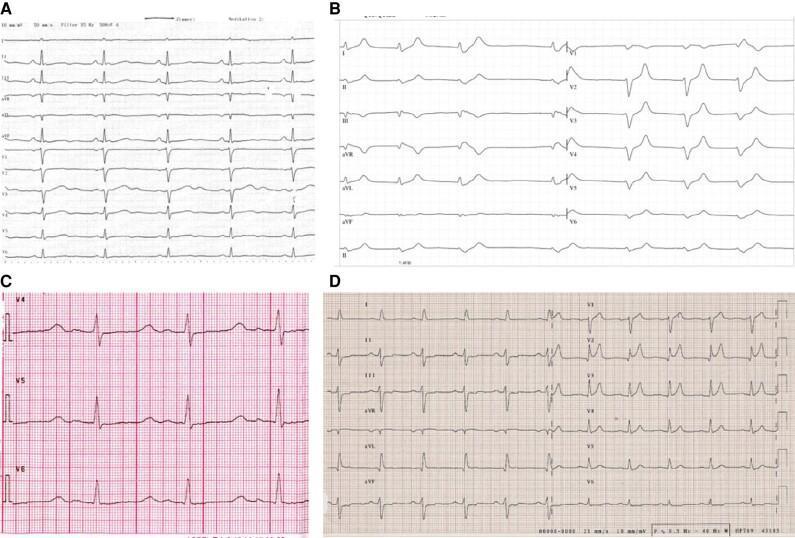
This diagnostic graphic illustrates various electrocardiogram (ECG) manifestations of electrolyte disturbances across four panels. Panel A demonstrates hypokalemia, characterized by flattened T waves and prominent U waves, which can lead to a pseudoprolonged QT interval. Panel B shows hyperkalemia, highlighted by classic tall, peaked 'tented' T waves and narrow QRS complexes. Panel C displays hypocalcemia, primarily showing a prolongation of the ST segment leading to a lengthened QT interval while T wave morphology remains relatively preserved. Panel D represents hypercalcemia, which is characterized by a shortened ST segment and a correspondingly shortened QT interval. The collection serves as an educational comparison chart for clinicians and medical students to recognize pathognomonic rhythm strip changes associated with potassium and calcium imbalances. Key educational concepts include repolarization abnormalities, interval duration changes, and the visual differentiation of metabolic derangements in a clinical cardiology context.

This diagnostic graphic illustrates various electrocardiogram (ECG) manifestations of electrolyte disturbances across four panels. Panel A demonstrates hypokalemia, characterized by flattened T waves and prominent U waves, which can lead to a pseudoprolonged QT interval. Panel B shows hyperkalemia, highlighted by classic tall, peaked 'tented' T waves and narrow QRS complexes. Panel C displays hypocalcemia, primarily showing a prolongation of the ST segment leading to a lengthened QT interval while T wave morphology remains relatively preserved. Panel D represents hypercalcemia, which is characterized by a shortened ST segment and a correspondingly shortened QT interval. The collection serves as an educational comparison chart for clinicians and medical students to recognize pathognomonic rhythm strip changes associated with potassium and calcium imbalances. Key educational concepts include repolarization abnormalities, interval duration changes, and the visual differentiation of metabolic derangements in a clinical cardiology context.

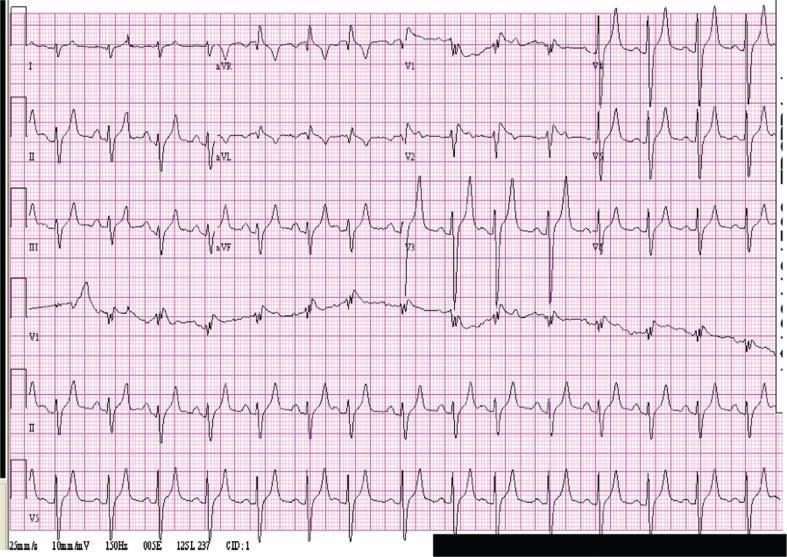
This diagnostic image is a 12-lead electrocardiogram (ECG) demonstrating classic features of severe hyperkalemia in a patient with a serum potassium level of 8.0 mEq/L. The tracing shows prominent, tall, and peaked T-waves, most notable in the precordial leads V2 through V5 and inferior leads II, III, and aVF. These T-waves exhibit a characteristic 'tent-like' morphology with a narrow base and sharp peaks. Additionally, the ECG reveals widening of the QRS complexes, which is particularly evident in leads V1 to V3, indicating delayed intraventricular conduction. There is also an apparent flattening or absence of P-waves, a common finding as hyperkalemia progresses toward a sinoventricular rhythm. This visual represents a critical electrolyte emergency requiring immediate clinical intervention to prevent cardiac arrest. It serves as a classic educational example for medical students and clinicians to recognize the progression of hyperkalemic cardiotoxicity.

This diagnostic image is a 12-lead electrocardiogram (ECG) demonstrating classic features of severe hyperkalemia in a patient with a serum potassium level of 8.0 mEq/L. The tracing shows prominent, tall, and peaked T-waves, most notable in the precordial leads V2 through V5 and inferior leads II, III, and aVF. These T-waves exhibit a characteristic 'tent-like' morphology with a narrow base and sharp peaks. Additionally, the ECG reveals widening of the QRS complexes, which is particularly evident in leads V1 to V3, indicating delayed intraventricular conduction. There is also an apparent flattening or absence of P-waves, a common finding as hyperkalemia progresses toward a sinoventricular rhythm. This visual represents a critical electrolyte emergency requiring immediate clinical intervention to prevent cardiac arrest. It serves as a classic educational example for medical students and clinicians to recognize the progression of hyperkalemic cardiotoxicity.

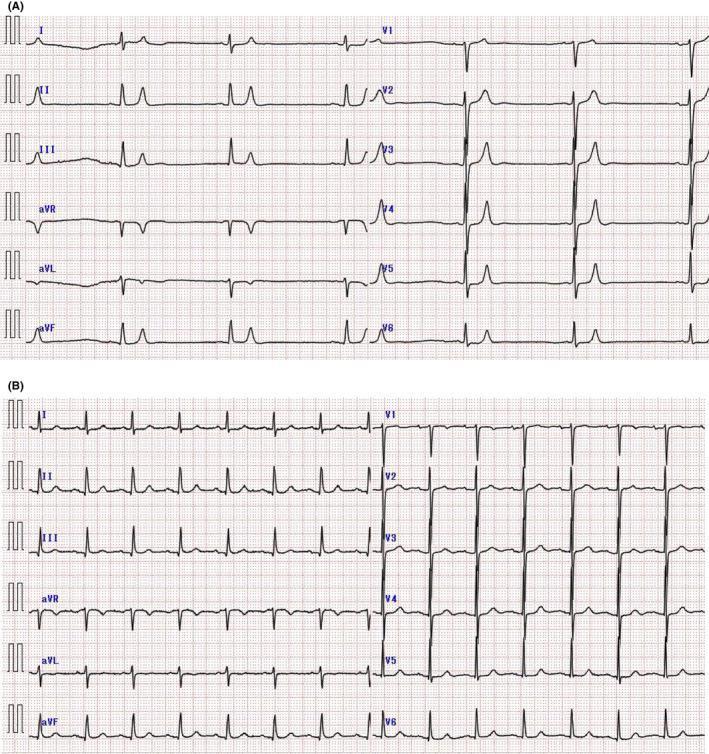
This comparison chart consists of two 12-lead electrocardiograms (ECGs) demonstrating the classic visual progression and resolution of severe hyperkalemia. Panel A shows an ECG from a patient with a serum potassium level of 9.2 mEq/L, characterized by profound bradycardia (37 bpm), diminished P-wave amplitude (atrial standstill precursor), and tall, narrow, 'tented' T-waves most prominent in the precordial leads V1-V6. Panel B displays the follow-up ECG after treatment (serum potassium 4.5 mEq/L), showing a return to normal sinus rhythm with a faster heart rate, clearly defined P-waves, and normalized T-wave morphology. The visual comparison serves as an educational tool for identifying life-threatening electrolyte imbalances, specifically the early to mid-stage ECG manifestations of hyperkalemia. Key clinical markers highlighted include T-wave tenting and the impact of hyperkalemia on cardiac conduction and rhythm stability.

This comparison chart consists of two 12-lead electrocardiograms (ECGs) demonstrating the classic visual progression and resolution of severe hyperkalemia. Panel A shows an ECG from a patient with a serum potassium level of 9.2 mEq/L, characterized by profound bradycardia (37 bpm), diminished P-wave amplitude (atrial standstill precursor), and tall, narrow, 'tented' T-waves most prominent in the precordial leads V1-V6. Panel B displays the follow-up ECG after treatment (serum potassium 4.5 mEq/L), showing a return to normal sinus rhythm with a faster heart rate, clearly defined P-waves, and normalized T-wave morphology. The visual comparison serves as an educational tool for identifying life-threatening electrolyte imbalances, specifically the early to mid-stage ECG manifestations of hyperkalemia. Key clinical markers highlighted include T-wave tenting and the impact of hyperkalemia on cardiac conduction and rhythm stability.

Searching Images

metabolic acidosis anion gap algorithm diagnosis

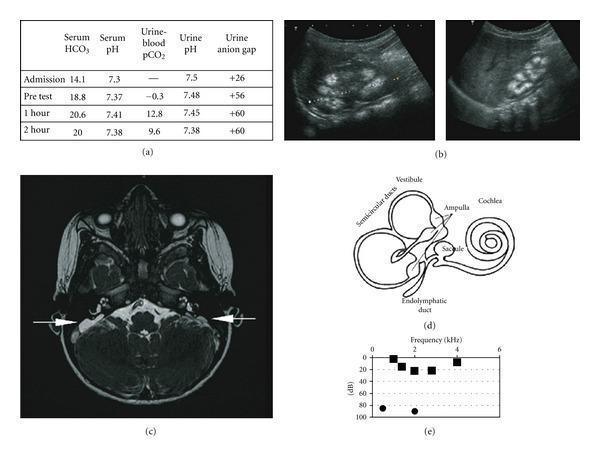
This composite educational image illustrates the clinical and diagnostic features of distal renal tubular acidosis (dRTA) associated with sensorineural hearing loss. (a) Data table showing results of a bicarbonate loading test, characterized by low urine-to-blood pCO2 gradient and positive urinary anion gap. (b) Renal ultrasound images of the left and right kidneys demonstrating medullary nephrocalcinosis, visualized as multiple hyperechoic foci within the renal pyramids. (c) Axial FIESTA (Fast Imaging Employing Steady-state Acquisition) cerebral MRI scan showing bilateral enlargement of the endolymphatic sacs (indicated by white arrows), a common finding in Pendred syndrome or dRTA with hearing loss. (d) Anatomical schematic of the inner ear, labeling the cochlea, vestibule, semicircular ducts, and endolymphatic duct. (e) Audiogram plot showing frequency (kHz) versus decibels (dB), depicting significant hearing impairment. The collection integrates metabolic laboratory data, diagnostic radiology (ultrasound and MRI), and functional audiological testing to present a comprehensive case of a hereditary renal-otological syndrome.

This composite educational image illustrates the clinical and diagnostic features of distal renal tubular acidosis (dRTA) associated with sensorineural hearing loss. (a) Data table showing results of a bicarbonate loading test, characterized by low urine-to-blood pCO2 gradient and positive urinary anion gap. (b) Renal ultrasound images of the left and right kidneys demonstrating medullary nephrocalcinosis, visualized as multiple hyperechoic foci within the renal pyramids. (c) Axial FIESTA (Fast Imaging Employing Steady-state Acquisition) cerebral MRI scan showing bilateral enlargement of the endolymphatic sacs (indicated by white arrows), a common finding in Pendred syndrome or dRTA with hearing loss. (d) Anatomical schematic of the inner ear, labeling the cochlea, vestibule, semicircular ducts, and endolymphatic duct. (e) Audiogram plot showing frequency (kHz) versus decibels (dB), depicting significant hearing impairment. The collection integrates metabolic laboratory data, diagnostic radiology (ultrasound and MRI), and functional audiological testing to present a comprehensive case of a hereditary renal-otological syndrome.

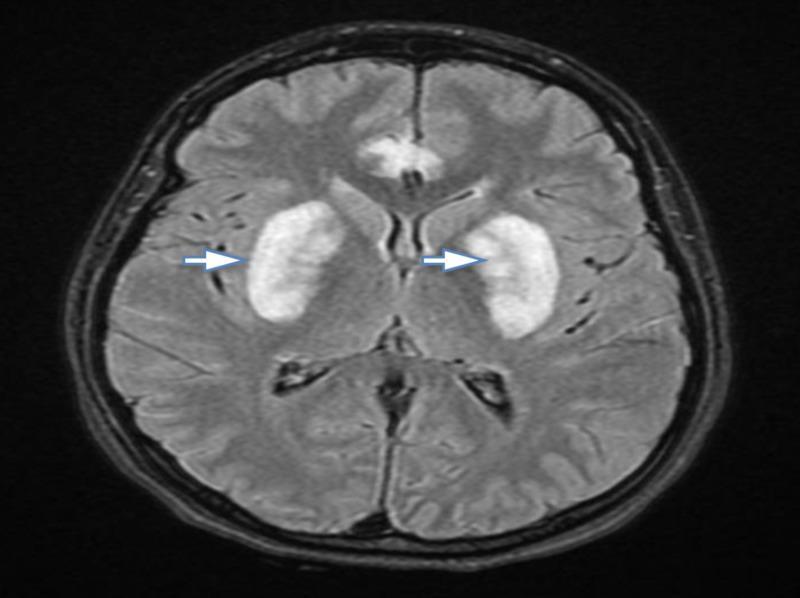
This diagnostic image is an axial Fluid-Attenuated Inversion Recovery (FLAIR) magnetic resonance imaging (MRI) scan of the brain. The image demonstrates prominent, symmetrical hyperintensities localized within the bilateral basal ganglia, specifically involving the putamina (indicated by white arrows). Additionally, a smaller, heterogeneous area of increased signal intensity is visible in the anterior midline of the cerebral parenchyma. These visual findings are characteristic of bilateral putaminal necrosis, often associated with acute toxic metabolic encephalopathy, such as methanol poisoning. The image highlights key radiological features used in neuroradiology for identifying toxic insults to the deep gray matter structures. It serves as an educational example for medical students and clinicians in identifying specific imaging patterns related to systemic toxicity and high-anion gap metabolic acidosis.

This diagnostic image is an axial Fluid-Attenuated Inversion Recovery (FLAIR) magnetic resonance imaging (MRI) scan of the brain. The image demonstrates prominent, symmetrical hyperintensities localized within the bilateral basal ganglia, specifically involving the putamina (indicated by white arrows). Additionally, a smaller, heterogeneous area of increased signal intensity is visible in the anterior midline of the cerebral parenchyma. These visual findings are characteristic of bilateral putaminal necrosis, often associated with acute toxic metabolic encephalopathy, such as methanol poisoning. The image highlights key radiological features used in neuroradiology for identifying toxic insults to the deep gray matter structures. It serves as an educational example for medical students and clinicians in identifying specific imaging patterns related to systemic toxicity and high-anion gap metabolic acidosis.

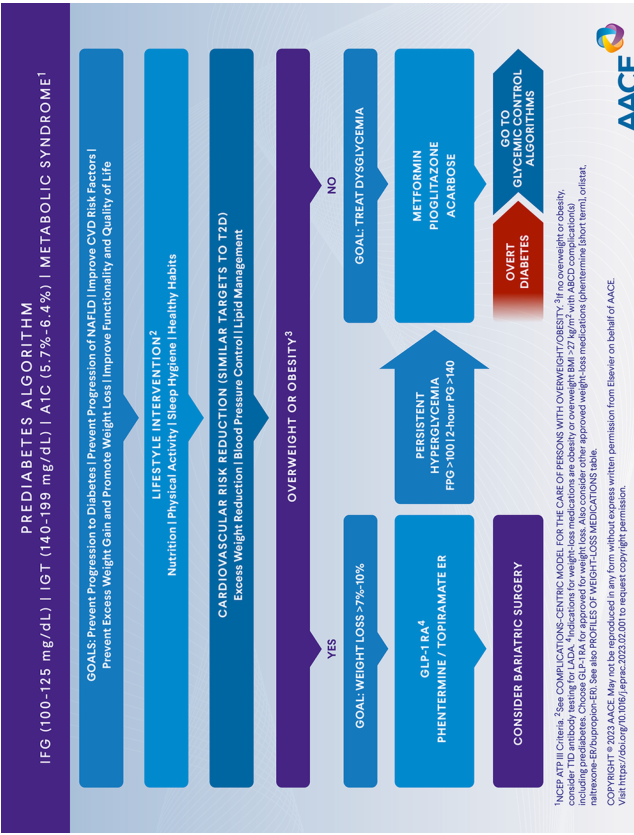
Summary : This flowchart presents the AACE Prediabetes Algorithm for managing individuals with impaired fasting glucose (IFG), impaired glucose tolerance (IGT), or metabolic syndrome, outlining goals, interventions, and escalation steps based on weight status and glycemic control.

flowchart:
# Nodes :
  • "IFG (100-125 mg/dL) | IGT (140-199 mg/dL) | A1C 5.7%-6.4% | METABOLIC SYNDROME¹" (rectangle)
  • "GOALS: Prevent Progression to Diabetes | Prevent Progression of NAFLD | Improve CVD Risk Factors | Prevent Excess Weight Gain and Promote Weight Loss | Improve Functionality and Quality of Life" (rectangle)
  • "LIFESTYLE INTERVENTION² Nutrition | Physical Activity | Sleep Hygiene | Healthy Habits" (rectangle)
  • "CARDIOVASCULAR RISK REDUCTION (SIMILAR TARGETS TO T2D) Excess Weight Reduction | Blood Pressure Control | Lipid Management" (rectangle)
  • "OVERWEIGHT OR OBESITY³" (diamond)
  • "NO" (arrow label)
  • "GOAL: TREAT DYSLYCEMIA" (rectangle)
  • "METFORMIN | PIOGLITAZONE | ACARBOSE" (rectangle)
  • "OVERT DIABETES" (hexagon, red)
  • "GO TO GLYCEMIC CONTROL ALGORITHMS" (rectangle)
  • "YES" (arrow label)
  • "GOAL: WEIGHT LOSS 7%-10%" (rectangle)
  • "PERSISTENT HYPERGLYCEMIA (A1C ≥ 6.0% or FPG ≥ 110/2hPG ≥ 140)" (rectangle)
  • "GLP-1 RA⁴ PHENTERMINE / TOPIRAMATE ER" (rectangle)
  • "CONSIDER BARIATRIC SURGERY" (rectangle)

# Connectors :
  • Linear flow from initial diagnosis node through goals, lifestyle intervention, and cardiovascular risk reduction.
  • Decision diamond "OVERWEIGHT OR OBESITY³" splits into two branches:
    – "NO" branch leads to "GOAL: TREAT DYSLYCEMIA" → "METFORMIN | PIOGLITAZONE | ACARBOSE".
    – "YES" branch leads to "GOAL: WEIGHT LOSS 7%-10%".
  • From "GOAL: WEIGHT LOSS 7%-10%", arrow leads to "PERSISTENT HYPERGLYCEMIA (A1C ≥ 6.0% or FPG ≥ 110/2hPG ≥ 140)".
  • From "PERSISTENT HYPERGLYCEMIA", arrow leads to "GLP-1 RA⁴ PHENTERMINE / TOPIRAMATE ER".
  • From there, arrow leads to "CONSIDER BARIATRIC SURGERY".
  • If "OVERT DIABETES" is reached, arrow points to "GO TO GLYCEMIC CONTROL ALGORITHMS".

# Layout :
  • Vertical, stepwise arrangement with decision diamond splitting into two horizontal branches.
  • Rightward flow for escalation of therapy.
  • Red hexagon highlights transition to overt diabetes.

# Analysis :
  • The algorithm prioritizes lifestyle intervention and cardiovascular risk reduction for all prediabetes patients.
  • Weight status determines the next steps: those without overweight/obesity focus on dysglycemia treatment, while those with overweight/obesity target weight loss.
  • Pharmacologic therapy is introduced for persistent hyperglycemia or failure to achieve weight loss goals.
  • Bariatric surgery is considered for further escalation.
  • Overt diabetes triggers transition to a separate glycemic control pathway.

Summary : This flowchart presents the AACE Prediabetes Algorithm for managing individuals with impaired fasting glucose (IFG), impaired glucose tolerance (IGT), or metabolic syndrome, outlining goals, interventions, and escalation steps based on weight status and glycemic control. flowchart: # Nodes : • "IFG (100-125 mg/dL) | IGT (140-199 mg/dL) | A1C 5.7%-6.4% | METABOLIC SYNDROME¹" (rectangle) • "GOALS: Prevent Progression to Diabetes | Prevent Progression of NAFLD | Improve CVD Risk Factors | Prevent Excess Weight Gain and Promote Weight Loss | Improve Functionality and Quality of Life" (rectangle) • "LIFESTYLE INTERVENTION² Nutrition | Physical Activity | Sleep Hygiene | Healthy Habits" (rectangle) • "CARDIOVASCULAR RISK REDUCTION (SIMILAR TARGETS TO T2D) Excess Weight Reduction | Blood Pressure Control | Lipid Management" (rectangle) • "OVERWEIGHT OR OBESITY³" (diamond) • "NO" (arrow label) • "GOAL: TREAT DYSLYCEMIA" (rectangle) • "METFORMIN | PIOGLITAZONE | ACARBOSE" (rectangle) • "OVERT DIABETES" (hexagon, red) • "GO TO GLYCEMIC CONTROL ALGORITHMS" (rectangle) • "YES" (arrow label) • "GOAL: WEIGHT LOSS 7%-10%" (rectangle) • "PERSISTENT HYPERGLYCEMIA (A1C ≥ 6.0% or FPG ≥ 110/2hPG ≥ 140)" (rectangle) • "GLP-1 RA⁴ PHENTERMINE / TOPIRAMATE ER" (rectangle) • "CONSIDER BARIATRIC SURGERY" (rectangle) # Connectors : • Linear flow from initial diagnosis node through goals, lifestyle intervention, and cardiovascular risk reduction. • Decision diamond "OVERWEIGHT OR OBESITY³" splits into two branches: – "NO" branch leads to "GOAL: TREAT DYSLYCEMIA" → "METFORMIN | PIOGLITAZONE | ACARBOSE". – "YES" branch leads to "GOAL: WEIGHT LOSS 7%-10%". • From "GOAL: WEIGHT LOSS 7%-10%", arrow leads to "PERSISTENT HYPERGLYCEMIA (A1C ≥ 6.0% or FPG ≥ 110/2hPG ≥ 140)". • From "PERSISTENT HYPERGLYCEMIA", arrow leads to "GLP-1 RA⁴ PHENTERMINE / TOPIRAMATE ER". • From there, arrow leads to "CONSIDER BARIATRIC SURGERY". • If "OVERT DIABETES" is reached, arrow points to "GO TO GLYCEMIC CONTROL ALGORITHMS". # Layout : • Vertical, stepwise arrangement with decision diamond splitting into two horizontal branches. • Rightward flow for escalation of therapy. • Red hexagon highlights transition to overt diabetes. # Analysis : • The algorithm prioritizes lifestyle intervention and cardiovascular risk reduction for all prediabetes patients. • Weight status determines the next steps: those without overweight/obesity focus on dysglycemia treatment, while those with overweight/obesity target weight loss. • Pharmacologic therapy is introduced for persistent hyperglycemia or failure to achieve weight loss goals. • Bariatric surgery is considered for further escalation. • Overt diabetes triggers transition to a separate glycemic control pathway.


Complete Electrolyte Management Guide

Sodium | Potassium | Bicarbonate

References: Harrison's 22E (2025), Goldman-Cecil Medicine, Tintinalli's EM, Schwartz's Surgery, Brenner & Rector's Kidney

PART 1: SODIUM DISORDERS


TOTAL BODY WATER (TBW) - How to Calculate

TBW varies with age, sex, and body composition (fat has almost no water):
PopulationTBW FactorExample (70 kg)
Adult male0.6 x weight (kg)42 L
Adult female0.5 x weight (kg)35 L
Elderly male0.5 x weight (kg)-
Elderly female0.45 x weight (kg)-
Infant / child0.7-0.75 x weight (kg)-
Neonate0.8 x weight (kg)-
Mnemonic for TBW factors - "Boys Are Bigger Babies"
  • Boy (adult male) = 0.6
  • Adult female = 0.5
  • Baby (child) = 0.7
  • Baby newborn = 0.8

HYPONATREMIA

Definition and Classification

Hyponatremia = serum Na+ < 135 mEq/L

Step 1 - Is it TRUE hyponatremia? Check osmolality first.

Serum Na+ < 135 mEq/L
         |
         v
Check Serum Osmolality
         |
    +----+----+----+
    |         |    |
HYPEROSMOLAR  NORMAL  HYPO-OSMOLAR
(>290)      (275-290)  (<275)
    |         |         |
Glucose   Pseudo-    TRUE Hyponatremia
Mannitol  hyponatremia  (excess free water)
Glycine   (lipids,      |
         proteins)    Go to Step 2
Correction for hyperglycemia: Na+ corrected = Measured Na+ + 1.6 x [(glucose - 100) / 100] mEq/L

Step 2 - Classify by Volume Status

TRUE HYPONATREMIA (hypo-osmolar)
            |
    Check Volume Status
    (JVP, skin turgor, BP, urine Na+)
            |
   +--------+--------+
   |        |        |
HYPOVOLEMIC EUVOLEMIC HYPERVOLEMIC
(low vol)  (normal)  (edema)
   |        |         |
Urine Na+  Urine Na+ Urine Na+
<20 mEq/L  >40 mEq/L  <20 mEq/L
   |        |         |
Extrarenal  SIADH     CHF
GI losses  Hypothyroid Cirrhosis
Burns      Addison's  Nephrotic
   |       Polydipsia  Renal failure
Renal causes          |
if Na >20             Restrict Na+
(diuretics,           and water
CSW, RTA)             + Diuretics

Mnemonic for Causes of Hyponatremia by Volume Status

HYPOVOLEMIC - "GADS" (you feel sad when you're volume-depleted):
  • GI losses (vomiting, diarrhea)
  • Adrenal insufficiency (Addison's)
  • Diuretics (thiazides > loop)
  • Sweat / skin losses / CSW (cerebral salt wasting)
EUVOLEMIC - "SCHIPT" (each cause SHIFTs water in):
  • SIADH
  • Cort deficiency (glucocorticoid)
  • Hypothyroidism
  • Inappropriate IV fluids
  • Polydipsia (primary)
  • Too little solute (beer potomania, tea-and-toast)
HYPERVOLEMIC - "CCR" (like Creedence Clearwater Revival - fluid overload is rock solid):
  • CHF (congestive heart failure)
  • Cirrhosis
  • Renal failure / Nephrotic syndrome

Step 3 - Calculate Sodium Deficit

Formula (from Tintinalli's / Schwartz's Surgery):
$$\text{Na Deficit (mEq)} = [\text{Na}\text{desired} - \text{Na}\text{measured}] \times (\text{TBW factor} \times \text{weight kg})$$
Example: 60 kg adult male, Na = 118 mEq/L, target 125 mEq/L
  • Na deficit = (125 - 118) x (0.6 x 60) = 7 x 36 = 252 mEq

Step 4 - Rate of Correction (CRITICAL!)

The Golden Rules (Harrison's 22E, Goldman-Cecil):
ScenarioMax Correction Rate
Asymptomatic / chronic (>48 h)≤0.5 mEq/L/hr; max 8-10 mEq/L in 24 h
Symptomatic / acute (<48 h)1-2 mEq/L/hr UNTIL symptoms resolve
Absolute max in any 24 h≤12 mEq/L/day
Absolute max in any 48 h≤18 mEq/L/48 h
High-risk for ODS (alcoholic, malnourished, cirrhotic, K+ depleted)≤8 mEq/L/day
Key Danger: Correcting too fast causes Osmotic Demyelination Syndrome (ODS) = formerly called Central Pontine Myelinolysis (CPM). Risk is highest in chronic hyponatremia.

Treatment by Clinical Scenario

1. Asymptomatic Hyponatremia (mild/moderate, Na 125-134):
  • Correct underlying cause
  • Water restriction (1-1.5 L/day for SIADH)
  • Correct over 48 h using oral intake or isotonic saline
2. Severe Symptomatic Hyponatremia (seizures, coma, Na <120):
  • Give 3% NaCl (hypertonic saline)
  • Dose: 1-2 mL/kg/hr IV until symptoms resolve OR Na rises by 4-6 mEq/L
  • Alternative: 100 mL bolus of 3% NaCl (repeat up to 2-3 times)
  • Then SLOW DOWN - do not exceed 12 mEq/L in 24 h
3. Hypovolemic Hyponatremia:
  • Volume replacement with 0.9% Normal Saline (NS)
  • Restoring volume will suppress ADH naturally - watch for overcorrection!
4. SIADH (euvolemic):
  • Water restriction first line
  • If refractory: Vaptans (tolvaptan), demeclocycline, or urea
  • Treat underlying cause (lung cancer, drugs, CNS)
5. Hypervolemic (CHF, cirrhosis):
  • Sodium and water restriction
  • Loop diuretics (furosemide)

Saline Concentrations Reference

SolutionNa+ Content
0.9% NS (normal saline)154 mEq/L
0.45% NS (half-normal)77 mEq/L
3% NaCl (hypertonic)513 mEq/L
Lactated Ringer's130 mEq/L

HYPERNATREMIA

Definition

Serum Na+ > 145 mEq/L - ALWAYS means relative water deficit (too little water OR too much sodium)

Mnemonic for Causes: "Too Little WATER In = Too High Na+"

W - Water loss (insensible - fever, burns, sweating) A - ADH absent or resistance (Diabetes Insipidus - central or nephrogenic) T - Tube feeds / inadequate water intake in elderly/unconscious E - Electrolyte loading (hypertonic saline, sodium bicarb excess, hyperaldosteronism) R - Renal losses (osmotic diuresis - DM, mannitol, post-obstruction)

Algorithm for Hypernatremia

HYPERNATREMIA (Na+ > 145)
        |
Always = Free Water DEFICIT
        |
  Check Urine Osmolality
  +--------+--------+
  |                 |
>700 mOsm/L      <300 mOsm/L
(concentrated)   (dilute)
  |                 |
Extrarenal loss    Diabetes Insipidus
(GI, skin, resp)   (central or nephrogenic)
                   Check with DDAVP test

Free Water Deficit Formula

$$\text{Free Water Deficit (L)} = \text{TBW} \times \left[\frac{\text{Na}_\text{actual}}{140} - 1\right]$$
Example: 70 kg male, Na = 162 mEq/L
  • FWD = (0.6 x 70) x [(162/140) - 1] = 42 x 0.157 = 6.6 L

Rate of Correction for Hypernatremia

SettingRate
Acute (<24 h onset)1 mEq/L/hr (max 12 mEq/L/day)
Chronic / unknown≤0.5 mEq/L/hr; max 10 mEq/L/day
Danger of too-fast correction: Cerebral edema, seizures, brain herniation (opposite problem from hyponatremia - brain swells when Na drops too fast)

Fluids Used for Hypernatremia Correction

SituationFluid
Hemodynamically unstable0.9% NS first (resuscitate)
Stable, mild dehydration0.45% NS (hypotonic)
Pure water deficit (DI)5% Dextrose in Water (D5W)
Oral availableFree water via NG tube / oral

Key Complications to Keep in Mind

Electrolyte ErrorComplication
Too-fast correction of hyponatremiaODS / Central Pontine Myelinolysis
Too-fast correction of hypernatremiaCerebral edema, herniation
Too-rapid hypertonic saline infusionVolume overload, pulmonary edema
Hyponatremia + K+ depletion (uncorrected)Worsens ODS risk
SIADH treated with NSCan WORSEN hyponatremia (if urine is more concentrated than NS)
Thiazide + hyponatremiaStop thiazide; can precipitate profound hyponatremia


PART 2: METABOLIC ACIDOSIS & BICARBONATE MANAGEMENT


Step 1 - Confirm Metabolic Acidosis

  • pH < 7.35
  • HCO3- < 22 mEq/L
  • Expected pCO2 compensation: pCO2 = (1.5 x HCO3) + 8 ± 2 (Winter's formula)
  • If pCO2 < expected: added respiratory alkalosis
  • If pCO2 > expected: added respiratory acidosis

Step 2 - Calculate Anion Gap (AG)

$$\text{Anion Gap} = \text{Na}^+ - (\text{Cl}^- + \text{HCO}_3^-)$$
Normal AG = 8-12 mEq/L (some labs: 6-14)
Correct for hypoalbuminemia: $$\text{Corrected AG} = \text{Measured AG} + 2.5 \times (4 - \text{albumin g/dL})$$

Mnemonic for HIGH Anion Gap: "MUDPILES" (classic & direct)

LetterCause
MMethanol
UUremia (renal failure)
DDKA / AKA (Diabetic / Alcoholic Ketoacidosis)
PPropylene glycol / Paracetamol (late)
IIsoniazid / Iron
LLactic acidosis
EEthylene glycol
SSalicylates

Mnemonic for NORMAL AG (Hyperchloremic) Acidosis: "USED CARP"

LetterCause
UUreteroenterostomy
SSmall bowel fistula / diarrhea
EExtra chloride (saline excess)
DDrugs (acetazolamide, cholestyramine)
CCarbonic anhydrase inhibitor
AAddison's / Adrenal insufficiency
RRenal Tubular Acidosis (RTA 1, 2, 4)
PParenteral nutrition (TPN)

Step 3 - Calculate Bicarbonate Deficit

Formula (Goldman-Cecil Medicine):
$$\text{HCO}_3^- \text{ Deficit (mEq)} = (25 - [\text{HCO}3^-]\text{measured}) \times \text{weight (kg)} \times 0.5$$
(Some sources use 0.4-0.5 for the distribution factor - also written as weight/2)
Example: 70 kg patient, HCO3 = 10 mEq/L
  • Deficit = (25 - 10) x 70 x 0.5 = 15 x 35 = 525 mEq

Sodium Bicarbonate Ampoules Available in Pakistan

FormulationNa+ contentHCO3- contentVolume
8.4% NaHCO3 (standard)1 mEq/mL1 mEq/mL50 mL = 50 mEq
4.2% NaHCO3 (neonatal/dilute)0.5 mEq/mL0.5 mEq/mL20-50 mL
7.5% NaHCO30.89 mEq/mL0.89 mEq/mL50 mL = 44.6 mEq
In Pakistan: The most commonly available in hospitals (tertiary/emergency) is 8.4% NaHCO3 50 mL ampoules (50 mEq per vial). These are hypertonic and must always be diluted before use.
How to Prepare for Infusion:
  1. Calculate deficit (formula above)
  2. Give half the deficit in the first 4-8 hours (do NOT give full deficit at once - risk of overcorrection, paradoxical CSF acidosis, hypokalemia, hypocalcemia, hypernatremia)
  3. Dilute 8.4% NaHCO3 in D5W or sterile water (NOT in NS - risks hypernatremia)
  4. For IV infusion, dilute to ~1.4% (isotonic): Add 50 mEq (50 mL of 8.4%) to 300 mL D5W = ~350 mL of 1.4% NaHCO3
  5. Infuse at 50-100 mL/hr (adjust based on deficit and recheck ABG in 2-4 h)

When to Give Bicarbonate

pHAction
pH > 7.2Treat underlying cause only; bicarb not needed
pH 7.1-7.2Consider bicarb if cause is non-lactic (RTA, diarrhea, hyperchloremic)
pH < 7.1Bicarb indicated (especially in hyperchloremic, RTA, or renal failure)
Lactic acidosisBicarb generally NOT recommended - treat underlying cause
DKABicarb only if pH < 6.9 and severe; may worsen outcome otherwise
Pakistan Ward Tip: In DKA and lactic acidosis, do NOT routinely give bicarb. This is a common ward mistake. Focus on IV fluids, insulin (for DKA), and treating the cause.

Rate of Sodium Bicarbonate Infusion

  • Never bolus full dose - give as slow infusion
  • Standard rate: 1-2 mEq/kg over 1-4 hours, then reassess ABG
  • Maintenance infusion: 0.5-1 mEq/kg/hr
  • In cardiac arrest (PEA/asystole refractory): 1 mEq/kg IV bolus (8.4%, undiluted)
  • Neonates: Use 4.2% only; bolus NaHCO3 in neonates can cause intraventricular hemorrhage

Anion Gap Algorithm (Visual)

Metabolic Acidosis (HCO3- < 22, pH < 7.35)
              |
     Calculate Anion Gap
     Na - (Cl + HCO3)
              |
    +----+----+
    |         |
HIGH AG      NORMAL AG
(>12)       (8-12)
    |         |
"MUDPILES"  "USED CARP"
Methanol     RTA / Diarrhea
Uremia       Saline excess
DKA/AKA      Addison's
Propylene    Ureteroentero-
glycol       stomy
Isoniazid
Lactic acid
Ethylene glycol
Salicylates
    |
Check Delta-Delta Ratio (AG acidosis)
Delta ratio = (AG - 12) / (24 - HCO3)
    <0.4:  Pure normal AG acidosis
   0.4-1:  Mixed AG + normal AG acidosis
   1-2:    Pure AG metabolic acidosis
    >2:    AG acidosis + concurrent metabolic ALKALOSIS


PART 3: POTASSIUM DISORDERS


Key Physiology

  • Normal serum K+ = 3.5-5.0 mEq/L
  • 98% of body K+ is intracellular (ICF K+ ~140 mEq/L vs ECF ~4 mEq/L)
  • Every 0.1 unit drop in pH raises K+ by ~0.5 mEq/L (shift from ICF to ECF)
  • Insulin, beta-2 agonists, alkalosis all drive K+ INTO cells (lower serum K+)

HYPOKALEMIA (K+ < 3.5 mEq/L)

Mnemonic for Causes: "DIGGER" (K+ gets dug out of the body)

LetterCause
DDiuretics (loop + thiazide - most common)
IInsulin excess / Insulin drip
GGI losses (vomiting, diarrhea, NG suction, fistulas)
GGlucocorticoids / Mineralocorticoid excess (Conn's, Cushing's)
EExcessive beta-2 agonists (salbutamol, terbutaline)
RRenal tubular disorders (RTA type 1 & 2, Bartter's, Gitelman's)

Total Body Potassium Deficit

The correlation between serum K+ and total body deficit is non-linear and imprecise (Harrison's 22E, Comprehensive Clinical Nephrology):
Serum K+Estimated Total Body Deficit
3.0-3.5 mEq/L~150-300 mEq
2.5-3.0 mEq/L~300-600 mEq
2.0-2.5 mEq/L~600-1000 mEq
< 2.0 mEq/L>1000 mEq
Practical Formula (rough estimate): $$\text{K deficit (mEq)} \approx (4.0 - \text{measured K}^+) \times (0.4 \times \text{weight kg})$$
(Factor 0.4 = approximate distribution volume)

Treatment of Hypokalemia

Step 1: Always check and correct magnesium first!
  • Hypomagnesemia causes refractory hypokalemia (Mg is needed for K+ retention by the kidney)
  • Give Mg sulfate 2g IV if Mg <0.8 mmol/L
Step 2: Route of replacement
SeverityRouteDose
Mild (K+ 3.0-3.5)Oral KCl40-80 mEq/day in divided doses
Moderate (K+ 2.5-3.0)Oral or IV60-120 mEq/day
Severe (K+ <2.5 or symptomatic)IV KClPer formula; central or peripheral with ECG monitoring
Step 3: IV KCl Rates (CRITICAL - most common ward mistake)
RouteMaximum RateMaximum Concentration
Peripheral IV10 mEq/hr40 mEq/250 mL = 0.16%
Central venous lineUp to 20 mEq/hr (with ECG monitoring)40 mEq/100 mL
Emergency only40 mEq/hr maximum in ICU with continuous ECGOnly via central line
NEVER give IV potassium as a bolus - FATAL CARDIAC ARREST

KCl Formulations Available in Pakistan

FormulationConcentrationUse
KCl 7.45% (ampoule)20 mEq in 10 mL (2 mEq/mL)Must dilute before IV use
Slow-K tablets8 mEq / tabletOral
Sando-K effervescent12 mEq K + 8 mEq HCO3 / tabletOral
Kaon oral syrup20 mEq/15 mLOral
KCl in IV bagsPre-mixed 20 mEq in 500 mL or 1000 mLReady to use
Preparation from 7.45% ampoule (20 mEq/10 mL):
  • For peripheral infusion: Add 20-40 mEq KCl to 500 mL NS or D5W (makes 40-80 mEq/L)
  • Infuse at 83-125 mL/hr (= 10 mEq/hr)
  • Oral is always preferred over IV when GI tract is functioning

ECG Changes in Hypokalemia vs Hyperkalemia

ECG manifestations of electrolyte disturbances - showing hypokalemia (flat T waves, U waves) and hyperkalemia (peaked T waves, widened QRS)
K+ LevelECG Changes
Mild hypokalemia (3.0-3.5)Flat T waves, prominent U waves
Severe hypokalemia (<2.5)ST depression, inverted T, prominent U (looks like prolonged QT)
Mild hyperkalemia (5.5-6.5)Peaked (tented) T waves
Moderate (6.5-7.5)Prolonged PR, widened QRS
Severe (>7.5)Sine wave pattern, P waves disappear
Critical (>8.0)VF / cardiac arrest
Severe hyperkalemia ECG with peaked T waves, QRS widening, at K 8.0 mEq/L

HYPERKALEMIA (K+ > 5.0 mEq/L)

Mnemonic for Causes: "ARDU" (Urdu for "hard" - hard problem to fix)

LetterCause
AACE inhibitors / ARBs / Aldosterone antagonists (spironolactone)
RRenal failure (acute or chronic - most common)
DDrugs: NSAIDs, trimethoprim, heparin, beta-blockers, digoxin toxicity
UUnder-the-skin (tissue breakdown): Rhabdomyolysis, hemolysis, burns, tumor lysis
Also: Addison's disease, acidosis (each 0.1 pH drop = +0.5 mEq/L K+), pseudohyperkalemia (fist clenching, hemolysis in tube)

Treatment of Hyperkalemia - The 4-Step "CDRS" Approach

Step 1: C - Cardiac Membrane Stabilization
  • Calcium Gluconate 10%: 10-20 mL IV over 2-5 min (or Calcium Chloride 10 mL of 10% - 3x more elemental Ca)
  • Onset: 1-3 minutes; Duration: 30-60 minutes
  • REPEAT in 5 min if ECG not improved
  • First given when ECG changes are present (peaked T, widened QRS)
Step 2: D - Drive K+ into cells (redistribute)
  • Insulin (regular/soluble) 10 units IV + 50 mL of 50% Dextrose (to prevent hypoglycemia)
    • Or 10 units insulin in 100 mL of 25% dextrose over 15-30 min
  • Onset: 15-30 min; Lowers K+ by 0.5-1.5 mEq/L
  • Salbutamol (albuterol) nebulization: 10-20 mg (high dose)
    • Onset: 30 min; Lowers K+ by 0.5-1.0 mEq/L (works additively with insulin)
  • Sodium bicarbonate (if metabolic acidosis): 1 mEq/kg IV; modest K+ reduction
Step 3: R - Remove K+ from body
  • Furosemide 40-80 mg IV (if some renal function)
  • Ion-exchange resins:
    • Patiromer or Sodium Zirconium Cyclosilicate (SZC) - preferred (Harrison's 22E)
    • Calcium Resonium (older SPS) - oral 15-30g, or 30-60g retention enema
  • Dialysis - most effective; needed in ESRD or refractory cases
Step 4: S - Sustained treatment / prevent recurrence
  • Stop offending drugs (ACEi, ARB, K+-sparing diuretics, NSAIDs)
  • Low potassium diet (<2 g/day)
  • Treat underlying cause

Potassium Replacement Rate Summary Table

SeveritySerum K+RouteRateMonitoring
Mild3.0-3.5Oral40-60 mEq/dayRepeat K+ in 24h
Moderate2.5-3.0Oral/IV10 mEq/hr peripheralRepeat K+ in 6-8h
Severe<2.5IV (central preferred)10-20 mEq/hrContinuous ECG
Life-threatening arrhythmiaAnyIV centralUp to 40 mEq/hr ICUContinuous ECG mandatory


PART 4: CLINICAL MISTAKES - WARD & ER


Most Common Dangerous Mistakes

MistakeWhy It's DangerousPrevention
Correcting Na+ too fast in chronic hyponatremiaODS (central pontine myelinolysis) - irreversibleNever >10-12 mEq/L/24h
Correcting Na+ too fast in hypernatremiaCerebral edema, seizures, herniationNever >10 mEq/L/24h
Giving NS to SIADH patientWorsens hyponatremia (NS Na 154, urine may be 600+ - net free water retention)Use hypertonic saline or water restriction
IV potassium bolusCardiac arrest (VF/VT)Always dilute; max 10 mEq/hr peripheral
Not checking Mg before replacing K+Refractory hypokalemia continuesAlways replace Mg first
Bicarb in lactic acidosis/DKA (mild-moderate)Paradoxical CNS acidosis; worsens outcomeOnly use if pH <6.9 (DKA) or <7.1 severe
Not rechecking electrolytes after bicarb correctionOvershoot alkalosis, hypocalcemia (tetany), hypokalemia (K+ shifts into cells)Recheck ABG + electrolytes in 2-4h
Not diluting 8.4% NaHCO3Extravasation necrosis; hypertonicityAlways dilute to 1.4% for infusion
Hyperkalemia = stop and give only calciumCalcium only stabilizes membrane; must also remove K+All 4 steps needed
Diagnosing hyponatremia without checking osmolalityMisses pseudohyponatremia and treats inappropriatelyAlways check serum osmolality first
Thiazide diuretics continuing in hyponatremiaThiazides block diluting segment - STOP themStop thiazide immediately


PART 5: EXAM HIGH-YIELD QUESTIONS

FCPS Part 2 / MRCP / USMLE - Most Common Exam Scenarios

Sodium

ScenarioAnswer
Patient with SIADH - what fluid?Water restriction; if severe: hypertonic saline
Max rate of Na correction in chronic hyponatremia10 mEq/L in 24h; 8 mEq/L if high-risk
Complication of rapid correction of hyponatremiaOsmotic Demyelination Syndrome (ODS/CPM)
Best test to differentiate CSW vs SIADHFractional excretion of urate (high in CSW only)
Old man, thiazide, low Na - what happened?Thiazide-induced hyponatremia - impaired diluting segment
Hypernatremia in unconscious patient - formulaFree water deficit = TBW x [(Na actual/140) - 1]
Correct Na for hyperglycemiaAdd 1.6 mEq/L per 100 mg/dL glucose above normal

Potassium

ScenarioAnswer
ECG shows peaked T + wide QRS - first drug?Calcium gluconate IV (membrane stabilization)
Hypokalemia not correcting despite replacementCheck serum magnesium - hypomagnesemia
Patient on digoxin + hypokalemia - dangerDigoxin toxicity worsened (K+ competes with digoxin at Na/K ATPase)
Periodic paralysis + hypokalemia in Asian maleThyrotoxic periodic paralysis - treat with propranolol + K+
K+ 6.5 + no ECG changes - first step?Check for pseudohyperkalemia first (repeat with non-hemolyzed sample)
Max rate of peripheral IV K+10 mEq/hr in 40 mEq/250 mL concentration
What drug causes hyperkalemia + metabolic acidosis + low renin/aldosterone?ACE inhibitor (type 4 RTA / hyporeninemic hypoaldosteronism)

Bicarbonate / Acid-Base

ScenarioAnswer
Anion gap >20 in alcoholic - cause?Alcoholic ketoacidosis (AKA)
DKA + treated with fluids - now hyperchloremic acidosis, why?Saline (Cl- load) - normal AG acidosis now
Winter's formula: HCO3 is 12 - expected pCO2?(1.5 x 12) + 8 ± 2 = 24-28; if actual pCO2 < 24 = additional respiratory alkalosis
Bicarb dose formula (exam standard)(25 - measured HCO3) x weight x 0.5
Salicylate poisoning - acid-base pattern?Mixed: High-AG metabolic acidosis + respiratory alkalosis
RTA type 1 featureUrine pH cannot fall below 5.5 even in acidosis; hypokalemia; nephrocalcinosis
RTA type 4 featureHyperkalemia + metabolic acidosis; low aldosterone or resistance; urine pH <5.5
Most common cause of high AG acidosis in hospitalLactic acidosis


SUMMARY FORMULA CARD

Cut-Out Quick Reference

SODIUM:
Na Deficit (mEq)   = (Na_desired - Na_measured) × TBW
Free Water Deficit = TBW × [(Na_actual/140) - 1]
TBW: male=0.6, female=0.5, child=0.7, neonate=0.8
Max correction:    ≤10 mEq/L/24h; ≤18/48h

BICARBONATE:
HCO3 Deficit (mEq) = (25 - HCO3) × weight × 0.5
Give HALF the deficit in first 4-8h
8.4% NaHCO3 = 1 mEq/mL (50 mL ampoule = 50 mEq)
Dilute in D5W to 1.4% before infusion

ANION GAP:
AG = Na - (Cl + HCO3)    Normal = 8-12
Correct for albumin: +2.5 per 1 g/dL below 4
High AG = MUDPILES
Normal AG = USED CARP

POTASSIUM:
K+ Deficit ≈ (4.0 - K+) × (0.4 × weight)
IV max rate (peripheral): 10 mEq/hr
IV max rate (central ICU): 20-40 mEq/hr
NEVER bolus IV K+
Treat hyperkalemia: Calcium → Insulin/Dextrose → Remove (furosemide/resin/dialysis)
Always replace Mg with K+

References: Harrison's Principles of Internal Medicine 22E (2025, McGraw Hill); Goldman-Cecil Medicine International Edition; Tintinalli's Emergency Medicine: A Comprehensive Study; Schwartz's Principles of Surgery 11E; Brenner and Rector's The Kidney; Comprehensive Clinical Nephrology 7E; Morgan & Mikhail's Clinical Anesthesiology 7E.
This is a shared conversation. Sign in to Orris to start your own chat.