
diabetic ketoacidosis , protocol and managements
diabetic ketoacidosis DKA management protocol flowchart
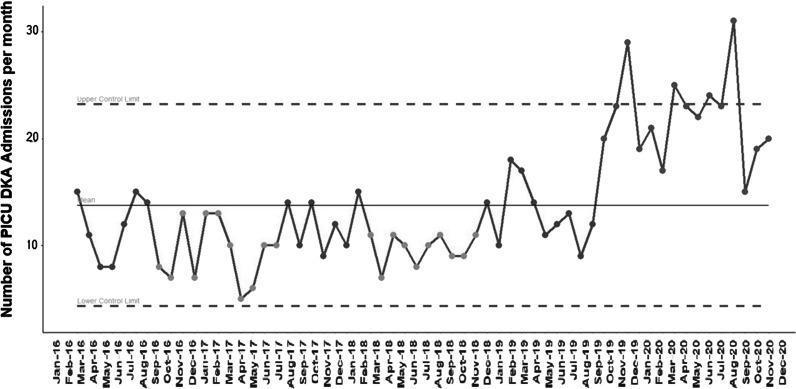
This medical timeline chart is a Statistical Process Control (SPC) chart, specifically a longitudinal line graph illustrating the monthly frequency of Pediatric Intensive Care Unit (PICU) admissions for Diabetic Ketoacidosis (DKA) from January 2016 to December 2020. The chart features three horizontal reference lines: a solid central line representing the mean, and two dashed lines representing the Upper Control Limit (UCL) and Lower Control Limit (LCL). From early 2016 through mid-2019, the data exhibits common-cause variation, with admission numbers remaining stable and generally fluctuating below the mean, rarely approaching the LCL (approximately 5 admissions). A significant shift toward special-cause variation begins in late 2019. Starting around November 2019 and continuing through 2020, there is a sustained increase in both volume and volatility. Multiple data points in 2020 (notably around March, July, and August) exceed the UCL, peaking at over 30 admissions per month. This visual evidence demonstrates a statistically significant upward trend in severe DKA cases requiring intensive care, potentially correlating with healthcare delivery changes or delayed presentations during the COVID-19 pandemic.
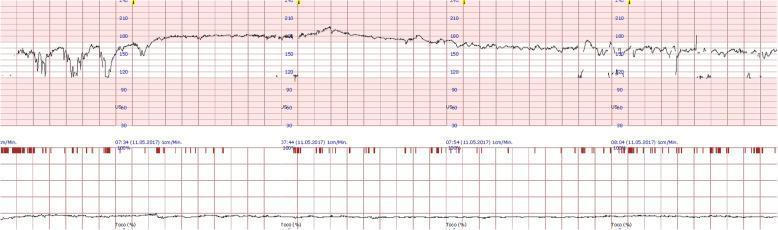
This diagnostic image shows a continuous fetal cardiotocography (CTG) tracing at 27 weeks of gestation, illustrating the impact and subsequent resolution of maternal diabetic ketoacidosis (DKA) on fetal well-being. The top panel displays the fetal heart rate (FHR) in beats per minute (bpm), while the bottom panel shows tocodynamometry (maternal uterine activity). The initial 30-minute segment (left side) demonstrates pathological features: a baseline tachycardia exceeding 160 bpm, significantly reduced baseline variability (flattened tracing), and repetitive variable decelerations characterized by sharp, transient drops in FHR. These findings are clinically significant as they reflect fetal stress or hypoxia secondary to maternal metabolic derangement. Following medical intervention (saline and insulin), the latter half of the tracing shows a clear normalization: the FHR baseline stabilizes around 150-160 bpm, normal beat-to-beat variability reappears, and decelerations resolve. This timeline-based progression serves as an educational example of how maternal acute illness affects fetal heart rate patterns and the rapid response to appropriate clinical stabilization.
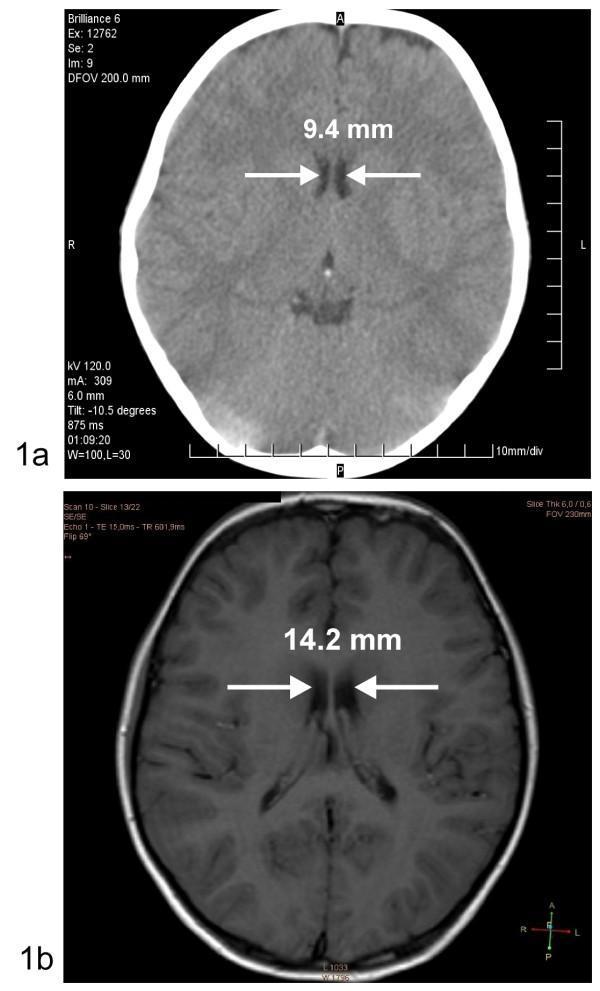
This educational comparison features two axial neuroimaging views (CT and MRI) demonstrating changes in the intercaudate diameter as a marker for cerebral edema. Top Image (1a): Non-contrast axial CT scan during an acute episode of diabetic ketoacidosis (DKA). White arrows highlight a narrowed intercaudate diameter of 9.4 mm, a finding suggestive of cerebral swelling and sulcal effacement. The bone of the skull appears hyperdense (bright white), while the brain parenchyma shows lower contrast between gray and white matter. Bottom Image (1b): T1-weighted non-contrast axial MRI of the same patient after clinical recovery. The intercaudate diameter has expanded to 14.2 mm, indicating the resolution of edema. The MRI provides superior soft-tissue contrast, clearly differentiating the hypointense (dark) cerebrospinal fluid (CSF) in the ventricles from the brain parenchyma. This comparison serves as a diagnostic illustration of the radiological manifestations of cerebral edema and its subsequent resolution, emphasizing the importance of measuring ventricular dimensions like the intercaudate distance in monitoring pediatric DKA complications.
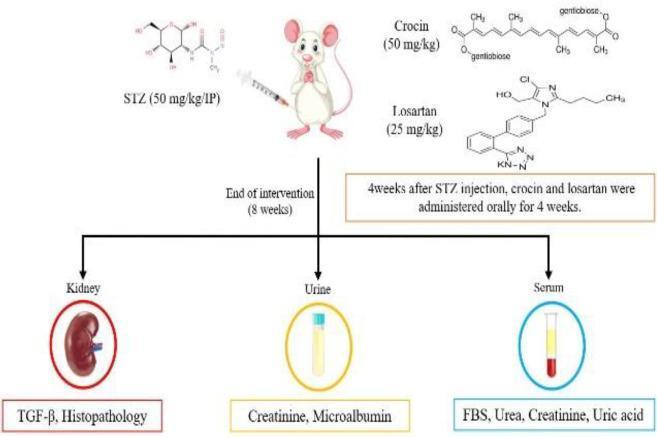
This infographic presents a timeline and methodology for a preclinical pharmacological study investigating diabetic nephropathy and therapeutic interventions. The study protocol begins with an initial intraperitoneal (IP) injection of Streptozotocin (STZ) at 50 mg/kg to induce diabetes in a rodent model. Four weeks post-induction, a dual-intervention phase begins involving oral administration of Crocin (50 mg/kg) and Losartan (25 mg/kg) for an additional four weeks. The chemical structures for all three substances are illustrated. The flowchart concludes at 8 weeks with a breakdown of terminal assessments categorized by biological sample: Kidney analysis includes TGF-β expression and histopathological evaluation; Urine analysis focuses on creatinine and microalbumin levels; and Serum analysis evaluates fasting blood sugar (FBS), urea, creatinine, and uric acid. This visual aid effectively maps the progression from disease induction to therapeutic testing and final diagnostic outcomes related to renal function and metabolic health.
"diabetic ketoacidosis" AND management
Diabetic Ketoacidosis (DKA): Protocol and Management
1. Definition and Diagnostic Triad
| Feature | Threshold |
|---|---|
| Hyperglycemia | Glucose >250 mg/dL (or known diabetes with any glucose) |
| Ketosis | Serum ketones ≥1:2 dilution OR urine ketones 2+; β-hydroxybutyrate ≥3.0 mmol/L |
| Acidosis | Arterial/venous pH <7.3, serum bicarbonate <18 mEq/L |
Note: Patients taking SGLT-2 inhibitors can develop "euglycemic DKA" with glucose <200 mg/dL - don't be fooled by a "normal" glucose.
2. Severity Classification
| Parameter | Mild | Moderate | Severe |
|---|---|---|---|
| Glucose (mg/dL) | >250 | >250 | >250 |
| pH | 7.25-7.30 | 7.00-7.24 | <7.00 |
| HCO₃ (mEq/L) | 15-18 | 10-14 | <10 |
| Anion Gap | >10 | >12 | >12 |
| Mental Status | Alert | Drowsy | Stupor/Coma |
3. Precipitating Causes
- Infection (most frequent trigger)
- Insulin omission or non-adherence
- New-onset type 1 diabetes
- Acute coronary syndrome
- Stroke, pulmonary embolism, acute pancreatitis
- Drugs: corticosteroids, clozapine, olanzapine, cocaine, thiazides, SGLT-2 inhibitors
- Endocrinopathies: Cushing syndrome, thyrotoxicosis, acromegaly
- Alcohol intoxication, severe burns
4. Clinical Features
- Polyuria, polydipsia, nocturia
- Nausea, vomiting, anorexia
- Weakness, lethargy
- Non-specific abdominal pain (can mimic acute abdomen)
- Kussmaul breathing (deep, rapid respirations - respiratory compensation for acidosis)
- Acetone/fruity breath
- Tachycardia, orthostatic hypotension or frank hypotension
- Dry skin and mucous membranes
- Depressed mental status, coma in severe cases
- Elevated temperature suggests co-existing infection (DKA itself rarely causes fever)
5. Initial Workup
| Test | What to Look For |
|---|---|
| Serum glucose | Degree of hyperglycemia |
| Electrolytes (Na, K, Cl, HCO₃) | Anion gap = Na - (Cl + HCO₃); target >12 |
| Venous blood gas | pH (correlates well with arterial; less invasive) |
| BUN, creatinine | Prerenal injury common |
| CBC | WBC typically elevated (even without infection) |
| Urinalysis | Ketonuria, glucosuria |
| β-hydroxybutyrate (bedside) | More reliable than urine ketones (nitroprusside misses β-OHB) |
| ECG | Dysrhythmias from K+ abnormality; rule out ACS as precipitant |
| Blood/urine cultures | If infection suspected |
| Serum phosphate, magnesium | Usually depleted |
- Water: 70-120 mL/kg
- Sodium: 8-10 mEq/kg
- Potassium: 5-7 mEq/kg
- Phosphorus: ~3 mEq/kg
6. Management Protocol
Step 1 - Airway and Stabilization
- Avoid intubation if at all possible - patients have tremendous respiratory drive (Kussmaul breathing) and matching ventilator settings is extremely difficult.
- If intubation is unavoidable (comatose, vomiting), maintain hyperventilation to prevent worsening acidosis.
- If in hypovolemic shock: isotonic crystalloid rapidly before considering vasopressors; bedside ultrasound to exclude other causes (sepsis, MI).
Step 2 - Intravenous Fluid Resuscitation
- Shock present: Isotonic saline (0.9% NaCl) or balanced crystalloid (Plasmalyte) as fast as possible until SBP ≥80 mmHg
- No shock: 1-2 L of 0.9% NaCl over the first 1-3 hours
- After initial resuscitation: switch to 0.45% NaCl at a slower rate to correct free water deficit
- When glucose reaches 250 mg/dL: Add Dextrose 5% (D5W) to the IV fluids - this allows insulin infusion to continue and resolve ketosis without causing hypoglycemia
- Initial bolus: 20 mL/kg isotonic fluid over first hour
- Target urine output: 1-2 mL/kg/h
- Adjust rate for age, cardiac status, and degree of dehydration
Concern: Large volumes of 0.9% NaCl can worsen hyperchloremic metabolic acidosis. Balanced crystalloids (Plasmalyte) may restore physiologic parameters more quickly. Recent meta-analysis (PMID 40913602) examined two-bag vs one-bag fluid methods for DKA management.
Step 3 - Potassium Replacement
| Serum K+ | Action |
|---|---|
| <3.3 mEq/L | Hold insulin; give KCl 20-40 mEq/h IV until K+ ≥3.3 |
| 3.3-5.5 mEq/L | Add 20-40 mEq KCl per liter of IV fluid; monitor every 2 hours |
| >5.5 mEq/L | Do NOT replace potassium yet; check every 2 hours |
Step 4 - Insulin Therapy
- Dose: Regular insulin infusion at 0.1 units/kg/hour IV
- Whether to give a loading bolus (0.1 units/kg IV push) is controversial - many protocols now omit it
- Target glucose drop: 50-100 mg/dL per hour
- If glucose does NOT decline by ≥50 mg/dL/hour: increase infusion rate by 50%
- When glucose reaches 250 mg/dL: reduce insulin infusion and add D5W; do NOT stop insulin (ketosis still ongoing)
- Continue insulin infusion until:
- Anion gap closes
- HCO₃ rises above 14-18 mEq/L (ADA target >18 mEq/L)
- Patient is eating orally
- Give SC long-acting/basal insulin at least 1 hour before stopping the IV infusion to avoid rebound ketosis
- Recent 2026 systematic review/meta-analysis (PMID 41208563) evaluated early subcutaneous basal insulin alongside IV insulin infusion.
Step 5 - Bicarbonate Therapy
- pH <6.9 (profound acidosis)
- Life-threatening hyperkalemia
- Severe hemodynamic compromise refractory to fluids
Step 6 - Phosphate Replacement
- Serum phosphate <1 mg/dL
- Cardiac dysfunction, hemolytic anemia, or respiratory depression due to hypophosphatemia
Step 7 - Treat the Precipitant
- Broad-spectrum antibiotics if infection suspected
- ACS workup if clinically indicated
- Adjust or discontinue offending drugs (steroids, SGLT-2 inhibitors)
7. Monitoring During Treatment
| Parameter | Frequency |
|---|---|
| Capillary glucose | Every 1 hour |
| Electrolytes (Na, K, Cl, HCO₃) | Every 2-4 hours |
| Venous pH / anion gap | Every 2-4 hours |
| Urine output | Hourly |
| β-hydroxybutyrate | Every 2-4 hours if available |
| ECG monitoring | Continuous if K replacement >10 mEq/h |
- Blood glucose <250 mg/dL
- Serum HCO₃ ≥15-18 mEq/L
- Venous pH >7.3
- Anion gap closed
- Patient tolerating oral intake
8. Admission Criteria
- Initial pH ≥7.35
- Initial HCO₃ ≥20 mEq/L
- Tolerating oral fluids
- Symptoms resolved after ED treatment
- No underlying precipitant requiring admission
- Reliable caregiver
9. Complications to Watch For
| Complication | Notes |
|---|---|
| Hypokalemia | Most common; from insulin + IV fluids driving K+ intracellular |
| Hypoglycemia | From excessive insulin without adequate glucose |
| Cerebral edema | More common in children; risk with overly rapid osmolality correction. CT/MRI shows narrowed intercaudate diameter |
| Hyperchloremic acidosis | From large-volume 0.9% NaCl; anion gap closes but pH remains low |
| Aspiration pneumonia | Risk in obtunded patients (gastroparesis + ileus) |
| Venous thromboembolism | Increased risk from dehydration and hypercoagulability |
| Acute kidney injury | Pre-renal; resolves with fluid resuscitation |
10. DKA vs HHS (Quick Comparison)
| Feature | DKA | HHS |
|---|---|---|
| Glucose | >350 mg/dL | >600 mg/dL |
| pH | <7.3 | >7.3 |
| HCO₃ | <10 mEq/L | >15 mEq/L |
| Serum ketones | Present | Absent |
| Sodium | Low 130s mEq/L | 140s mEq/L |
| BUN | 25-50 mg/dL | >50 mg/dL |
| Onset | Hours to days | Days to weeks |
| Mortality | ~4% | ~15-20% |
Key Cerebral Edema Imaging (DKA Complication)
Recent Evidence Updates (2025-2026)
- A 2026 meta-analysis (PMID 41208563) evaluated early subcutaneous basal insulin alongside IV insulin infusion - this approach may streamline the transition off IV insulin.
- A 2026 systematic review (PMID 40913602) compared two-bag versus one-bag IV fluid methods for DKA; two-bag methods may allow easier glucose/electrolyte titration without changing bags.