
regulation of respiration in one paragraph summary.
2. Read up on the hemoglobin oxygen dissociation curve & factors affecting the curve? create a simple summary for this
hemoglobin oxygen dissociation curve factors affecting shift
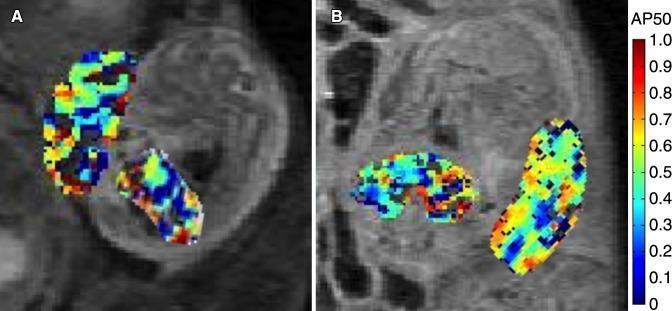
This diagnostic image set displays two functional MR images (A and B) showing maternal-fetal units in a mouse model at embryonic days 14.5 and 17.5. The images feature overlaid color-coded AP50 maps, which represent fetal and placental oxygen-hemoglobin dissociation parameters. In both panels, the placenta and fetal liver are isolated as regions of interest. A vertical color bar on the right side indicates AP50 values scaled from 0 to 1.0, with cool colors (dark blue) representing lower values and warm colors (red/orange) representing higher values. Panel A (day 14.5) demonstrates a heterogeneous distribution of oxygenation parameters within the tissues, showing a mix of green, yellow, and blue pixels. Panel B (day 17.5) illustrates the progression of these physiological markers over time, with the placental AP50 values showing a significant spatial shift toward warmer colors, reflecting changes in oxygen transfer efficiency. These maps provide a non-invasive visual method for studying fetal oxygenation and placental function during gestation.
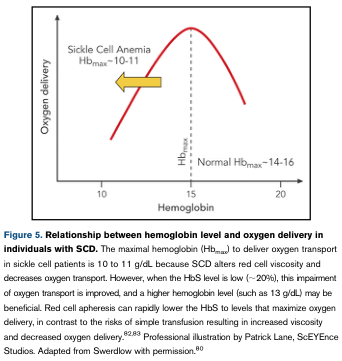
Summary : This figure illustrates the relationship between hemoglobin (Hb) level and oxygen delivery in individuals with sickle cell disease (SCD), highlighting the optimal Hb range for oxygen transport in SCD compared to normal individuals. line plot: # Title & Axes : • No explicit title on the plot, but the context is "Relationship between hemoglobin level and oxygen delivery in individuals with SCD." • X-axis: "Hemoglobin" (units not specified, but contextually g/dL). • Y-axis: "Oxygen delivery" (units not specified). • X-axis tick labels: 10, 15, 20. • Y-axis: No tick labels, only qualitative trend. # Data Points & Series : • Single red curve showing oxygen delivery as a function of hemoglobin level. • The curve rises from Hb = 10, peaks near Hb = 14–16, then declines toward Hb = 20. • Arrow and annotation for "Sickle Cell Anemia Hb_max ~10–11" indicating the optimal Hb range for SCD. • Dashed vertical line at "Normal Hb_max ~14–16" indicating the optimal Hb range for normal individuals. # Design Encodings : • Red solid line for the main curve. • Yellow arrow highlighting the SCD optimal Hb range. • Dashed vertical line for normal Hb_max. • Text annotations for "Sickle Cell Anemia Hb_max ~10–11" and "Normal Hb_max ~14–16". # Distribution & Trends : • The curve is unimodal, peaking at intermediate Hb levels. • Oxygen delivery increases with Hb up to a point, then decreases at higher Hb levels. • The optimal Hb for SCD is lower (~10–11 g/dL) than for normal individuals (~14–16 g/dL). # Analysis : • The figure visually demonstrates that the maximal oxygen delivery in SCD occurs at a lower hemoglobin level than in normal individuals, due to altered red cell viscosity and oxygen transport in SCD. • Increasing Hb above the SCD optimal range may decrease oxygen delivery, while lowering Hb to the optimal range can improve oxygen transport. • The curve supports clinical recommendations for transfusion targets in SCD patients to avoid excessive Hb levels that could impair oxygen delivery.
This composite diagnostic image displays Multispectral Optoacoustic Tomography (MSOT) scans of a lung xenograft tumor model in a mouse. The panel compares a control group (top row) with a CA4P-treated group (bottom row) at four time points: 0h, 1h, 3h, and 24h. The pseudocolor overlay represents hemoglobin oxygen saturation (%SO2) on a scale from 0% (dark blue/black) to 80% (bright red). Red indicates high oxyhemoglobin levels, while blue represents deoxyhemoglobin or blood-deficient areas. In the control group, the tumor exhibits persistent heterogeneous oxygenation (mixed red and blue) throughout the 24-hour period. In the CA4P group, the tumor undergoes a dramatic shift from high baseline oxygenation at 0h to a predominantly blue signal at 1h, 3h, and 24h. This visual transition demonstrates the pharmacodynamic effect of Combretastatin A-4 phosphate (CA4P) as a vascular disrupting agent (VDA), illustrating immediate and sustained vascular shutdown, resulting in acute tumor hypoxia and reduced perfusion. Scale bars represent 5 mm.
Hemoglobin-Oxygen Dissociation Curve
What Is It?
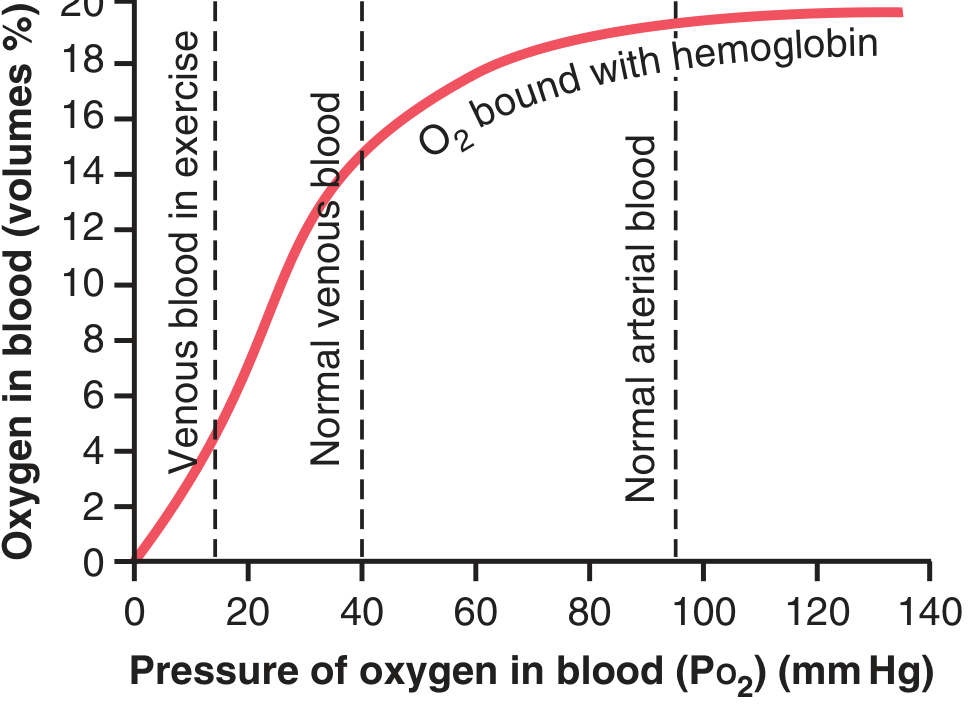
Key Reference Points
| Location | PO2 | Hb Saturation | O2 Content |
|---|---|---|---|
| Normal arterial blood (lungs) | ~95 mmHg | 97% | ~19.4 mL/100 mL |
| Normal venous blood (tissues) | ~40 mmHg | 75% | ~14.4 mL/100 mL |
| Venous blood in heavy exercise | ~15 mmHg | ~35% | ~4.4 mL/100 mL |
- Under resting conditions, ~5 mL O2 is delivered to tissues per 100 mL blood
- During strenuous exercise, this rises to ~15 mL O2 per 100 mL blood (3x normal)
The P50
Factors Affecting the Curve
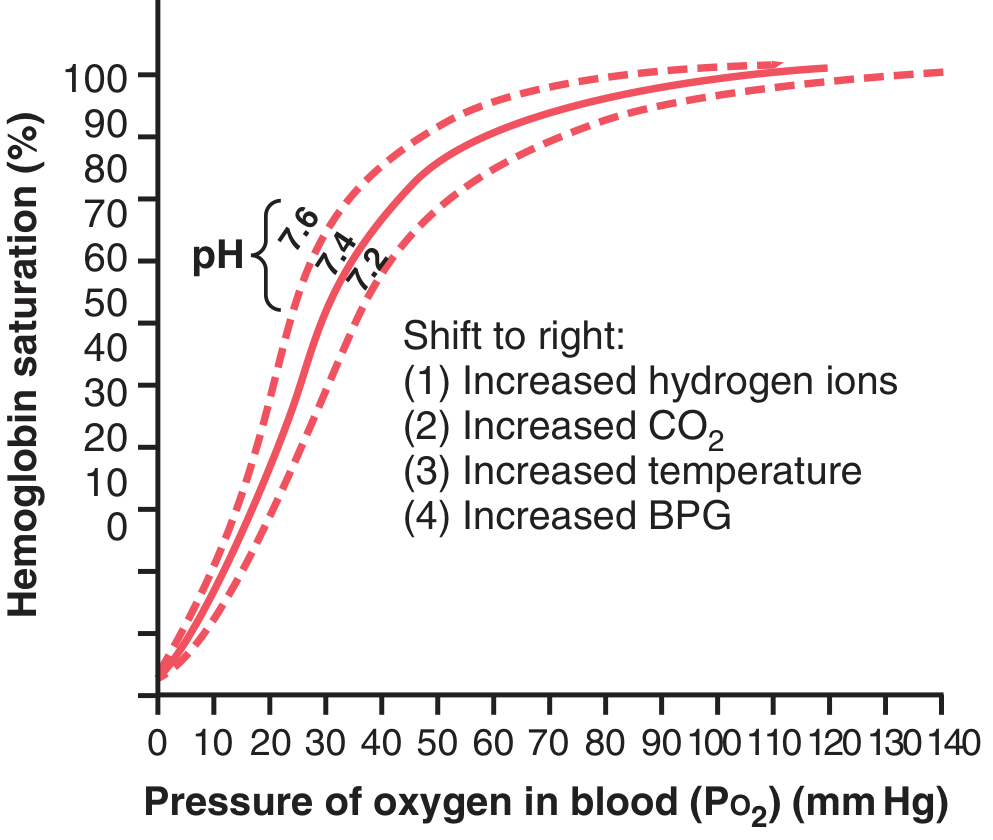
RIGHT SHIFT = Hb releases O2 more readily (good for tissues)
| Factor | Physiological Context |
|---|---|
| ↑ H⁺ (↓ pH) | Acidosis, exercising muscle |
| ↑ CO2 (Bohr effect) | Tissues produce CO2 |
| ↑ Temperature | Active/exercising muscle |
| ↑ 2,3-BPG | Chronic hypoxia, anemia, high altitude |
LEFT SHIFT = Hb holds O2 more tightly (good for lungs, bad for tissues)
| Factor | Physiological Context |
|---|---|
| ↓ H⁺ (↑ pH) | Alkalosis |
| ↓ CO2 | Hyperventilation, lungs |
| ↓ Temperature | Hypothermia |
| ↓ 2,3-BPG | Stored blood, rare enzyme deficiencies |
| Fetal Hb (HbF) | Has higher O2 affinity to steal O2 from mother |
| Carbon monoxide (CO) | CO binds Hb ~250x stronger than O2; left-shifts remaining sites |
Simple Memory Rule
"CADET, face RIGHT" - CO2 ↑, Acid ↑, DPG (2,3-BPG) ↑, Exercise, Temperature ↑ → Right shift
pemonia in detailed summary
pneumonia chest x-ray consolidation lobar
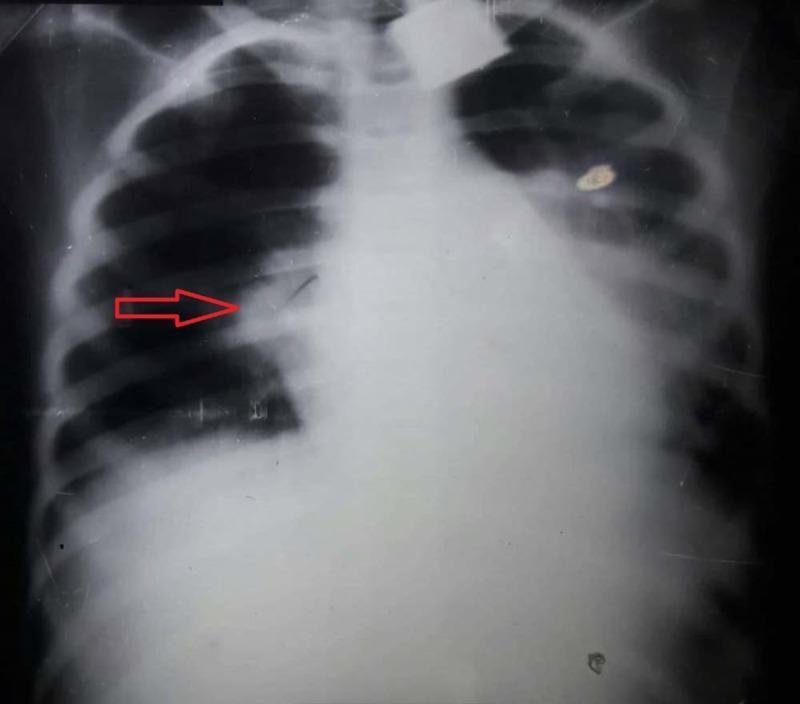
This diagnostic image is an anteroposterior (AP) chest X-ray of a pediatric patient demonstrating classic findings of lobar pneumonia. A prominent, dense, and homogenous opacification is localized to the right upper lobe, consistent with pulmonary consolidation. The opacification has a well-defined inferior border along the horizontal fissure, indicated by a red arrow, which is a hallmark of lobar involvement. Normal lung markings in this region are obscured, while the left lung field appears relatively clear and well-aerated. The cardiac silhouette and mediastinal structures appear within normal limits for this projection, with no significant shift or widening. The diaphragm and costophrenic angles are visible, though the right side is partially obscured by the adjacent consolidation. This image serves as an educational example of bacterial pneumonia presentation in a clinical setting, highlighting the radiographic appearance of alveolar space filling.

Multi-modal diagnostic imaging series illustrating community-acquired lobar pneumonia in a 30-year-old patient. (a) Posterior-anterior chest X-ray shows a clear area of consolidation in the left upper lobe. (b) B-mode lung ultrasound (LUS) reveals a complex, hypoechoic consolidation containing numerous hyperechoic punctate and linear structures, characteristic of a marked air bronchogram. (c-e) Contrast-enhanced ultrasound (CEUS) time-series demonstrates perfusion dynamics: (c) at 13 seconds, there is homogeneous pulmonary arterial enhancement; (d) by 1 minute, significant early washout occurs; (e) by 2 minutes, the washout is more pronounced. This specific CEUS pattern of rapid washout is indicative of pulmonary arterial vasoconstriction, often associated with the Euler–Liljestrand mechanism in response to local hypoxia in consolidated lung tissue. The series serves as an educational example of how multi-phase CEUS can supplement B-mode ultrasound and radiography in characterizing the hemodynamic response of pulmonary parenchyma during inflammatory processes.
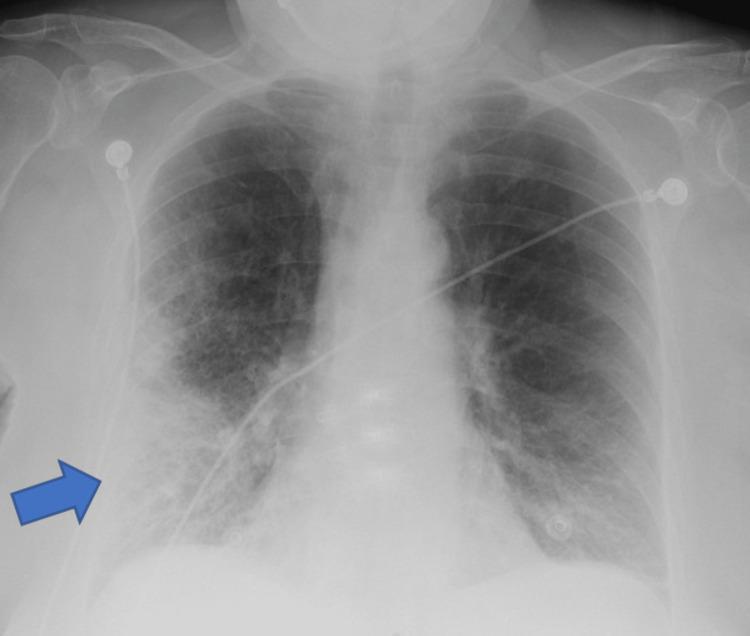
A frontal (anteroposterior) chest X-ray demonstrating clinical signs of pneumonia. A prominent blue arrow indicates a large area of increased opacity in the right lower lung field, suggestive of lobar consolidation or a dense pulmonary infiltrate. The opacity is heterogeneous with ill-defined borders, blending into the surrounding parenchyma. Beyond the focal area, there are diffuse bilateral reticulonodular interstitial markings, more pronounced in the mid and lower lung zones. The right costophrenic angle is relatively sharp, while the left shows mild blunting. Several medical devices are present: multiple radiopaque ECG leads/electrodes are positioned on the upper chest and shoulders, and a radiopaque enteric tube (nasogastric or feeding tube) is visible traversing the mediastinum toward the stomach. The image illustrates typical radiological findings of an infectious process in an acute clinical setting, highlighting focal consolidation against a background of generalized pulmonary congestion or inflammation.
Pneumonia - Detailed Summary
Definition
Classification
| Type | Definition | Key Pathogens |
|---|---|---|
| CAP (Community-Acquired) | Present before or within 48h of admission | S. pneumoniae, Mycoplasma, Chlamydia, Legionella, H. influenzae, respiratory viruses |
| HAP (Hospital-Acquired) | Develops ≥2 days after hospital admission | S. aureus (incl. MRSA), Pseudomonas, gram-negative enteric bacilli, Acinetobacter |
| VAP (Ventilator-Associated) | Occurs ≥3 days after mechanical ventilation onset | Same as HAP; Pseudomonas, MRSA, Acinetobacter (resistant strains common) |
| Aspiration | Caused by inhalation of oropharyngeal/gastric contents | Anaerobes (Peptostreptococcus, Bacteroides), gram-negatives |
| Opportunistic | In immunocompromised hosts | PCP (Pneumocystis jirovecii), Cryptococcus, Aspergillus, atypical mycobacteria |
Common Pathogens by Clinical Pattern
- Streptococcus pneumoniae - most common bacterial CAP
- Staphylococcus aureus - aggressive, post-viral or skin infection
- Klebsiella pneumoniae - alcoholics, upper lobe "currant jelly" sputum
- H. influenzae - COPD patients, elderly
- Mycoplasma pneumoniae - young adults ("walking pneumonia")
- Chlamydia pneumoniae - similar to Mycoplasma
- Legionella pneumophila - contaminated water/AC systems, GI symptoms, hyponatremia
- Respiratory viruses (influenza, RSV, SARS-CoV-2, parainfluenza)
Clinical Presentation
| Feature | Typical (Bacterial) | Atypical |
|---|---|---|
| Onset | Abrupt | Gradual |
| Fever | High-grade, rigors | Low-grade |
| Cough | Productive, purulent | Dry, nonproductive |
| Appearance | Acutely ill, toxic | Less toxic ("walks in") |
| WBC | >15,000, neutrophil predominance | Normal or mildly elevated |
- Cough (productive or dry), fever, dyspnea, pleuritic chest pain, malaise
- Tachypnea, tachycardia
- Decreased breath sounds over affected area
- Dullness to percussion
- Egophony ("E to A" change)
- Bronchial breathing, crackles
In children: Tachypnea disproportionate to fever is often the earliest clue. Viral pneumonia = less toxic, wheezing. Bacterial = high fever, chills, dyspnea, intercostal retractions.
Diagnosis
Chest X-Ray
- Bacterial (lobar): Dense homogeneous lobar consolidation, air bronchograms
- Viral/Atypical: Patchy or streaky bilateral interstitial infiltrates, hyperinflation
- Note: CXR findings can lag behind clinical presentation by 1-2 days and may be normal on day 1
- Complications visible on CXR: parapneumonic effusion, empyema, abscess, pneumatocele
Laboratory Tests
| Test | Use |
|---|---|
| CBC | Leukocytosis with neutrophilia (bacterial); normal/mild elevation (atypical/viral) |
| Sputum Gram stain + culture | Low yield but identifies dominant organism |
| Blood cultures | 2 sets before antibiotics in severe/hospitalized cases |
| Urinary antigen | Legionella (sensitive and specific); S. pneumoniae |
| Cold agglutinins | Mycoplasma (positive in ~50%) |
| AFB smear/culture | Suspected TB |
| Procalcitonin | Helps distinguish bacterial from viral; guides antibiotic de-escalation |
| ABG / pulse oximetry | Assess oxygenation severity |
| BAL/bronchoscopy | Reserved for immunocompromised, VAP, or diagnostic uncertainty |
Severity Assessment
CURB-65 Score (1 point each)
| Criterion | Threshold |
|---|---|
| Confusion | New disorientation to person/place/time |
| Uremia | BUN >20 mg/dL |
| Respiratory rate | ≥30 breaths/min |
| Blood pressure | Systolic <90 or diastolic ≤60 mmHg |
| Age | ≥65 years |
- Score 0-1: Low risk - outpatient treatment
- Score 2: Intermediate - consider short admission or close follow-up
- Score ≥3: High risk - hospitalize; score ≥4 or 5 consider ICU
ICU Admission Criteria (IDSA/ATS)
- RR ≥30, PaO2/FiO2 ≤250, multilobar infiltrates, confusion, BUN ≥20, WBC <4000, platelets <100,000, temp <36°C, hypotension requiring aggressive fluids
Treatment
CAP - Outpatient
| Patient | Antibiotic |
|---|---|
| Previously healthy, no recent antibiotics | Azithromycin or Clarithromycin (macrolide) OR Doxycycline |
| Comorbidities (DM, heart/lung/liver/renal disease, alcoholism, cancer, immunosuppression) OR antibiotic use in last 3 months | Respiratory fluoroquinolone (moxifloxacin, levofloxacin) OR Beta-lactam + macrolide combo |
CAP - Hospitalized (Non-ICU)
- Beta-lactam (ampicillin-sulbactam, ceftriaxone) + macrolide OR
- Respiratory fluoroquinolone alone
CAP - ICU / Severe
- Beta-lactam (ceftriaxone or cefotaxime) + azithromycin or fluoroquinolone
- If Pseudomonas risk: antipseudomonal beta-lactam (piperacillin-tazobactam)
- If MRSA risk: add vancomycin or linezolid
HAP / VAP
- Empiric: antipseudomonal beta-lactam (piperacillin-tazobactam, cefepime, meropenem) ± vancomycin/linezolid (if MRSA risk)
- De-escalate based on culture results
- Treatment duration: typically 7 days for VAP (may vary by organism)
Duration
- Minimum 5 days for CAP; at least 48-72 hours after last fever/clinical instability
- Reassess at 72 hours - if no improvement, broaden coverage or reconsider diagnosis
Complications
- Parapneumonic effusion / Empyema - requires drainage if loculated
- Lung abscess - prolonged antibiotics (anaerobes, S. aureus); CT-guided or surgical drainage
- Bacteremia / Sepsis - especially with S. pneumoniae
- Respiratory failure / ARDS - ICU-level support, mechanical ventilation
- Pneumatocele - air-filled cysts, especially in S. aureus pneumonia in children
Prevention
- Influenza vaccine: Annually for everyone >6 months; especially those >50, chronic lung disease, diabetes, immunosuppression
- Pneumococcal vaccine (PCV13/PPSV23): All children <5 years; all adults ≥65; younger adults with chronic conditions or asplenia. Revaccinate with PPSV23 after 10 years if first dose given before age 65
- Smoking cessation, good oral hygiene, and head-of-bed elevation (for VAP prevention)
one paragraph summaryy
pulmonary embolism
pulmonary embolism CT angiography saddle embolus
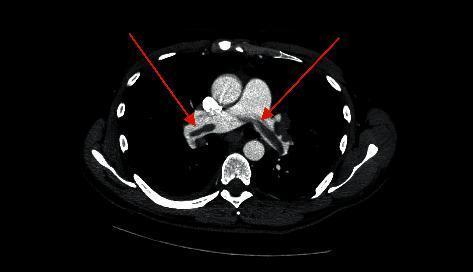
This diagnostic axial CT angiography (CTA) scan of the chest reveals a classic saddle pulmonary embolism. The primary visual finding is a large, low-attenuation filling defect centrally located at the bifurcation of the main pulmonary artery. This thrombus straddles the carina and extends into both the right and left pulmonary arteries. Two red arrows indicate the specific sites where the hypodense embolus obstructs the contrast-enhanced pulmonary vasculature. The surrounding mediastinal structures, including the ascending aorta and the superior vena cava, are visible and show normal contrast enhancement. This imaging modality is the gold standard for diagnosing acute pulmonary embolism, and the 'saddle' configuration demonstrated here indicates a massive or submassive embolic event with high clinical significance for hemodynamic instability.
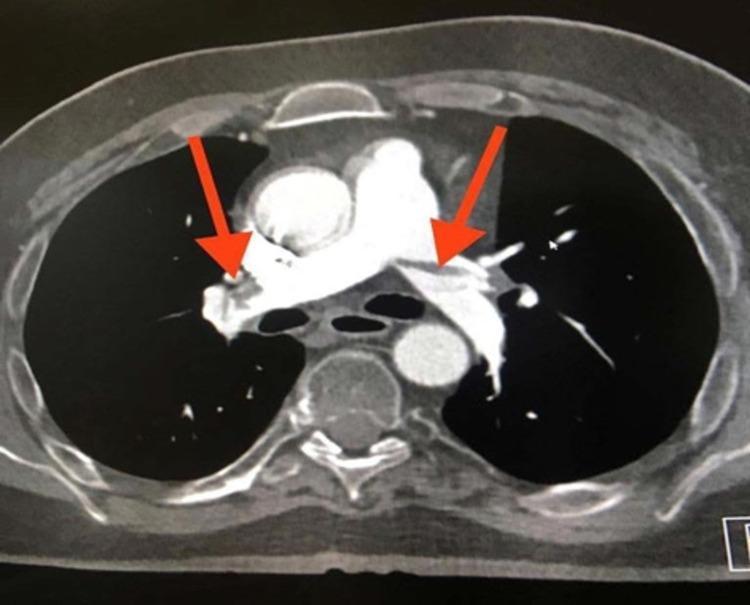
This diagnostic image is an axial cut from a CT Pulmonary Angiography (CTPA) demonstrating extensive pulmonary embolism. The primary visual finding is a large, low-attenuation filling defect appearing as a 'saddle embolus' at the bifurcation of the main pulmonary artery, extending into both the right and left main pulmonary arteries (indicated by red arrows). The central filling defects are characterized by absent or significantly reduced contrast enhancement within the vessel lumens, which are otherwise surrounded by hyperdense contrast material. Additional thromboembolic material is visible in the lobar and segmental branches bilaterally. The main pulmonary artery shows evidence of distension secondary to the large obstructive clot burden. This image serves as a classic clinical example of acute, high-burden pulmonary embolism in a patient with risk factors such as prolonged immobility, illustrating the critical role of CTPA in diagnosing life-threatening vascular obstructions.

**Imaging Modality:** Contrast-enhanced Computed Tomography (CT) of the chest, specifically a CT Pulmonary Angiography (CTPA) protocol. **Anatomical Region:** Axial section of the thorax at the level of the pulmonary artery bifurcation. **Observed Pathology:** Large, bilateral pulmonary embolism. A prominent "saddle" embolus is visible, characterized by low-attenuation (hypodense) filling defects within the lumen of the main pulmonary artery, extending into both the right and left main pulmonary arteries. **Characteristic Visual Features:** * **Filling Defects:** Central non-opacified areas surrounded by radiopaque contrast media, creating the classic "Polo Mint" sign in cross-section or "railway track" sign in longitudinal views. * **Vascular Anatomy:** The pulmonary trunk appears dilated. * **Surrounding Structures:** The ascending and descending aorta, superior vena cava, and vertebral body are visible and unremarkable in this single slice. Metal streak artifacts are present anteriorly from sternal wires, suggesting prior cardiac surgery. **Key Diagnostic Features:** The presence of a large, centrally located thrombus straddling the bifurcation of the pulmonary trunk (saddle embolus) is the pathognomonic finding for acute major pulmonary embolism.
Pulmonary Embolism (PE) - Detailed Summary
Definition & Pathophysiology
- V/Q mismatch (dead space ventilation) → hypoxemia
- Pulmonary hypertension → acute right ventricular (RV) strain and failure
- Decreased LV filling (septal shift) → reduced cardiac output → shock
- Approximately 25% of sudden cardiac deaths are attributable to PE
Risk Factors (Virchow's Triad)
| Category | Examples |
|---|---|
| Hypercoagulability | Cancer, pregnancy, oral contraceptives/estrogen, antiphospholipid syndrome, Factor V Leiden, Protein C/S deficiency, antithrombin III deficiency, prothrombin G20210A |
| Stasis | Prolonged immobilization, long-haul air travel, hospitalization, heart failure, stroke |
| Vascular injury | Major surgery (especially hip/pelvic), trauma, burns |
| Other | Prior DVT/PE (highest risk), obesity, smoking, age >35 |
Classification by Haemodynamic Severity
| Type | Definition | Mortality |
|---|---|---|
| Massive PE | Sustained hypotension (SBP <90 mmHg), shock, cardiac arrest | Very high (>50%) |
| Submassive PE | Normotensive but with RV dysfunction on echo/CT or elevated troponin/BNP | Intermediate (~3-15%) |
| Low-risk PE | Normotensive, normal RV function, normal biomarkers | Low (<1%) |
Clinical Presentation
- Dyspnea - most common (75-80%), may be sudden or gradual, at rest or exertional
- Pleuritic chest pain - sharp, worse on inspiration; indicates peripheral PE with pulmonary infarction (~20%)
- Hemoptysis - suggests pulmonary infarction
- Syncope - uncommon (<5%) but important; indicates massive PE with haemodynamic compromise
- Unilateral leg swelling/tenderness - suggests underlying DVT (<30%)
Note: ~25% of patients have no dyspnea; ~33% have no chest pain. PE is a great mimicker.
- Tachycardia - most common abnormality (~50%); alone the single strongest predictor of more severe PE
- Tachypnoea - >20 breaths/min in ~50%
- Hypotension (SBP <90) - only 10% but carries 4-fold increase in mortality
- Hypoxemia (SpO2 <95%) - present in ~50%; normal SpO2 does NOT rule out PE
- Shock index (HR > SBP) suggests impending haemodynamic collapse
- Often normal
- Unilateral leg swelling/edema/deep vein tenderness → DVT evidence (most specific finding for PE)
- Loud P2, RV heave, elevated JVP (in massive PE with RV failure)
- Localized rales over infarcted lung
Diagnosis
Step 1 - Estimate Pretest Probability
| Criterion | Points |
|---|---|
| Clinical signs/symptoms of DVT | 3 |
| PE more likely than alternative diagnosis | 3 |
| Heart rate >100 bpm | 1.5 |
| Immobilization/surgery in past 4 weeks | 1.5 |
| Prior DVT or PE | 1.5 |
| Hemoptysis | 1 |
| Malignancy (on treatment or within 6 months) | 1 |
- Score ≤4: Low/intermediate probability → D-dimer first
- Score >4: High probability → proceed directly to CTPA
Step 2 - D-Dimer
- Quantitative ELISA D-dimer <500 μg/L in low/intermediate pretest probability → rules out PE (high sensitivity ~97%)
- D-dimer is not useful in high-probability patients or as a confirmatory test (low specificity - elevated in many conditions: surgery, infection, pregnancy, cancer)
Step 3 - Imaging
- Shows filling defects in pulmonary arteries
- "Saddle embolus" at the main pulmonary artery bifurcation = massive PE
| Test | Finding in PE |
|---|---|
| ECG | Tachycardia (most common); S1Q3T3 pattern; T-wave inversion V1-V4; RBBB (all indicate acute cor pulmonale) |
| CXR | Often normal; Hampton's hump (peripheral wedge-shaped infarct); Westermark sign (oligaemia distal to embolus); elevated hemidiaphragm |
| Troponin | Elevated → myocardial injury from RV strain → higher mortality |
| BNP/NT-proBNP | Elevated → RV myocyte distension → worse prognosis |
| ABG | Hypoxemia, hypocapnia (tachypnoea-driven), elevated A-a gradient |
| Echo | RV dilation, hypokinesis, McConnell's sign (apical sparing) - used in haemodynamic instability |
| Leg Doppler US | Confirms DVT source |
Treatment
By Severity
- Immediate systemic thrombolysis - alteplase 100 mg IV over 2 hours (survival benefit proven in haemodynamically unstable patients)
- If thrombolysis contraindicated → surgical embolectomy or catheter-directed thrombolysis
- Supportive: vasopressors (norepinephrine), mechanical ventilation if needed
- Anticoagulate with IV unfractionated heparin (UFH) after thrombolytics
- Anticoagulation with LMWH (enoxaparin) or UFH - LMWH preferred (at least as effective, fewer bleeding complications, subcutaneous)
- Consider thrombolysis if deteriorating despite anticoagulation
- Close monitoring for haemodynamic decompensation
- Anticoagulation alone - LMWH or direct oral anticoagulants (DOACs: rivaroxaban, apixaban)
- Consider outpatient treatment for selected low-risk patients (HESTIA criteria / PESI score)
Long-Term Anticoagulation
| Scenario | Duration |
|---|---|
| First episode, provoked (reversible risk factor) | 3 months |
| First episode, unprovoked | 3-6 months (consider indefinite) |
| Cancer-associated VTE | Indefinitely (while cancer active) |
| Recurrent PE or hypercoagulability | Lifetime |
| Drug options | Warfarin (INR 2-3), Rivaroxaban, Apixaban, Dabigatran, Edoxaban |
Prevention
- Mechanical: Early mobilisation, compression stockings, intermittent pneumatic compression
- Pharmacological: Low-dose subcutaneous heparin (UFH 5000U BD/TDS) or LMWH for hospitalised patients, post-surgical patients, and those on prolonged bedrest
- Key principle: Prophylaxis should be included in all standard hospital admission orders unless specifically contraindicated - starting early is essential as it is ineffective once a clot begins to form
Complications
- Chronic thromboembolic pulmonary hypertension (CTEPH) - incomplete clot resolution → progressive pulmonary hypertension (treated with surgical pulmonary endarterectomy)
- Post-PE syndrome - dyspnoea and functional limitation persisting after acute PE
- Recurrent VTE - especially in unprovoked PE without long-term anticoagulation
- Right heart failure - from untreated or massive PE
make into one short paragraph summary
make short and simple summary for pulmonary embolism
create detailed notes on this topic.