
Give neuroanatomy flow chart
Which neuroanatomy topic do you want a flowchart for?
overview of the nervous system organization diagram flowchart
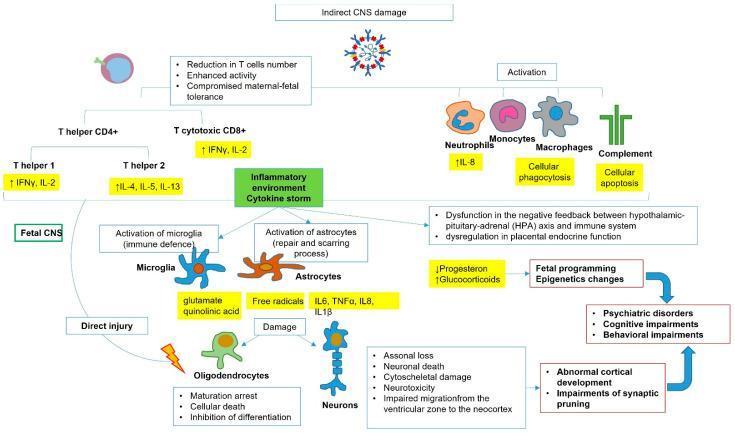
This medical pathophysiology diagram illustrates the indirect central nervous system (CNS) damage mechanisms associated with SARS-CoV-2 infection, specifically focusing on maternal-fetal immune interactions and fetal neurodevelopment. The flowchart begins with the virus triggering a reduction in T cell numbers and a loss of maternal-fetal tolerance. It details the activation of T helper (CD4+) subsets (Th1, Th2), T cytotoxic (CD8+) cells, neutrophils (releasing IL-8), monocytes, macrophages, and the complement system. These immune responses converge on a central 'Inflammatory environment / Cytokine storm.' Within the fetal CNS, this environment triggers microglial activation (releasing glutamate and quinolinic acid) and astrocyte activation (releasing free radicals and cytokines like IL-6, TNF̑, and IL-1̒). These mediators lead to direct injury of oligodendrocytes (maturation arrest, death) and neurons (axonal loss, impaired migration). Simultaneously, HPA axis dysfunction and endocrine dysregulation (low progesterone, high glucocorticoids) lead to fetal programming and epigenetic changes. The culmination of these pathways results in abnormal cortical development, impaired synaptic pruning, and long-term psychiatric, cognitive, and behavioral impairments.
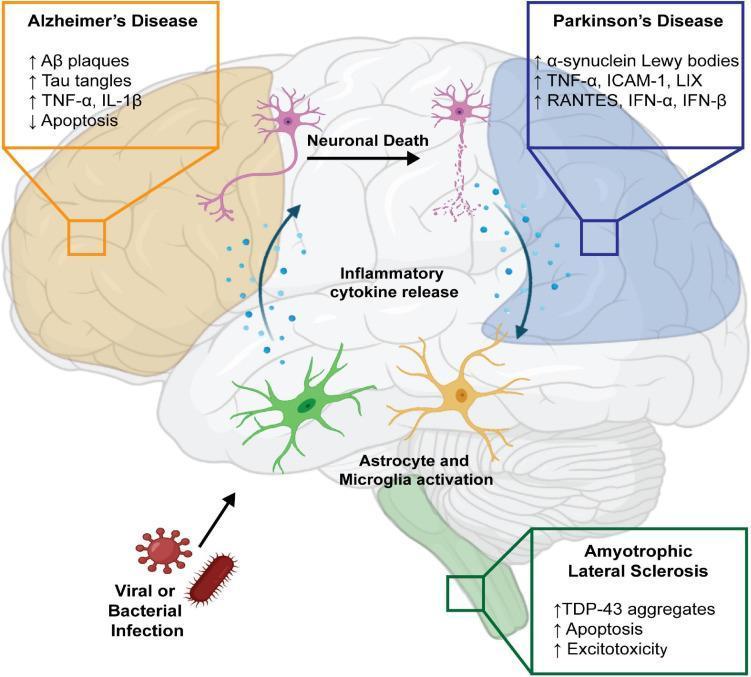
A pathophysiology diagram illustrating the relationship between infectious agents and neurodegenerative diseases within the central nervous system. The illustration depicts a sagittal view of the human brain with three highlighted regions corresponding to Alzheimer's Disease (orange), Parkinson's Disease (blue), and Amyotrophic Lateral Sclerosis (ALS, green). The flowchart begins with 'Viral or Bacterial Infection' entering the CNS, triggering 'Astrocyte and Microglia activation.' This lead to 'Inflammatory cytokine release' and ultimately 'Neuronal Death.' Detailed call-out boxes list molecular hallmarks for each condition: Alzheimer's shows increased Aβ plaques, Tau tangles, and TNF-α/IL-1β; Parkinson's shows increased α-synuclein Lewy bodies and various cytokines (TNF-α, RANTES, IFN); ALS shows increased TDP-43 aggregates, apoptosis, and excitotoxicity. The diagram emphasizes the role of neuroinflammation and glial cell immune responses in the progression of proteinopathies and neuronal loss across different neurological disorders.
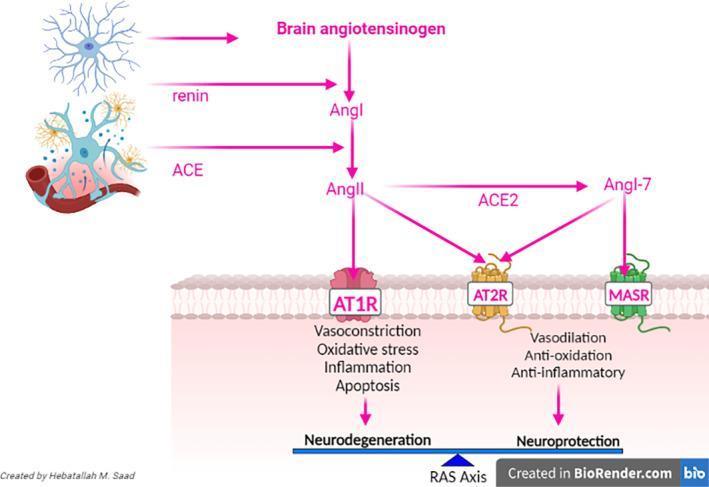
A pathophysiology diagram illustrating the brain renin-angiotensin system (RAS) and its dual pathways leading to neurodegeneration or neuroprotection. The flowchart starts with brain angiotensinogen, converted to Angiotensin I (Ang I) by renin, and subsequently to Angiotensin II (Ang II) by Angiotensin-Converting Enzyme (ACE). The diagram depicts two opposing arms of the RAS axis. The 'harmful' arm involves Ang II binding to the AT1 Receptor (AT1R), which triggers vasoconstriction, oxidative stress, inflammation, and apoptosis, ultimately leading to neurodegeneration. Conversely, the 'protective' arm involves the conversion of Ang II to Ang 1-7 by ACE2, which acts on the MAS Receptor (MASR). This, along with Ang II signaling through the AT2 Receptor (AT2R), promotes vasodilation, anti-oxidation, and anti-inflammatory effects, resulting in neuroprotection. The balance between these outcomes is visually represented by a scale labeled 'RAS Axis' at the bottom. Anatomical illustrations of neurons and neurovascular structures are included to provide central nervous system context.
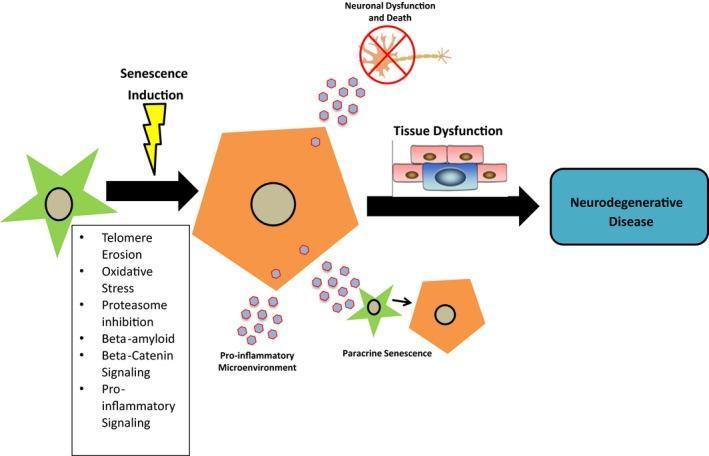
This pathophysiology diagram illustrates the process of 'astrosenescence' and its contribution to neurodegenerative disease within the central nervous system (CNS). The flowchart begins with a healthy, star-shaped astrocyte encountering 'Senescence Induction' triggers, including telomere erosion, oxidative stress, proteasome inhibition, beta-amyloid, and pro-inflammatory signaling. Post-induction, the astrocyte transforms into a larger, pentagonal senescent cell. This senescent astrocyte establishes a 'Pro-inflammatory Microenvironment' by secreting factors (depicted as purple hexagons) characteristic of a Senescence-Associated Secretory Phenotype (SASP). The diagram highlights three primary downstream effects: 1) 'Neuronal Dysfunction and Death,' represented by a neuron with a red strike-through; 2) 'Paracrine Senescence,' where secreted factors induce senescence in neighboring healthy astrocytes; and 3) general 'Tissue Dysfunction' involving altered cellular morphology. The terminal outcome of these integrated pathways is categorized as 'Neurodegenerative Disease.' This visual serves as an educational summary of how cellular aging in glia disrupts homeostasis and promotes chronic pathology in the brain.
A clean, detailed neuroanatomy overview flowchart showing the complete organization of the nervous system. The top node is "Nervous System" which branches into two main divisions: "Central Nervous System (CNS)" and "Peripheral Nervous System (PNS)". Under CNS: "Brain" (which further branches into Cerebrum/Cerebral Hemispheres → Frontal, Parietal, Temporal, Occipital Lobes; Diencephalon → Thalamus, Hypothalamus, Epithalamus; Brainstem → Midbrain, Pons, Medulla Oblongata; Cerebellum; Limbic System → Hippocampus, Amygdala) and "Spinal Cord" (branches into Cervical, Thoracic, Lumbar, Sacral, Coccygeal). Under PNS: "Somatic Nervous System" (Afferent/Sensory nerves, Efferent/Motor nerves → Voluntary muscles) and "Autonomic Nervous System" (Sympathetic → Fight or Flight; Parasympathetic → Rest and Digest; Enteric → Gut). The ANS further shows: Sympathetic uses norepinephrine, Parasympathetic uses acetylcholine. Supporting structures section shows: Meninges (Dura Mater, Arachnoid, Pia Mater), Neuroglia (Astrocytes, Oligodendrocytes, Microglia, Schwann Cells). Neat hierarchical layout with color coding: blue for CNS, green for PNS, orange for ANS subdivisions. Medical education style diagram on white background with clear connecting lines and labels.
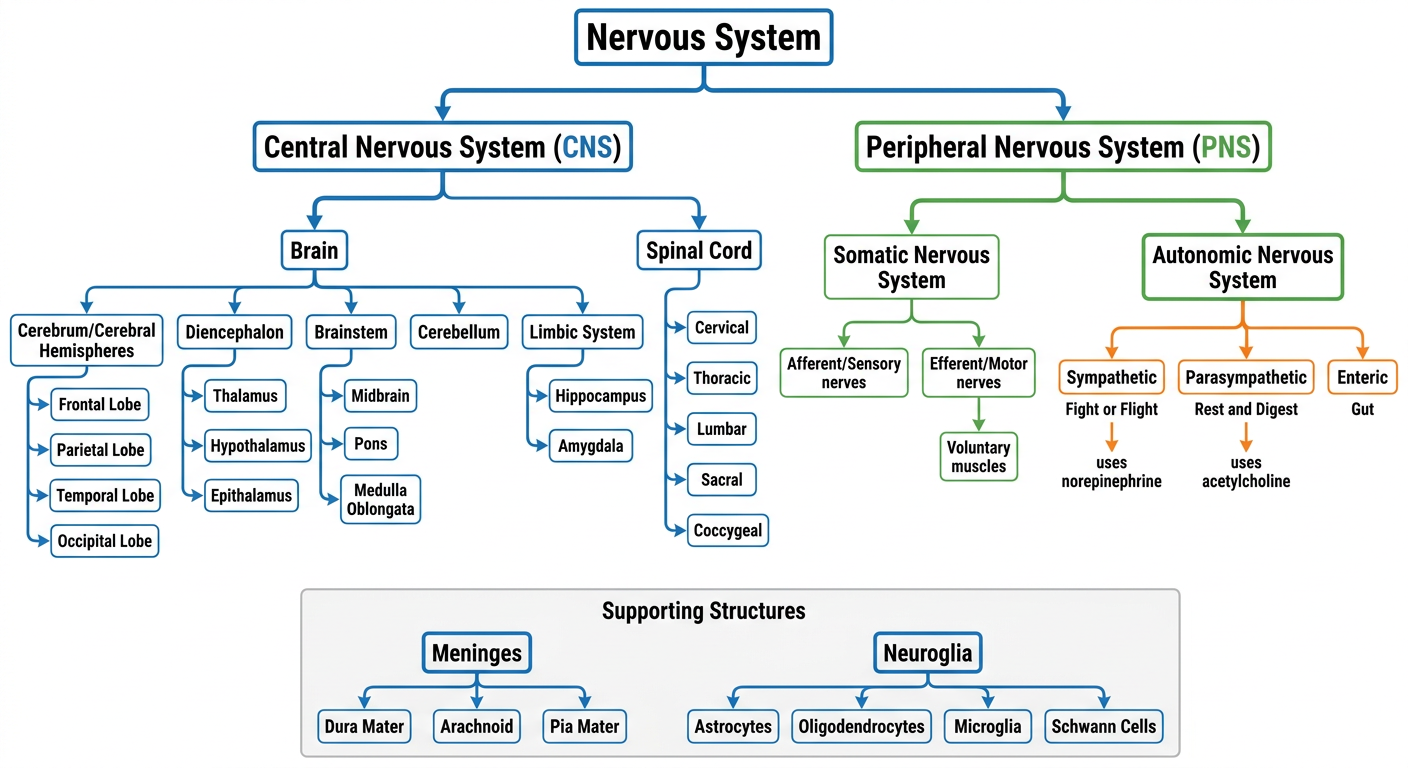
Neuroanatomy: Overview of the Nervous System
NERVOUS SYSTEM
1. CENTRAL NERVOUS SYSTEM (CNS)
Brain + Spinal Cord, covered by meninges (Dura mater → Arachnoid → Pia mater)
A. BRAIN
| Structure | Components | Key Functions |
|---|---|---|
| Cerebrum | Frontal, Parietal, Temporal, Occipital lobes | Voluntary movement, sensation, cognition, language |
| Diencephalon | Thalamus, Hypothalamus, Epithalamus | Sensory relay, homeostasis, sleep-wake cycles |
| Brainstem | Midbrain, Pons, Medulla oblongata | Cranial nerve nuclei, vital reflexes (breathing, BP) |
| Cerebellum | Vermis, Hemispheres | Coordination, balance, fine motor control |
| Limbic System | Hippocampus, Amygdala, Cingulate gyrus | Memory, emotion, behavior |
B. SPINAL CORD
- Segments: Cervical (C1-C8) → Thoracic (T1-T12) → Lumbar (L1-L5) → Sacral (S1-S5) → Coccygeal
- Gray matter (H-shaped): Dorsal horn (sensory), Ventral horn (motor), Lateral horn (autonomic, T1-L2)
- White matter: Ascending tracts (sensory) + Descending tracts (motor)
2. PERIPHERAL NERVOUS SYSTEM (PNS)
All neural tissue outside the CNS (spinal nerves, cranial nerves, ganglia)
A. SOMATIC NERVOUS SYSTEM
- Afferent (sensory) - carries signals from periphery → CNS
- Efferent (motor) - carries signals from CNS → skeletal muscle (voluntary)
B. AUTONOMIC NERVOUS SYSTEM (ANS)
Controls visceral/involuntary functions
| Division | Neurotransmitter | Effect | Origin |
|---|---|---|---|
| Sympathetic | Norepinephrine (post) | "Fight or Flight" | T1-L2 (thoracolumbar) |
| Parasympathetic | Acetylcholine (both) | "Rest and Digest" | CN III, VII, IX, X + S2-S4 (craniosacral) |
| Enteric | Multiple | Controls gut motility | Myenteric + submucosal plexus |
SUPPORTING CELLS (NEUROGLIA)
| Cell | Location | Function |
|---|---|---|
| Astrocytes | CNS | Blood-brain barrier, support |
| Oligodendrocytes | CNS | Myelination in CNS |
| Microglia | CNS | Immune surveillance |
| Schwann cells | PNS | Myelination in PNS |
| Satellite cells | PNS ganglia | Support neuronal cell bodies |
Give entire stroke as flow chart
stroke types ischemic hemorrhagic classification management flowchart
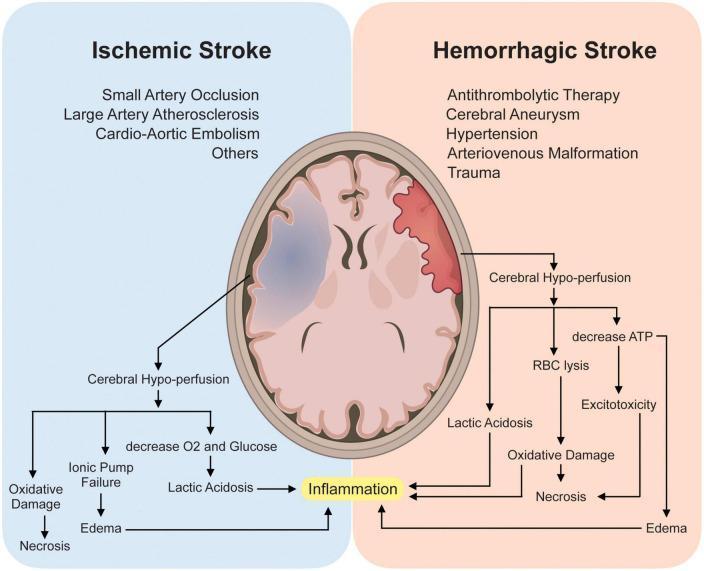
This medical infographic and pathophysiology flowchart compare Ischemic and Hemorrhagic stroke mechanisms. At the top, two axial brain illustrations highlight affected regions: a blue-shaded area in the left hemisphere represents ischemia, while a red-shaded area in the right hemisphere represents hemorrhage. Listed etiologies for Ischemic Stroke include small artery occlusion, large artery atherosclerosis, and cardio-aortic embolism. Hemorrhagic causes include antithrombolytic therapy, aneurysm, hypertension, arteriovenous malformation, and trauma. Below the illustrations, a logic flow depicts both conditions leading to cerebral hypo-perfusion. The ischemic pathway outlines oxygen/glucose deprivation, ionic pump failure, and lactic acidosis. The hemorrhagic pathway highlights red blood cell (RBC) lysis and ATP depletion. Both pathways converge on common secondary brain injury mechanisms: neuroinflammation, excitotoxicity, oxidative damage, and cerebral edema, all of which terminate in neuronal necrosis. This diagram serves as an educational tool for neurology students to understand the diverging initiating events and converging molecular outcomes of different stroke types.
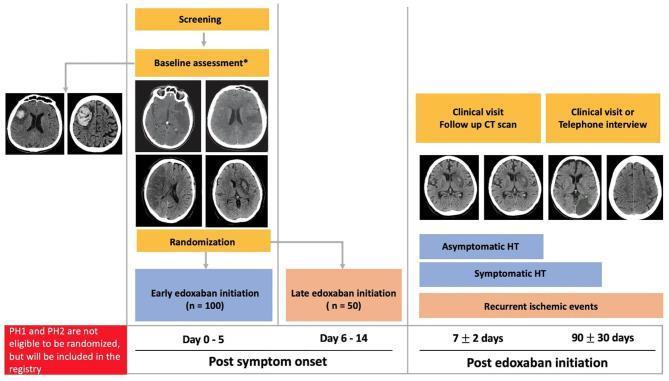
Educational flowchart and clinical imaging panel depicting the study design for a randomized controlled trial (LASER trial) on edoxaban initiation timing following atrial fibrillation-related ischemic stroke. The flowchart illustrates the timeline from screening and baseline assessment to randomization into two arms: early edoxaban initiation (Day 0–5, n=100) and late initiation (Day 6–14, n=50). Integrated into the flowchart are axial non-contrast CT scans of the head. Baseline assessment images demonstrate various stroke manifestations, including acute ischemic infarcts appearing as focal hypodensities and parenchymal hematomas (PH1 and PH2) characterized by hyperdense focal lesions with surrounding edema. Follow-up CT scan panels at 7 ± 2 days post-initiation monitor for outcomes such as asymptomatic or symptomatic hemorrhagic transformation (HT), recurrent ischemic events, and encephalomalacia. The diagram uses color-coded boxes to delineate study phases and clinical endpoints, highlighting the trial's focus on balancing the prevention of recurrent ischemia against the risk of hemorrhagic transformation in stroke management.
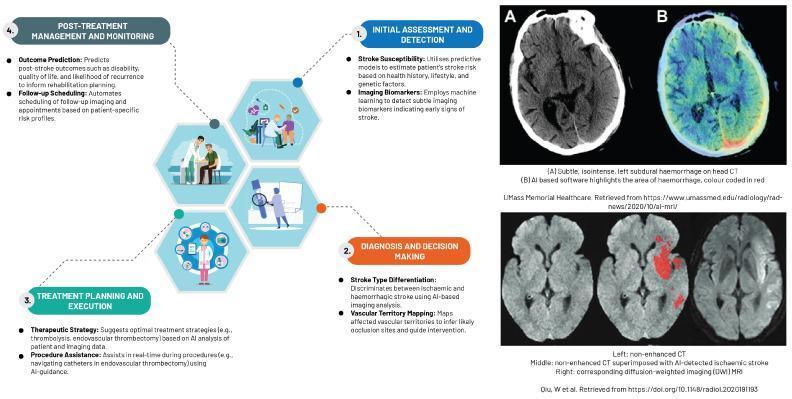
This infographic and diagnostic imaging panel illustrate machine learning applications in neuroradiology, specifically for stroke management. On the left, a flowchart describes a four-stage clinical cycle: 1) Initial Assessment (risk prediction and biomarkers), 2) Diagnosis and Decision Making (stroke type differentiation and vascular mapping), 3) Treatment Planning (therapeutic strategy and procedure assistance), and 4) Post-treatment Monitoring (outcome prediction and follow-up). The right panel provides diagnostic comparisons. The top section (A and B) displays an axial head CT showing a subtle left subdural hemorrhage, with Image B utilizing AI-based software to highlight the hemorrhagic area in red on a color-coded map. The bottom section compares three axial brain scans: a non-enhanced CT (left), an AI-augmented CT with red overlays highlighting an ischemic stroke (middle), and a corresponding Diffusion-Weighted Imaging (DWI) MRI (right) that confirms the ischemic area through restricted diffusion signal. The content serves as an educational overview of how artificial intelligence assists in detecting infarcts and hemorrhages while streamlining neuro-radiological workflows.
A detailed, comprehensive medical education flowchart titled "STROKE - Complete Overview" on a clean white background. The chart flows top to bottom with clear colored boxes and connecting arrows. TOP: Large box "STROKE (CVA - Cerebrovascular Accident)" with definition "Sudden neurological deficit due to vascular cause" RISK FACTORS box (grey): Hypertension (most important), Diabetes, Atrial fibrillation, Hyperlipidemia, Smoking, Prior TIA, Age, Family history Below splits into THREE major types with colored headers: LEFT column (BLUE) - "ISCHEMIC STROKE (80%)": - Subtypes: Thrombotic (large vessel atherosclerosis, small vessel lacunar), Embolic (cardiac - AF, valvular; artery-to-artery), Cryptogenic - Pathophysiology: Arterial occlusion → ischemic penumbra → infarction - TOAST Classification: Large artery atherosclerosis, Cardioembolism, Small vessel occlusion, Other determined, Undetermined - Clinical features: Contralateral hemiplegia, hemisensory loss, aphasia (dominant), neglect (non-dominant), visual field defect - Investigations: Non-contrast CT (exclude hemorrhage), MRI DWI (gold standard), CT angiography, Echocardiography, Carotid Doppler - ACUTE TREATMENT: IV tPA (within 4.5 hours, BP <185/110), Mechanical thrombectomy (large vessel, within 24h), Aspirin 300mg - SECONDARY PREVENTION: Antiplatelets (aspirin/clopidogrel), Anticoagulation if AF (warfarin/DOAC), Statin, BP control, Carotid endarterectomy if >70% stenosis MIDDLE column (RED) - "HEMORRHAGIC STROKE (15%) - Intracerebral Hemorrhage (ICH)": - Causes: Hypertension (most common), AVM, Amyloid angiopathy, Anticoagulants - Locations: Putamen, Thalamus, Cerebellum, Pons, Lobar - Clinical: Sudden onset, headache, vomiting, progressive deficit, seizures - Investigations: Non-contrast CT (hyperdense), MRI, Angiography if suspect AVM - Management: BP control (target <140 systolic), Reverse anticoagulation, Neurosurgical evacuation (selected cases), ICP management, NO tPA FAR RIGHT column (ORANGE) - "SUBARACHNOID HEMORRHAGE (SAH) (5%)": - Causes: Ruptured berry aneurysm (85%), AVM, Trauma - Classic: Thunderclap headache "worst headache of my life" - Complications: Vasospasm (Day 4-14), Rebleeding, Hydrocephalus, Hyponatremia - Investigations: CT (blood in cisterns), LP (xanthochromia if CT negative), CT/MR angiography - Management: Nimodipine (prevent vasospasm), Surgical clipping or endovascular coiling of aneurysm, BP control BOTTOM row: GENERAL MANAGEMENT ALL STROKES: - Airway/Breathing/Circulation (ABC) - Admit to Stroke Unit - Glucose management (avoid hypo/hyperglycemia) - Temperature control - DVT prophylaxis (enoxaparin) - Swallowing assessment before oral feeds - Early rehabilitation: Physio, OT, Speech therapy - Treat depression (common complication) OUTCOMES box (grey bottom): TIA (resolves <24h), Minor stroke, Major stroke, Death. Modified Rankin Scale for disability grading. Use a clean hierarchical layout with colored section headers, clear arrows, and medical education style formatting.
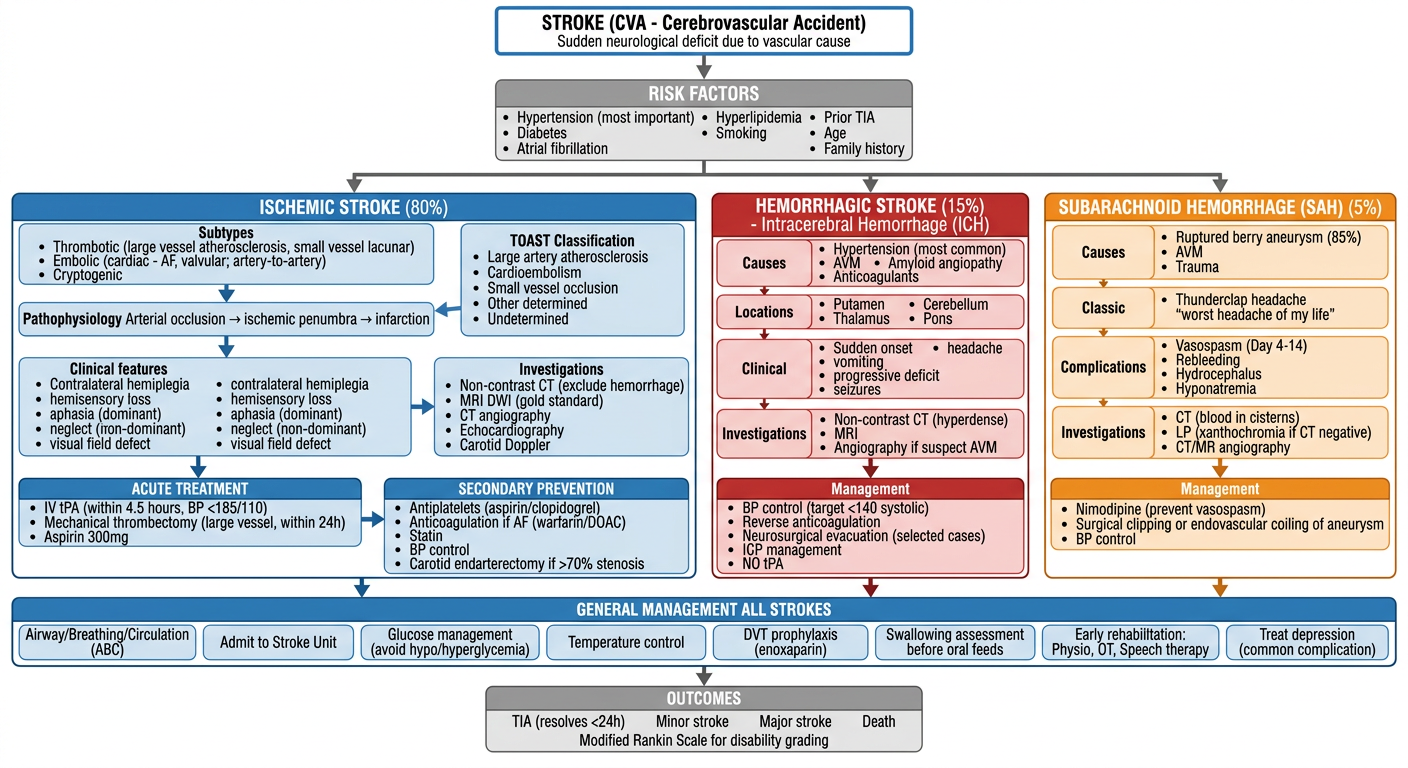
STROKE - Complete Structured Flowchart
DEFINITION
RISK FACTORS
| Modifiable | Non-Modifiable |
|---|---|
| Hypertension (most important) | Age (>55 risk doubles each decade) |
| Atrial fibrillation | Male sex |
| Diabetes mellitus | Family history |
| Hyperlipidemia | Prior TIA/stroke |
| Smoking, obesity, alcohol | Race (African American higher risk) |
TYPE 1: ISCHEMIC STROKE (80%)
- Large artery atherosclerosis (thrombotic)
- Cardioembolism (AF, valvular disease, dilated cardiomyopathy)
- Small vessel occlusion (lacunar infarcts)
- Other determined cause
- Undetermined (cryptogenic)
- MCA: Contralateral hemiplegia/hemisensory loss, aphasia (dominant), neglect (non-dominant), homonymous hemianopia
- ACA: Leg > arm weakness, abulia
- PCA: Visual field defects, memory loss
- Lacunar: Pure motor, pure sensory, ataxic hemiparesis, dysarthria-clumsy hand
- Non-contrast CT head (exclude hemorrhage)
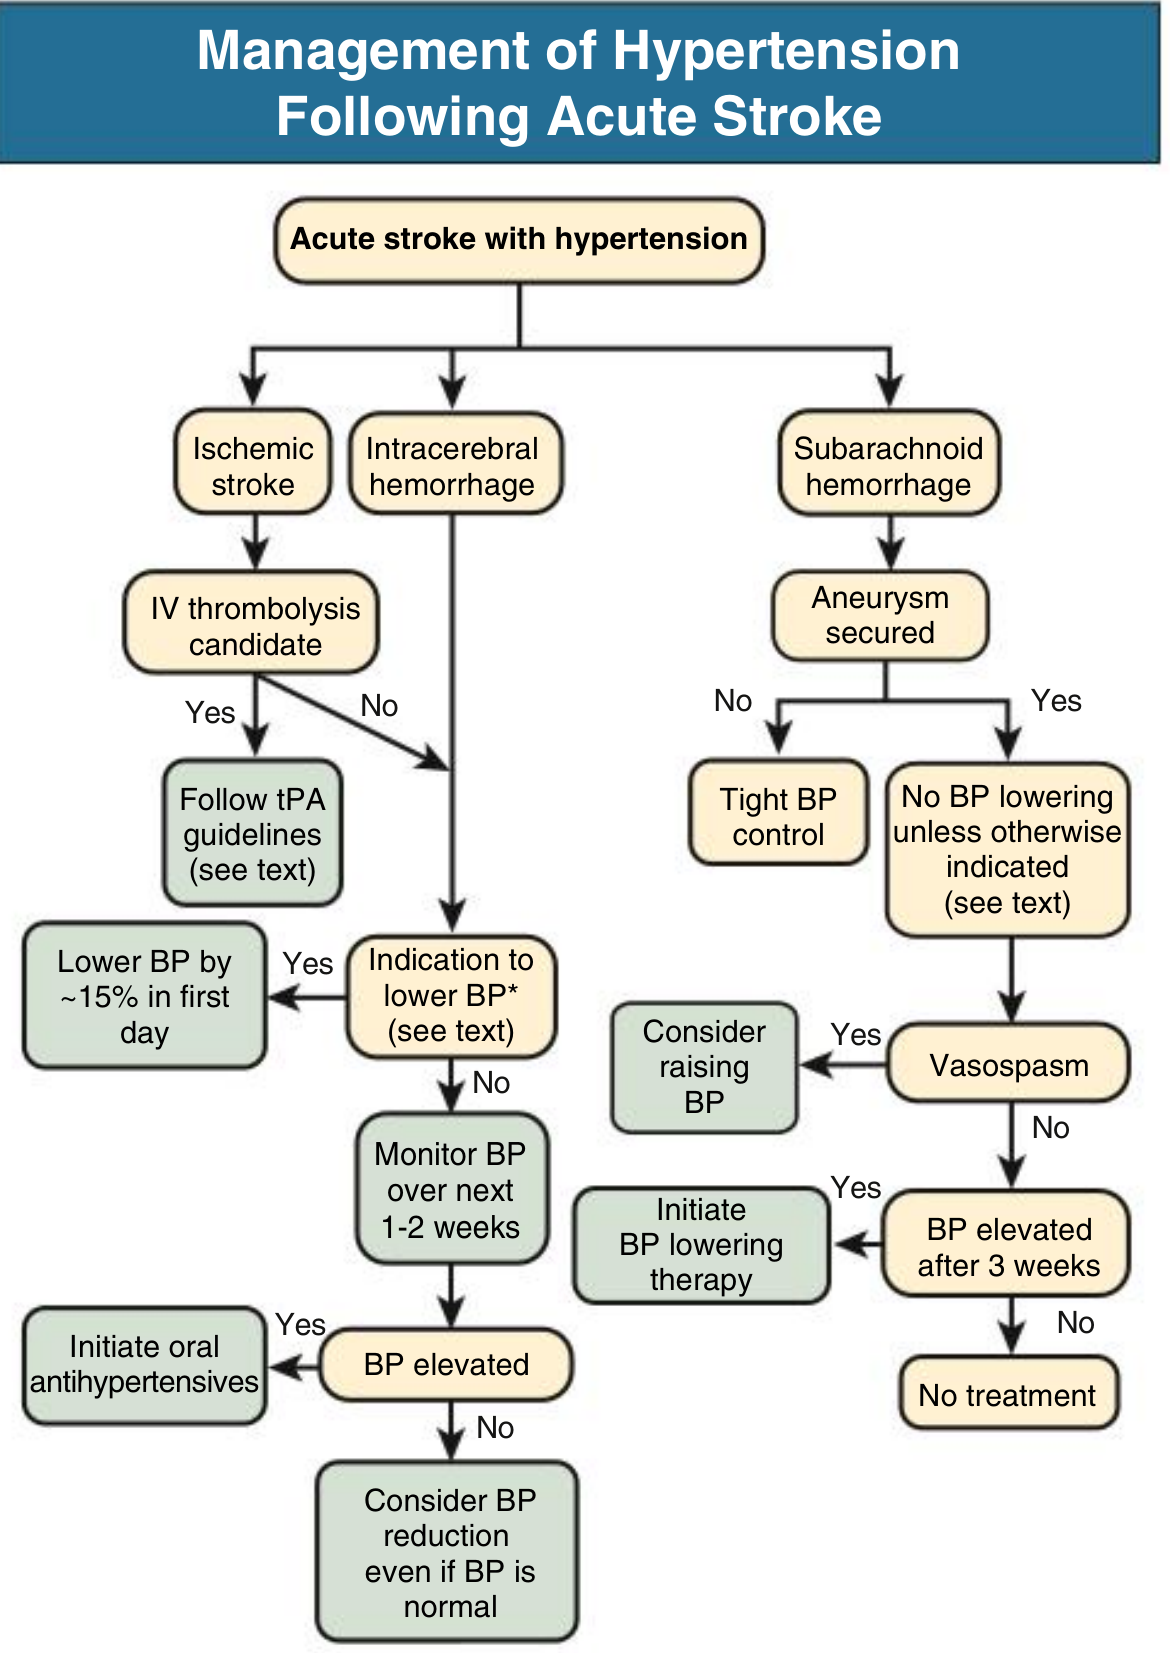
- IV tPA (alteplase) within 4.5 hours - BP must be <185/110 mmHg first
- Mechanical thrombectomy for large vessel occlusion within 24 hours
- Aspirin 300 mg (if no tPA)
- Antiplatelets: Aspirin +/- clopidogrel (DAPT for 21 days if minor stroke/TIA)
- Anticoagulation if AF (DOAC preferred)
- High-dose statin (atorvastatin 40-80 mg)
- Carotid endarterectomy if symptomatic stenosis >70%
TYPE 2: INTRACEREBRAL HEMORRHAGE (15%)
- BP target: systolic <140 mmHg (nicardipine/labetalol)
- Reverse anticoagulation immediately (FFP, Vitamin K, specific reversal agents)
- Surgical evacuation: cerebellar hematoma >3 cm, or lobar hemorrhage with herniation
- NO tPA or antiplatelets acutely
- ICP monitoring if GCS <8
TYPE 3: SUBARACHNOID HEMORRHAGE (5%)
- Vasospasm (Day 4-14): give Nimodipine (60 mg every 4 hours x 21 days)
- Rebleeding (highest risk first 24 hours): secure aneurysm urgently
- Ventriculomegaly (hydrocephalus): external ventricular drain
- Venous sodium loss (hyponatremia/cerebral salt wasting)
TIA (Transient Ischemic Attack)
- Neurological deficit that resolves within 24 hours (most within 1 hour)
- Risk of stroke: ABCD² score (Age, BP, Clinical features, Duration, Diabetes)
- Urgent investigation and secondary prevention same as ischemic stroke
GENERAL MANAGEMENT (All Stroke Types)
- ABC - Airway, Breathing, Circulation
- Admit to dedicated Stroke Unit (reduces mortality and disability)
- Glucose control - avoid hypo/hyperglycemia (target 4-11 mmol/L)
- Temperature - treat fever (paracetamol, cooling)
- DVT prophylaxis - enoxaparin, compression stockings
- Swallowing assessment before any oral feeding (SALT assessment)
- Early rehabilitation - physiotherapy, occupational therapy, speech therapy
- Screen and treat post-stroke depression (affects 30-50%)
OUTCOME SCALE
Umn case flow chart
upper motor neuron lesion signs clinical features localization
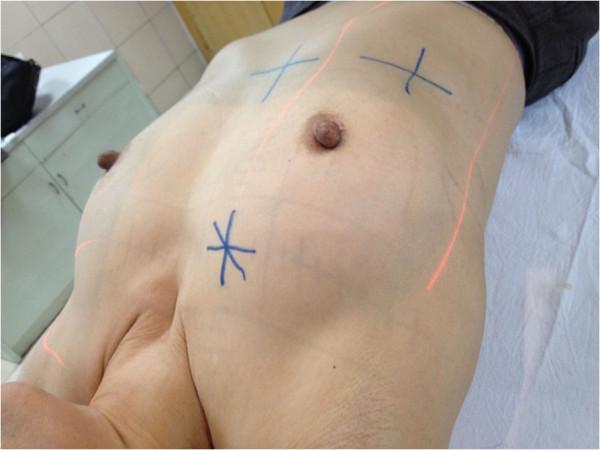
This clinical photograph displays a patient's torso positioned for a preoperative localization procedure, specifically for identifying a surface puncture point prior to video-assisted thoracoscopic surgery (VATS). The image shows the upper chest and right axillary region. Key visual features include blue ink markings on the skin: three '+' signs serve as fiduciary marks representing alignment lines from a CT gantry for anatomical orientation, and one '*' asterisk marks the specific identified puncture site. Red laser alignment lines are projected vertically and horizontally across the patient's skin, originating from a radiotherapy simulator used for 3D simulation and localization. These markings are essential for guiding the injection of methylene blue dye to stain the pathway to a pulmonary lesion. The educational focus is on the clinical workflow of image-guided preoperative marking in thoracic surgery, demonstrating the integration of diagnostic imaging (CT) with physical simulation for accurate lesion localization.
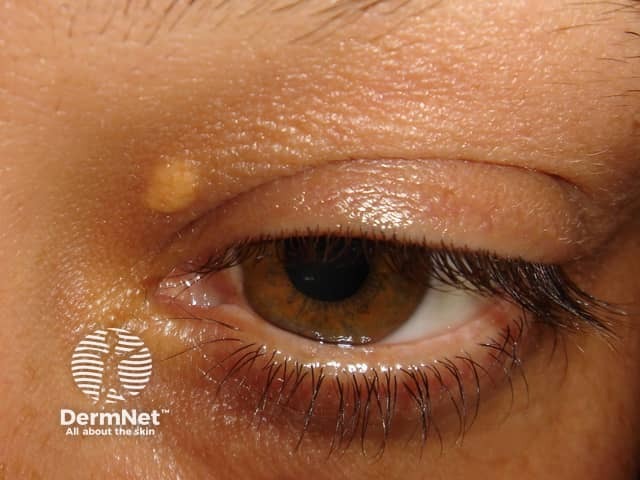
This is a high-resolution clinical photograph of a periorbital eyelid lesion consistent with xanthelasma palpebrarum. Modality and technique: Clinical photography, color RGB, close-up macro of the left upper eyelid and medial canthus with frontal/oblique view to document lesion position and morphology. Anatomical localization: Periorbital skin around the left palpebral region; upper eyelid; medial canthus; integumentary system. Visual features: Soft, well-circumscribed, yellow to pale-orange plaque on the superior medial eyelid, with smooth surface and slight flattening at the margins. Coloration more pronounced toward the medial aspect; surrounding skin shows mild hyperpigmentation and normal folds. Pathologic inference: Xanthelasma represents lipid-laden macrophage infiltration in the dermis; visually appears as lipid-rich, cholesterol-laden deposits beneath the epidermis; while biopsy would show foamy histiocytes and cholesterol clefts. Diagnostic significance: Strong clinical cue for dyslipidemia; often associated with hyperlipidemia or inherited lipid disorders; warrants lipid profile evaluation and cardiovascular risk assessment. Clinical use: Educational for dermatology and ophthalmology trainees; differential includes syringomas, milia, sebaceous hyperplasia; radiology not applicable; management involves lipid control, laser or surgical removal for cosmetic reasons. Useful in teaching exam-style questions about diagnosis, morphology, differential, and systemic associations. This image anchors discussion of dermatologic signs correlating with systemic lipid disorders.
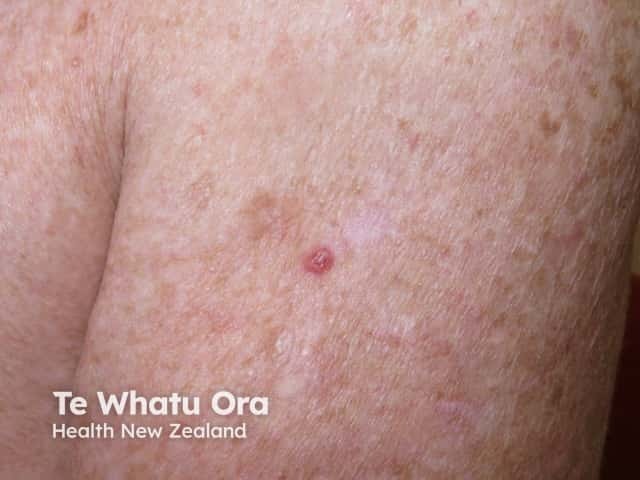
This is a high-resolution clinical photography image capturing a solitary nodular lesion on the cutaneous surface of the upper limb. Modality: Clinical photography with macro close-up; technique: standard color imaging without magnification accessories; acquisition: single still frame. Anatomical localization: integumentary system, skin of the arm (upper extremity), dermal/epidermal layers; laterality not specified. Visual features: a small, dome-shaped, pink-red papule with slight translucency and a smooth, shiny surface. The lesion measures roughly 5 mm in diameter and shows a well-defined margin with subtle pearly quality. Fine telangiectatic vessels may be present on the surface; no gross ulceration is evident. Surrounding skin demonstrates mild actinic change and background sun exposure changes. Impression: lesion consistent with nodular basal cell carcinoma spectrum, characterized by dermal nests of basaloid cells in histology, aligned palisading at the tumor-stroma interface (in presumed biopsy specimens). Clinical significance: nodular BCC is the most common skin cancer variant; often locally invasive but rarely metastasizes; early recognition supports elective excision with clear margins and Mohs micrographic surgery when indicated. Differential considerations include keratoacanthoma, sebaceous hyperplasia, squamous cell carcinoma, and benign adnexal tumors. This image is suitable for educational demonstrations of cutaneous oncology, dermatology training, and image-guided diagnosis discussions; it supports correlation with histopathology and treatment planning.
A detailed medical education flowchart titled "UPPER MOTOR NEURON (UMN) LESION - Complete Clinical Flowchart" on a white background. SECTION 1 (BLUE header): "THE CORTICOSPINAL (PYRAMIDAL) TRACT - Anatomy" Box: Motor Cortex (Brodmann Area 4 + Area 6 premotor + Areas 3,1,2 somatosensory) ↓ Corona Radiata ↓ Posterior limb of Internal Capsule ↓ Cerebral Peduncle (midbrain) ↓ Basis Pontis (pons) ↓ Medullary Pyramid ↓ DECUSSATION at lower medulla (90% fibers cross) ↓ Lateral Corticospinal Tract (spinal cord) ↓ Anterior Horn Cell (Lower Motor Neuron) → Muscle SECTION 2 (RED header): "UMN LESION - Classical Signs" Two columns: ACUTE UMN LESION (Spinal shock / Diaschisis): - Flaccid paralysis - Decreased tone (hypotonia) - Decreased/absent reflexes - Babinski positive - No fasciculations, no wasting CHRONIC UMN LESION (after days to weeks): - Spastic paresis (clasp-knife spasticity) - INCREASED tone (spasticity) - HYPERREFLEXIA (brisk DTRs) - Clonus (sustained rhythmic contractions) - Babinski sign POSITIVE (extensor plantar) - Hoffman's sign positive (upper limb) - No muscle fasciculations - Minimal/no muscle wasting - Weakness (extensors more than flexors in upper limb; flexors more than extensors in lower limb) SECTION 3 (ORANGE header): "LOCALIZATION OF UMN LESION - Level by Level" Table with 4 columns: Level | Site | UMN Signs | Other Clues Cortex: Contralateral mono/hemiplegia, focal seizures, cortical sensory loss, aphasia (dominant), neglect (non-dominant) Internal Capsule: Dense contralateral hemiplegia (face+arm+leg equally), hemianopia, "pure motor hemiplegia" Brainstem (Midbrain): Crossed signs - ipsilateral CN III palsy + contralateral hemiplegia (Weber syndrome) Brainstem (Pons): Ipsilateral CN VI/VII palsy + contralateral hemiplegia (Millard-Gubler), locked-in syndrome Brainstem (Medulla): Ipsilateral CN XII + contralateral hemiplegia (medial medullary syndrome) Cervical Cord (above C4): Quadriplegia/tetraplegia, UMN all 4 limbs, respiratory compromise Cervical Cord (C5-T1): UMN legs + LMN arms (mixed), Horner syndrome if lateral Thoracic Cord: Paraplegia (UMN both legs), sensory level, bowel/bladder dysfunction Brown-Séquard: Ipsilateral UMN + ipsilateral dorsal column loss + contralateral spinothalamic loss SECTION 4 (GREEN header): "COMMON CAUSES OF UMN LESIONS" Brain: Stroke (most common), Brain tumor, Abscess, MS (demyelination), Head trauma, Subdural/epidural hemorrhage Brainstem: Stroke, MS, Tumor, Wernicke encephalopathy Spinal Cord: Cervical spondylotic myelopathy (most common), MS, Trauma, Syringomyelia, Transverse myelitis, Tumors, Subacute combined degeneration (B12), Motor neuron disease (ALS - combined UMN+LMN) SECTION 5 (PURPLE header): "UMN vs LMN COMPARISON TABLE" Comparison table: Feature | UMN | LMN Tone | Increased (spastic) | Decreased (flaccid) Reflexes | Hyperreflexia | Hyporeflexia/absent Babinski | Extensor (positive) | Flexor (normal) Clonus | Present | Absent Wasting | Absent (or mild disuse) | Prominent Fasciculations | Absent | Present Pattern of weakness | Pyramidal distribution | Focal/segmental/myotomal SECTION 6 (DARK BLUE header): "INVESTIGATIONS" MRI brain/spine (gold standard), CT head, CSF analysis, NCS/EMG (normal in UMN), MRA/CTA if vascular BOTTOM FOOTER: "Key Pearl: Acute UMN lesion = flaccid (spinal shock); Chronic UMN lesion = spastic. Babinski sign is ALWAYS an UMN sign." Clean hierarchical layout, color-coded sections, clear arrows, medical textbook style.
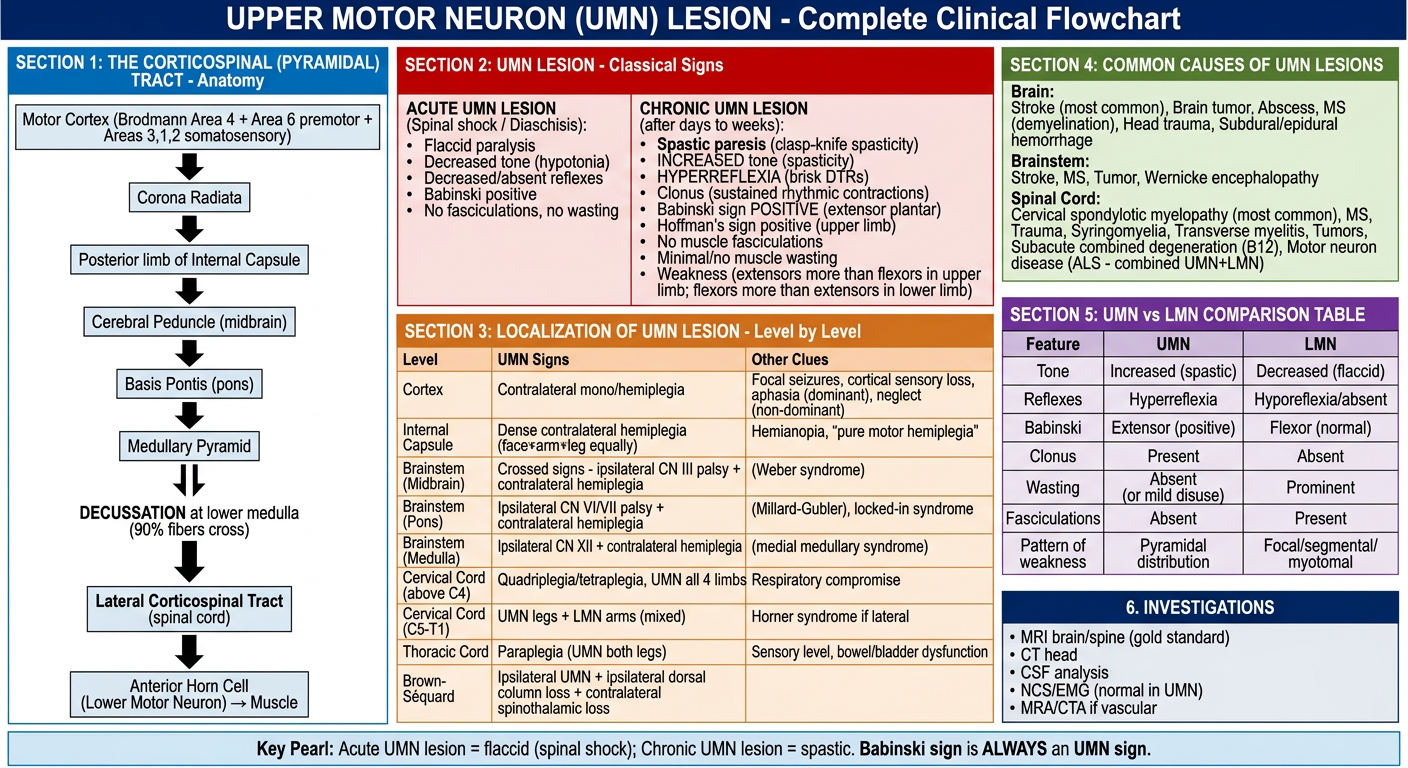
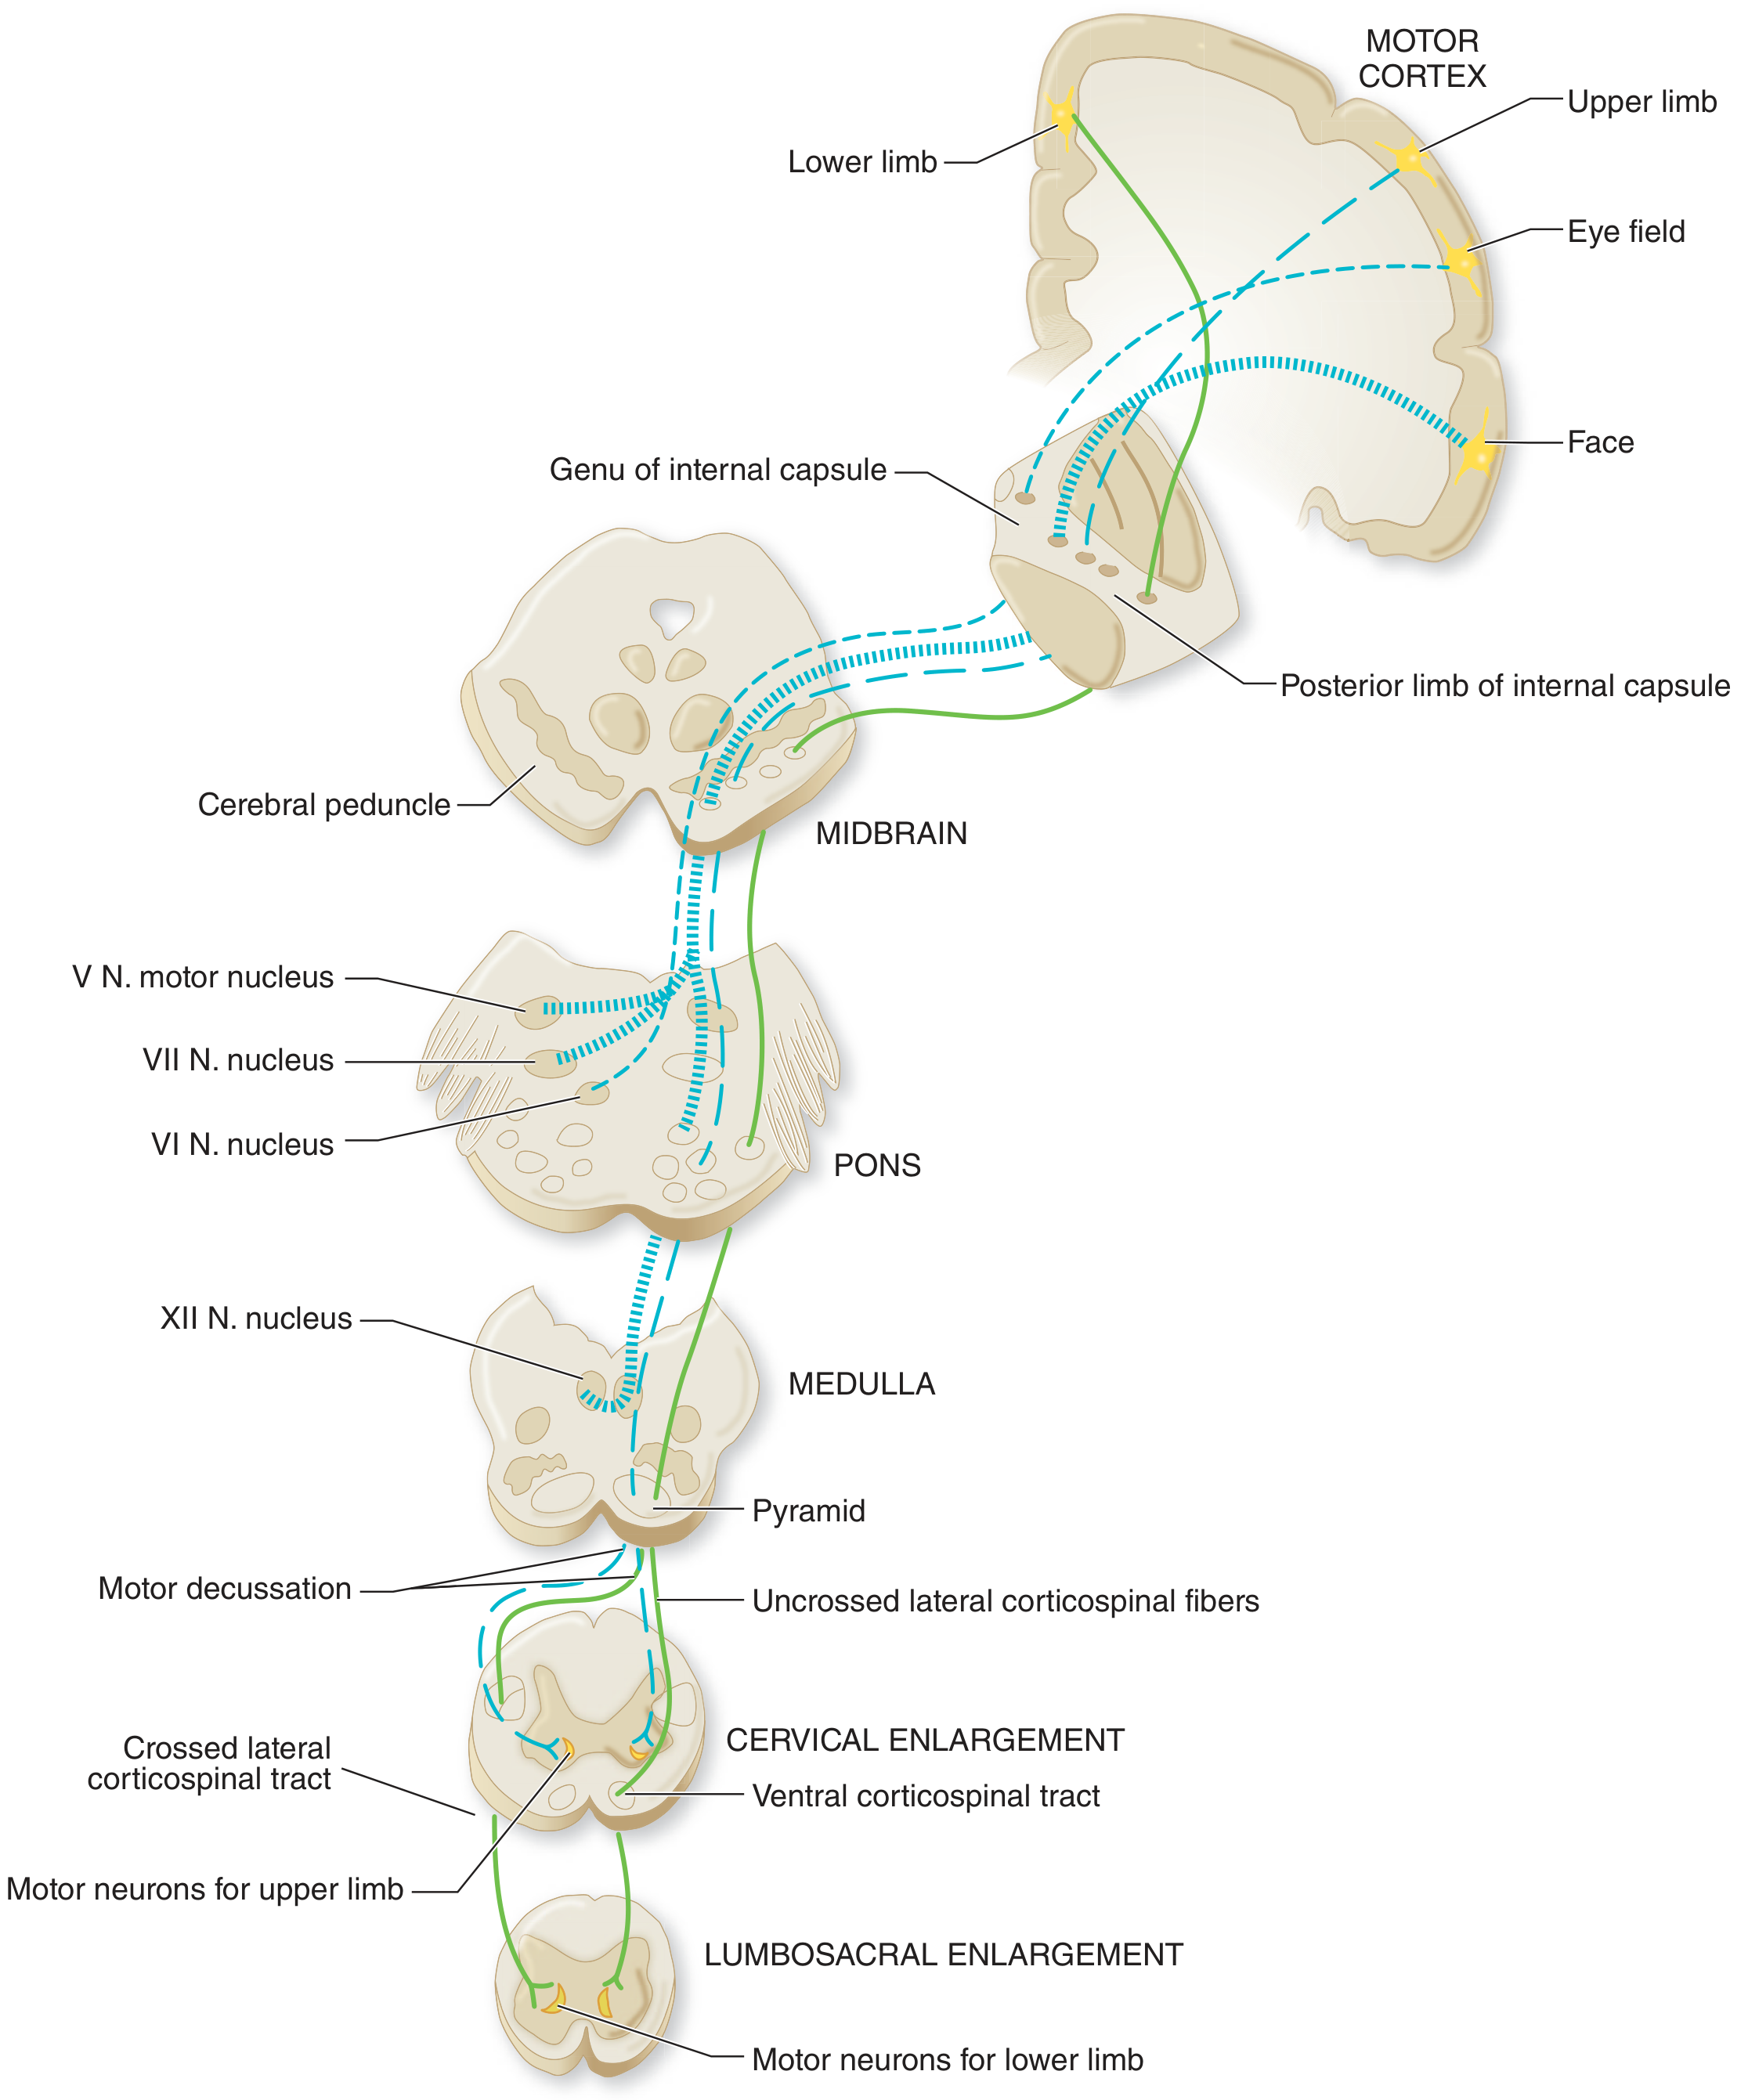
UMN LESION - Complete Structured Flowchart
THE CORTICOSPINAL TRACT (Anatomy)
Motor Cortex (Area 4 + Area 6 + Areas 3,1,2)
       ↓
  Corona Radiata
       ↓
  Posterior limb of Internal Capsule
       ↓
  Cerebral Peduncle (Midbrain)
       ↓
  Basis Pontis (Pons)
       ↓
  Medullary Pyramid
       ↓
  DECUSSATION at lower medulla (90% fibers cross)
       ↓
  Lateral Corticospinal Tract (in spinal cord)
       ↓
  Anterior Horn Cell (LMN) → Neuromuscular Junction → Muscle
UMN SIGNS: ACUTE vs. CHRONIC
| Feature | ACUTE UMN (Spinal Shock / Diaschisis) | CHRONIC UMN |
|---|---|---|
| Tone | Decreased (flaccid) | Increased (spasticity - clasp-knife) |
| Reflexes | Decreased/absent | Hyperreflexia + clonus |
| Babinski | Positive (extensor plantar) | Positive |
| Hoffman's sign | May be absent | Present (upper limb) |
| Wasting | No | No (or mild disuse only) |
| Fasciculations | Absent | Absent |
| Pattern | Flaccid paralysis | Pyramidal pattern weakness |
Key pearl: Acutely after a UMN lesion, the presentation mimics LMN (flaccid, hyporeflexic) - this is spinal shock or diaschisis. Spasticity develops over hours to weeks.
LOCALIZATION BY LEVEL
| Level | Laterality | UMN Signs | Distinguishing Features |
|---|---|---|---|
| Motor Cortex | Contralateral | Mono/hemiplegia (arm > leg if lateral) | Focal seizures, cortical sensory loss, aphasia (dominant), neglect (non-dominant) |
| Internal Capsule | Contralateral | Dense hemiplegia face+arm+leg equally | Hemianopia; "pure motor hemiplegia" |
| Midbrain | Contralateral hemiplegia | UMN limbs | + Ipsilateral CN III palsy = Weber syndrome |
| Pons | Contralateral hemiplegia | UMN limbs | + Ipsilateral CN VI/VII = Millard-Gubler syndrome |
| Medulla | Contralateral hemiplegia | UMN limbs | + Ipsilateral CN XII = Medial medullary syndrome |
| Cervical cord (above C4) | Bilateral (all 4 limbs) | Quadriplegia, UMN throughout | Respiratory compromise (phrenic nerve at C3-C5) |
| Cervical cord (C5-T1) | Bilateral | UMN legs + LMN arms | Mixed picture, Horner syndrome if lateral lesion |
| Thoracic cord | Bilateral legs | Paraplegia | Sensory level on trunk, neurogenic bladder/bowel |
| Brown-Sequard (hemisection) | Ipsilateral UMN | Ipsilateral leg UMN | + Ipsilateral proprioception loss + Contralateral pain/temp loss |
COMMON CAUSES
| Location | Causes |
|---|---|
| Cortex / Subcortical | Stroke (ischemic/hemorrhagic), brain tumor, abscess, MS, head trauma, subdural hematoma |
| Brainstem | Stroke (vertebrobasilar), MS plaque, tumor, Wernicke encephalopathy |
| Spinal Cord | Cervical spondylotic myelopathy (most common), MS, trauma/fracture, syringomyelia, transverse myelitis, epidural abscess/tumor, subacute combined degeneration (B12 deficiency) |
| Mixed UMN+LMN | ALS (amyotrophic lateral sclerosis) - both upper and lower motor neurons affected |
UMN vs. LMN Quick Comparison
| Sign | UMN | LMN |
|---|---|---|
| Tone | Increased (spastic) | Decreased (flaccid) |
| Reflexes (DTRs) | Brisk / hyperreflexia | Diminished / absent |
| Babinski | Extensor (positive) | Flexor (normal/downgoing) |
| Clonus | Present | Absent |
| Fasciculations | Absent | Present |
| Muscle wasting | Absent (disuse only) | Prominent |
| Weakness pattern | Pyramidal distribution | Myotomal / focal / diffuse |
| EMG/NCS | Normal (except poor activation) | Denervation changes (fibrillations) |
INVESTIGATIONS
- MRI brain/spine (gold standard for localization)
- CT head (emergency - exclude hemorrhage)
- MRA/CTA (if vascular cause suspected)
- CSF analysis (MS, myelitis, infection)
- NCS/EMG: normal in pure UMN (differentiates from LMN/peripheral causes)
- B12, copper levels (if myelopathy suspected)
Treatment of cellulitis stepwise and give flowchart baded on harrison and love and bailey
A comprehensive, detailed medical education stepwise treatment flowchart titled "TREATMENT OF CELLULITIS - Stepwise Approach" based on Harrison's Principles of Internal Medicine (22e) and Bailey & Love's Short Practice of Surgery (28e). Clean white background, color-coded sections, hierarchical layout with arrows. TOP BOX (dark blue): "CELLULITIS - Definition & Diagnosis" - Bacterial infection of dermis + subcutaneous fat - Cardinal signs: Erythema, Oedema, Warmth, Tenderness, Pain - Systemic signs: Fever, Malaise, Leukocytosis, Rigors - Organisms: Streptococcus pyogenes (GAS) and S. aureus (most common); MRSA in risk groups - Blood cultures often negative; diagnosis is CLINICAL - Distinguish from: Erysipelas (more superficial, sharply demarcated), Necrotising Fasciitis (deeper, more necrotic, requires surgery) STEP 1 BOX (green): "STEP 1 - ASSESS SEVERITY" THREE branches: LEFT column (light green): "MILD (Non-purulent, Outpatient)" - Systemically well, afebrile or low-grade fever - No comorbidities - Non-purulent cellulitis - Small area, non-spreading MIDDLE column (yellow-orange): "MODERATE (Purulent or Systemic Signs)" - Purulent cellulitis / abscess present - Systemic signs: Fever >38°C, Tachycardia, Leukocytosis - Spreading rapidly - Failed outpatient therapy - Comorbidities (diabetes, obesity, lymphedema, vascular disease) RIGHT column (red): "SEVERE (Hospitalise Immediately)" - Toxic/septic patient - Rapidly spreading cellulitis - Bullous/haemorrhagic lesions - Violaceous/dark discolouration (suspect necrotising fasciitis) - Immunocompromised - Failed IV therapy - Facial cellulitis / periorbital - Signs of septic shock STEP 2 BOX (blue): "STEP 2 - INITIAL GENERAL MEASURES (ALL PATIENTS)" - Blood cultures + FBC + CRP + U&E before antibiotics (Bailey & Love) - Mark the border of erythema with skin marker (monitor spread) - Elevate affected limb (reduces oedema, aids recovery) - Analgesia - Adequate hydration - Blood glucose management in diabetics - Wound swab if open wound / discharge present STEP 3 BOX (purple): "STEP 3 - ANTIBIOTIC THERAPY (Harrison's 22e)" Three treatment columns: MILD (outpatient oral - 10-14 days): - Non-purulent (Streptococcal): Oral Penicillin V 500mg QDS OR Cefalexin (Cephalexin) 250-500mg QDS for 10 days - MSSA concern: Oral Flucloxacillin 500mg QDS (dicloxacillin 500mg QDS) OR Cefalexin 250-500mg QDS - If MRSA risk: Trimethoprim-Sulfamethoxazole (TMP-SMX) 160/800mg BD x10-14 days OR Doxycycline 100mg BD OR Clindamycin 300mg TDS x10 days - Bite wounds (Pasteurella/Eikenella): Amoxicillin-Clavulanate 625mg TDS MODERATE (may need IV then step-down): - Purulent: Incision & Drainage (I&D) FIRST, then antibiotics - If MRSA risk: TMP-SMX or Doxycycline or Clindamycin oral - If systemic signs: Admit, IV antibiotics (see below) - Oral amoxicillin-clavulanate for typical non-purulent SEVERE (IV - inpatient): - Standard: IV Cefazolin 1-2g 8-hourly (anti-Staph and Strep cover) - MRSA suspected: IV Vancomycin 15mg/kg 12-hourly - Immunocompromised / Gram-negative risk: IV Piperacillin-Tazobactam 4.5g 6-hourly - Septic / unclear: IV Vancomycin + IV Cefepime (Harrison's 22e) - β-lactam allergy: IV Clindamycin 600mg 8-hourly - Step down to oral once clinical improvement (usually 48-72 hours) STEP 4 BOX (orange): "STEP 4 - WHEN TO SUSPECT NECROTISING FASCIITIS (SURGICAL EMERGENCY)" Warning signs - the LRINEC score risk factors: - Pain out of proportion to signs - Rapidly spreading beyond marked border - Gas in tissues on imaging (crepitus) - Violaceous / dusky discolouration or bullae - Systemic toxicity with shock - No response to IV antibiotics in 24-48h ACTION → URGENT surgical exploration and debridement + broad spectrum IV antibiotics (Piperacillin-tazobactam 4.5g 6-hourly + Vancomycin) STEP 5 BOX (teal): "STEP 5 - MONITORING & REVIEW" - Review at 24-48 hours: Check if erythema spreading beyond marked border - If NOT improving in 48h → Reassess diagnosis + escalate antibiotics + imaging (US to exclude abscess) - If improving → Complete 10-14 day course - Criteria for step-down from IV to oral: Afebrile x24h, Erythema not spreading, Tolerating oral STEP 6 BOX (grey): "STEP 6 - RECURRENT CELLULITIS PREVENTION" - Treat predisposing conditions: Tinea pedis, Eczema, Leg oedema, Lymphoedema - Compression stockings - Prophylactic Phenoxymethylpenicillin (Penicillin V) 250mg BD for 6-12 months if ≥3 episodes/year (Harrison's) - Skin hygiene - Moisturise dry skin BOTTOM: Source citations: Harrison's Principles of Internal Medicine 22e (2025) | Bailey & Love's Short Practice of Surgery 28e | Sabiston Textbook of Surgery | Goldman-Cecil Medicine Clean, professional medical education style, well-spaced, all text readable, color-coded step boxes with numbered steps on the left.
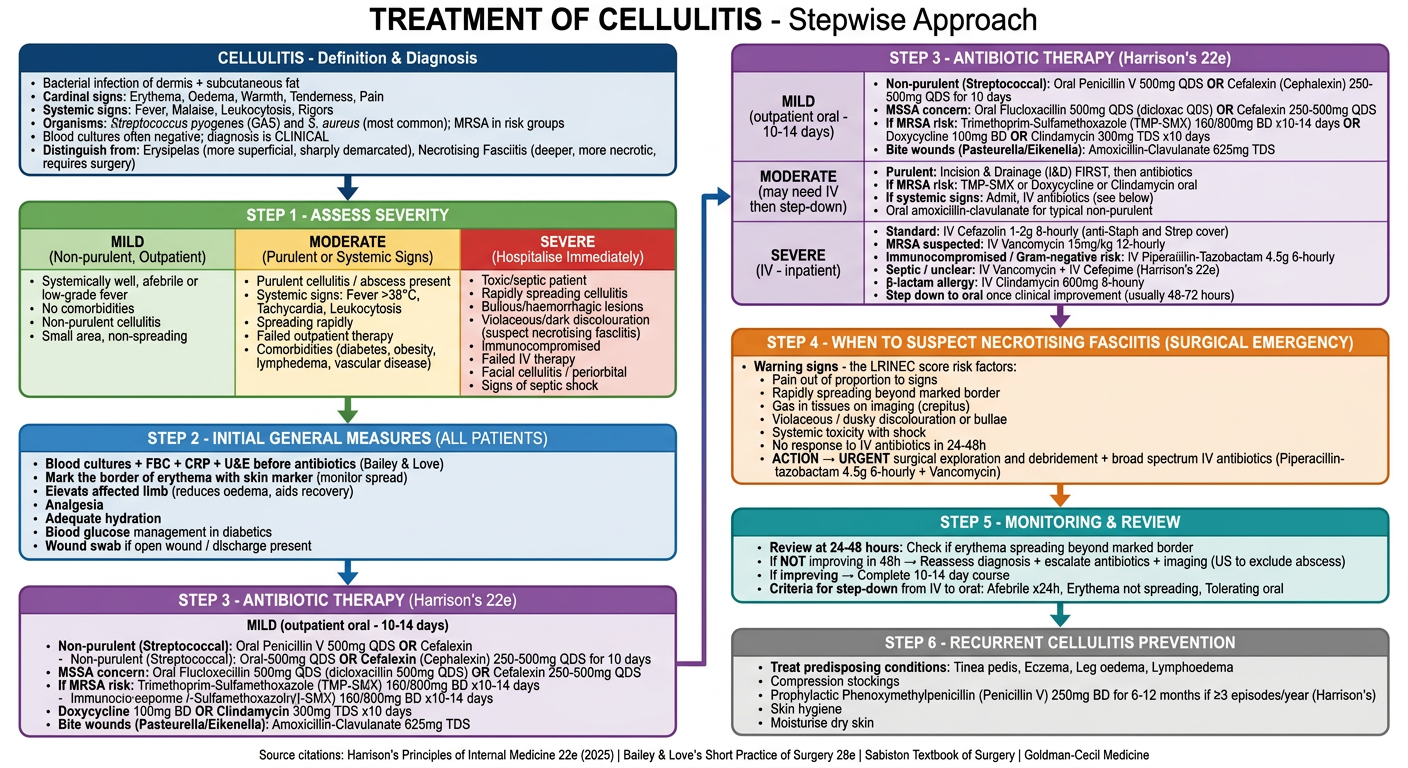
CELLULITIS - Stepwise Treatment
DEFINITION (Bailey & Love, 28e)
STEP 1 - ASSESS SEVERITY
| Feature | Mild | Moderate | Severe |
|---|---|---|---|
| Systemic signs | Absent or minimal | Fever, tachycardia | Sepsis, shock |
| Lesion | Small, non-spreading | Spreading, ±purulence | Bullous, haemorrhagic, violaceous |
| Host | Healthy, immunocompetent | Comorbidities (DM, obesity) | Immunocompromised |
| Setting | Outpatient | May need admission | Hospital mandatory |
STEP 2 - INITIAL GENERAL MEASURES (All Patients)
- Mark the erythema border with pen - monitor hourly/daily spread
- Blood cultures + FBC + CRP + U&E + Blood glucose before starting antibiotics
- Wound swab if any open wound, discharge or ulcer
- Elevate the limb - reduces oedema, aids antibiotic delivery
- Analgesia (NSAIDs/paracetamol)
- IV fluid resuscitation if systemically unwell
- Strict glycaemic control in diabetics
STEP 3 - ANTIBIOTIC TREATMENT (Harrison's 22e)
MILD DISEASE - Outpatient Oral Antibiotics (10-14 days)
- Oral Penicillin V 500 mg QDS, OR
- Oral Cefalexin (Cephalexin) 250-500 mg QDS x 10 days, OR
- Oral Flucloxacillin 500 mg QDS (if MSSA also suspected)
- Trimethoprim-Sulfamethoxazole (Co-trimoxazole) 160/800 mg BD x 10-14 days, OR
- Doxycycline 100 mg BD x 10-14 days, OR
- Clindamycin 300 mg TDS x 10 days
- Amoxicillin-Clavulanate 625 mg TDS (co-amoxiclav)
- Note: Pasteurella is resistant to flucloxacillin/dicloxacillin
MODERATE DISEASE - Oral ± Short Course IV
- Incision & Drainage (I&D) first - this is the primary treatment
- Oral antibiotics as above for MRSA coverage
- Wound culture before antibiotics
- Admit if failing outpatient therapy or unable to tolerate orals
- Step down to oral once afebrile x24h and erythema not spreading
SEVERE DISEASE - IV Antibiotics (Inpatient)
| Situation | Antibiotic | Dose |
|---|---|---|
| Standard (Strep/MSSA cover) | IV Cefazolin | 1-2 g every 8 hours |
| MRSA suspected | IV Vancomycin | 15 mg/kg every 12 hours |
| Immunocompromised / Gram-negative risk | IV Piperacillin-Tazobactam | 4.5 g every 6 hours |
| Septic / polymicrobial / unclear | IV Vancomycin + IV Cefepime | 15 mg/kg BD + 2 g TDS (Harrison's 22e) |
| β-lactam allergy | IV Clindamycin | 600 mg every 8 hours |
| Sepsis + suspected anaerobes | Add IV Metronidazole | 500 mg TDS |
Step down from IV to oral: once afebrile for 24 hours AND erythema is not spreading (usually 48-72 hours of IV therapy)
STEP 4 - RED FLAGS: SUSPECT NECROTISING FASCIITIS
- Pain out of proportion to visible skin changes
- Rapid spread beyond the marked border despite IV antibiotics
- Crepitus (gas in tissues)
- Violaceous / dusky / black skin discolouration
- Haemorrhagic bullae
- Systemic toxicity, shock, multi-organ failure
- No improvement after 24-48 hours of IV antibiotics
- Urgent surgical exploration + aggressive debridement (DO NOT DELAY)
- Broad-spectrum IV: Piperacillin-tazobactam 4.5 g 6-hourly + Vancomycin 15 mg/kg 12-hourly
- HDU/ICU admission
- Repeat debridement as required
STEP 5 - MONITORING & REVIEW
| Time | Action |
|---|---|
| Every 4-6 hours (acute) | Check if erythema spreading beyond skin marker |
| At 48 hours | Formal reassessment - improving or not? |
| If NOT improving at 48h | Re-examine, repeat cultures, USS to exclude deep abscess, LRINEC score, surgical review |
| If improving | Complete 10-14 day course (oral step-down if IV started) |
| Discharge criteria | Afebrile, erythema stable/regressing, tolerating oral antibiotics |
STEP 6 - RECURRENT CELLULITIS PREVENTION
- Treat tinea pedis (fissures act as portal of entry for Streptococci)
- Compression stockings for venous insufficiency / lymphoedema
- Prophylactic Penicillin V 250 mg BD - for patients with ≥2-3 episodes per year
- Moisturise dry/cracked skin
- Treat eczema and other predisposing skin conditions
- Weight loss in obesity
SPECIAL SITUATIONS
| Setting | Organisms | Treatment |
|---|---|---|
| Cat/Dog bite | Pasteurella multocida | Amoxicillin-clavulanate (NOT flucloxacillin) |
| Fish handler / fishmonger | Erysipelothrix rhusiopathiae | Penicillin, cephalosporins (NOT vancomycin - resistant) |
| Fresh water exposure | Aeromonas hydrophila | Doxycycline + Ceftriaxone |
| Salt water exposure | Vibrio vulnificus | Doxycycline + Ceftriaxone |
| Diabetic / peripheral vascular | Group B Streptococcus, GNBs | Broader spectrum cover |
| Periorbital cellulitis (child) | H. influenzae (pre-Hib era), S. aureus | IV Cefuroxime / Ceftriaxone - admit |
How to learn ecg
best way to learn ECG interpretation for medical students step by step 2024
ECG waves PQRST intervals normal values diagram
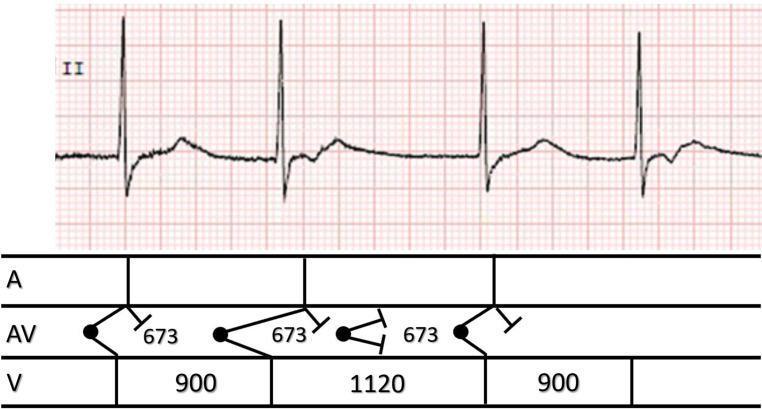
This diagnostic image contains a single-lead electrocardiogram (ECG) rhythm strip from lead II, paired with a corresponding ladder diagram to illustrate cardiac conduction. The ECG demonstrates group beating with variable R-R intervals (900ms and 1120ms), absence of normal sinus P waves, and the presence of retrograde P waves (inverted deflections following the QRS complexes). The visual evidence points to a junctional rhythm with retrograde atrial conduction and occasional reciprocal (echo) beats. The ladder diagram below the tracing provides a schematic representation of conduction across three levels: Atria (A), Atrioventricular node (AV), and Ventricles (V). It specifically denotes timing intervals (673ms, 900ms, 1120ms) and uses standard symbols to indicate points of origin (dots), antegrade and retrograde conduction pathways (angled lines), and conduction block (perpendicular bars). This material is designed for intermediate to advanced cardiovascular education, specifically focusing on complex arrhythmia interpretation and the electrophysiological mechanism of re-entrant junctional rhythms.
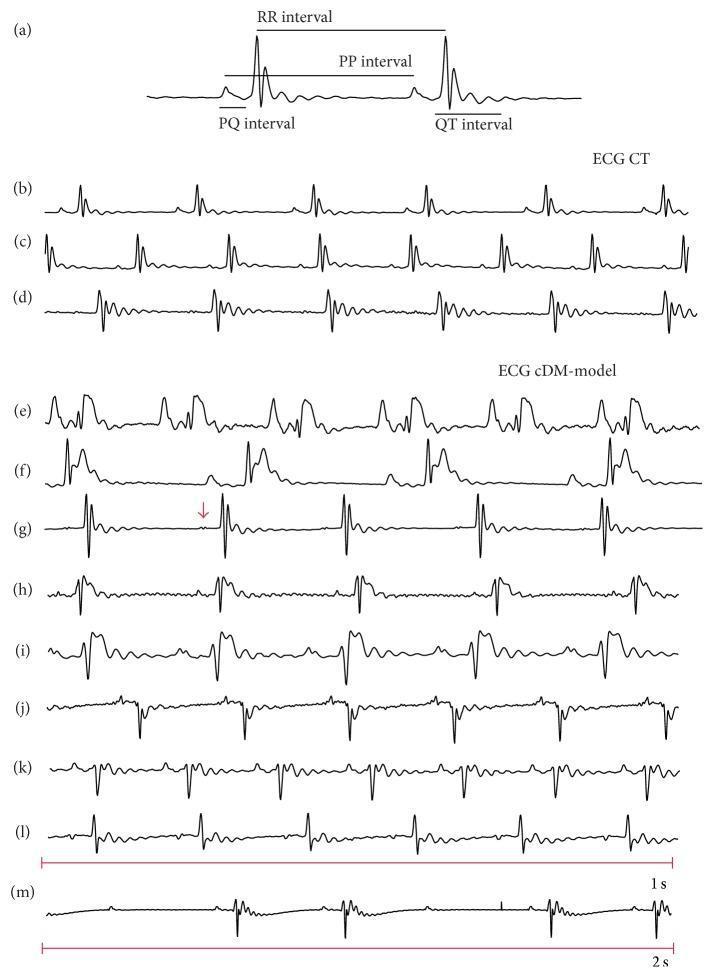
This diagnostic image displays multiple electrocardiogram (ECG) rhythm strips comparing control conditions (ECG CT) with a chronic diabetes mellitus model (ECG cDM-model). Panel (a) provides a reference anatomical diagram of ECG intervals, including the PQ, RR, PP, and QT intervals. Panels (b-d) show normal sinus rhythms from control subjects, characterized by regular P waves, standard QRS complexes, and consistent intervals. Panels (e-m) illustrate various pathological arrhythmias and morphological abnormalities associated with the cDM model. Key findings include: ST-segment elevation (e, g, h, i) suggesting myocardial injury or ischemia; QRS complex depression or inversion (j, k); supraventricular abnormalities such as an inverted P-wave (l) and a notched P-wave (indicated by a red arrow in g); and a second-degree atrioventricular (AV) block (m) characterized by non-conducted P waves and a slow, irregular rhythm. The recordings highlight the clinical significance of diabetic cardiomyopathy and its impact on cardiac electrical conduction and ventricular repolarization.
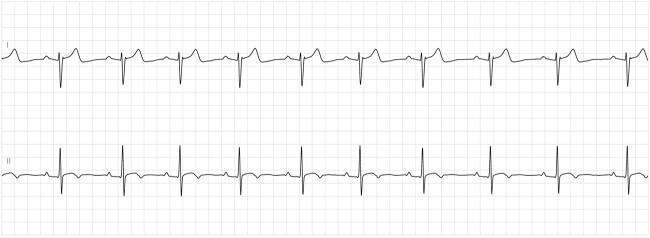
This diagnostic image displays a two-lead electrocardiogram (ECG) rhythm strip, likely from a Holter monitor, showing a regular sinus rhythm. The top tracing (Lead I) and bottom tracing (Lead II) demonstrate consistent PQRST morphology across a standard grid background. Each cardiac cycle consists of a visible P wave preceding a narrow QRS complex, followed by a symmetric T wave. The R-R intervals are regular, indicating a stable heart rate and rhythm. Clinically, this image serves as an educational example of normalized electrical conduction after recovery from high-grade atrioventricular block, specifically in the context of Lyme carditis treatment. The lack of PR prolongation or dropped beats highlights the resolution of the conduction delay. Key educational features include the 1:1 atrioventricular relationship and the absence of morphological abnormalities in the repolarization phase (T waves), confirming clinical stability upon discharge.
A clean medical education infographic titled "HOW TO LEARN ECG - A Systematic Roadmap" designed for medical students. White background, organized into phases with icons and color coding. PHASE 1 (light blue box): "PHASE 1 - UNDERSTAND THE BASICS (Week 1)" - The cardiac conduction system: SA node → AV node → Bundle of His → Left & Right Bundle Branches → Purkinje fibres - What each wave represents: P wave (atrial depolarisation), QRS complex (ventricular depolarisation), T wave (ventricular repolarisation) - Lead placement: 12-lead ECG - 6 limb leads (I, II, III, aVR, aVL, aVF) and 6 precordial leads (V1-V6) - ECG paper: small box = 0.04 sec, large box = 0.2 sec; amplitude 1mm = 0.1mV PHASE 2 (green box): "PHASE 2 - LEARN THE 7-STEP SYSTEMATIC METHOD (Week 2)" List each step: Step 1 - RATE: Count large boxes between R-R intervals. 300/number of large boxes. Normal: 60-100 bpm Step 2 - RHYTHM: Regular or irregular? P before every QRS? QRS after every P? Step 3 - AXIS: Check leads I and aVF. Both up = Normal axis. I up, aVF down = Left axis deviation. I down, aVF up = Right axis deviation Step 4 - P WAVE: Present? Normal morphology? Upright in II, inverted in aVR? Duration <0.12s, height <2.5mm Step 5 - PR INTERVAL: Normal 0.12-0.20 sec (3-5 small boxes). Prolonged = AV block. Short = pre-excitation (WPW) Step 6 - QRS COMPLEX: Normal <0.12 sec (3 small boxes). Wide = BBB or ventricular rhythm. Q waves = old infarction Step 7 - ST SEGMENT & T WAVES: ST elevation = STEMI or pericarditis. ST depression = ischaemia, NSTEMI. T wave inversion = ischaemia. Tall peaked T = hyperkalaemia PHASE 3 (orange box): "PHASE 3 - MASTER KEY PATTERNS (Week 3-4)" Four sub-boxes: ARRHYTHMIAS: AF (irregularly irregular, no P waves), VT (wide complex tachycardia), SVT (narrow complex tachycardia), Heart blocks (1st/2nd/3rd degree), Sinus bradycardia/tachycardia ISCHAEMIA/INFARCTION: STEMI territories - Inferior (II,III,aVF → RCA), Anterior (V1-V4 → LAD), Lateral (I,aVL,V5-V6 → LCx), Universal (all leads → LAD or aortic) BUNDLE BRANCH BLOCKS: RBBB - 'RSR' in V1 (M pattern), wide S in V5/V6. LBBB - broad notched R in V5/V6, no septal Q waves. Mnemonic: "WiLLiaM MaRRoW" ELECTROLYTE & OTHER: Hyperkalaemia (peaked T, wide QRS, sine wave), Hypokalaemia (flat T, U waves), Long QT syndrome, Digoxin effect (reverse tick/scooped ST) PHASE 4 (purple box): "PHASE 4 - PRACTICE (Ongoing)" - Read 5-10 ECGs daily - Use: ECG Wave-Maven (online free), LITFL ECG Library, 150 ECG Cases by Hampton - See actual patient ECGs in clinical practice - Attend ward rounds with cardiology team - Use spaced repetition apps (Anki ECG decks) BEST BOOKS column (yellow): - 150 ECG Cases - Hampton (beginners, most recommended) - The ECG Made Easy - Hampton (essential basics) - ECG Made Simple - Marriott (intermediate) - Dale Dubin's Rapid Interpretation of EKG's (very visual) - Chou's Electrocardiography in Clinical Practice (advanced) KEY MNEMONICS box (pink): - RATE: 300-150-100-75-60-50 (for 1,2,3,4,5,6 large boxes) - AXIS: "Reach for the AVF" - normal is down-right - BBB: WiLLiaM MaRRoW (LBBB: W in V1, M in V6; RBBB: M in V1, W in V6) - STEMI location: "I Look At Inferior" (I,aVL = lateral; II,III,aVF = inferior; V1-V4 = anterior) - AV blocks: "Longer Longer Longer Drop - then you have a Wenckebach" (Mobitz I) Professional infographic style, clean, readable, color coded phases.
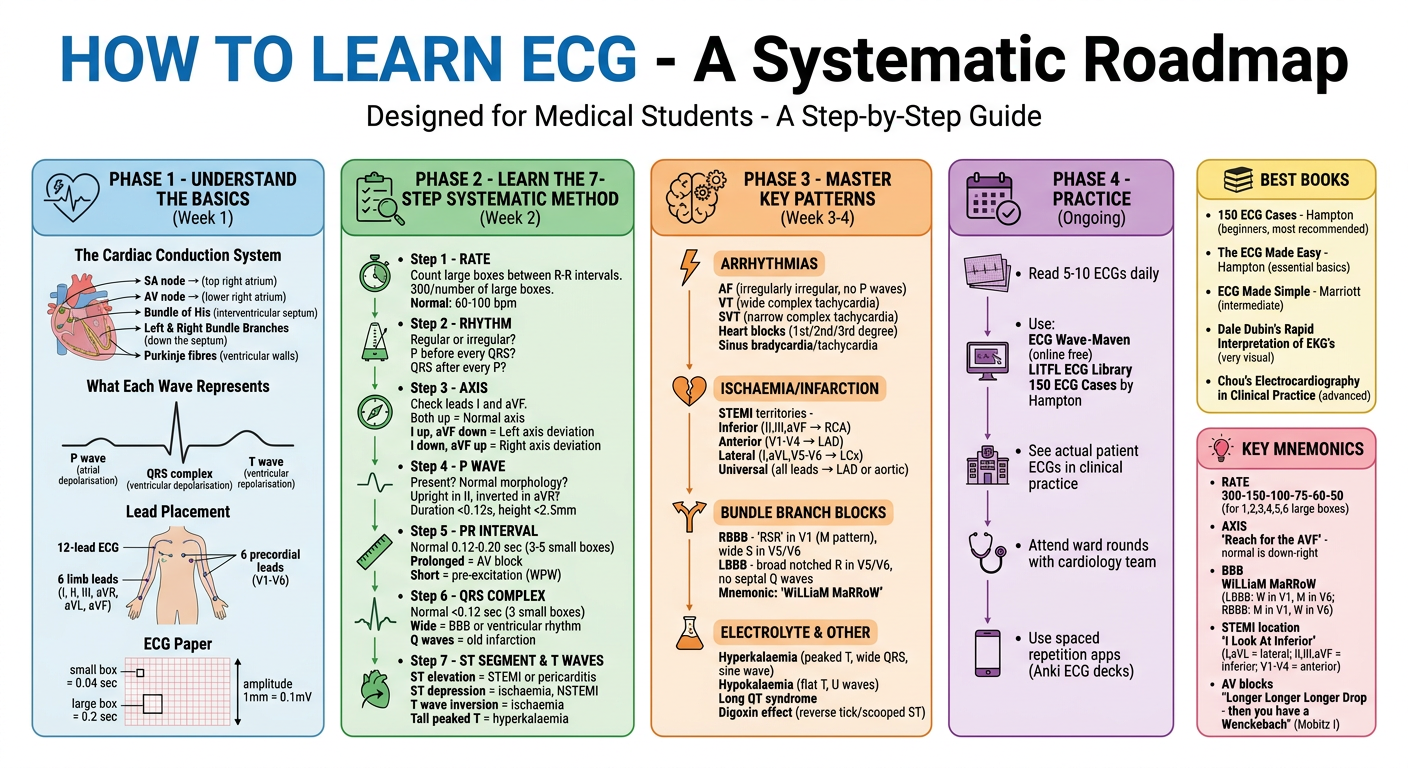
HOW TO LEARN ECG - Complete Guide
PHASE 1 - Understand the Basics (Week 1)
SA Node → AV Node → Bundle of His
       → Left Bundle Branch → Left ventricle
       → Right Bundle Branch → Right ventricle → Purkinje fibres
| Wave | Represents |
|---|---|
| P wave | Atrial depolarisation |
| PR interval | AV nodal conduction delay |
| QRS complex | Ventricular depolarisation |
| ST segment | Ventricular plateau phase |
| T wave | Ventricular repolarisation |
| U wave | Purkinje repolarisation (or hypokalaemia) |
- Small box = 0.04 sec (1 mm)
- Large box = 0.20 sec (5 mm)
- 1 mm vertically = 0.1 mV
PHASE 2 - The 7-Step Systematic Method (Week 2)
- Regular rhythm: 300 ÷ number of large boxes between R-R waves
- Quick scale: 300 → 150 → 100 → 75 → 60 → 50 (for 1 → 6 boxes)
- Irregular rhythm: count QRS complexes in a 10-second strip × 6
- Normal: 60-100 bpm
- Is it regular or irregular?
- Is there a P before every QRS?
- Is there a QRS after every P?
- "Irregularly irregular" with no P waves = Atrial Fibrillation
| Lead I | aVF | Axis |
|---|---|---|
| Upright | Upright | Normal (-30° to +90°) |
| Upright | Inverted | Left Axis Deviation (LAD) |
| Inverted | Upright | Right Axis Deviation (RAD) |
| Inverted | Inverted | Extreme axis ("Northwest") |
- Normal: upright in II, inverted in aVR, biphasic in V1
- Duration <0.12 sec, amplitude <2.5 mm in II
- Tall peaked P (P pulmonale) = RAE
- Broad notched P (P mitrale) = LAE
- Normal: 0.12-0.20 sec (3-5 small boxes)
- Prolonged (>0.20 sec) = 1st degree AV block
- Short (<0.12 sec) = pre-excitation (WPW - look for delta waves)
- Normal width: <0.12 sec (3 small boxes)
- Wide QRS (>0.12 sec) = Bundle branch block, ventricular rhythm, hyperkalaemia
- Q waves (>1 small box wide, >25% QRS height): pathological = old MI
- R wave progression: should increase V1→V5/V6 (poor R progression = anterior MI)
| Finding | Cause |
|---|---|
| ST elevation (>1mm limb leads, >2mm chest) | STEMI, pericarditis, Brugada, LV aneurysm |
| ST depression | NSTEMI, subendocardial ischaemia, digoxin |
| T wave inversion | Ischaemia, strain, PE (right heart strain) |
| Tall peaked T waves | Hyperkalaemia (early), hyperacute STEMI |
| Prolonged QTc (>440ms men, >460ms women) | Drugs, hypokalaemia, hypomagnesaemia, congenital |
PHASE 3 - Master Key Patterns (Week 3-4)
STEMI Localisation
| Territory | Leads | Artery |
|---|---|---|
| Inferior | II, III, aVF | RCA (90%) |
| Anterior | V1-V4 | LAD |
| Lateral | I, aVL, V5-V6 | LCx |
| Posterior | Reciprocal ST depression V1-V3 (tall R + ST↓) | RCA or LCx |
| Right ventricle | V4R (do RV leads!) | Proximal RCA |
Bundle Branch Blocks - Mnemonic: "WiLLiaM MaRRoW"
- LBBB: W shape in V1, M shape in V6 → broad notched R in V5/V6, no septal Q
- RBBB: M shape (RSR') in V1, W shape in V6 → 'bunny ears' in V1, wide S in V6
LBBB in a new chest pain patient = treat as STEMI equivalent (Sgarbossa criteria)
Key Arrhythmias
| Arrhythmia | Key Features |
|---|---|
| AF | Irregularly irregular, no P waves, fibrillatory baseline |
| Atrial flutter | Regular 'sawtooth' flutter waves at 300 bpm, 2:1 or 3:1 block |
| SVT | Narrow complex, regular, rate 150-250, retrograde/no P |
| VT | Wide complex, regular, rate >100, AV dissociation |
| VF | Chaotic irregular, no recognisable complexes - resuscitate immediately |
| 1st degree AV block | Long PR (>0.20 sec), all P waves conducted |
| Mobitz I (Wenckebach) | PR gets progressively longer then a QRS drops - "Longer, Longer, Longer, Drop" |
| Mobitz II | Fixed PR interval, sudden dropped QRS - can progress to complete block |
| 3rd degree (complete) | P and QRS completely independent, ventricular escape rhythm |
PHASE 4 - Practice Strategy
- Read 5-10 ECGs every day - even 10 minutes a day builds pattern recognition faster than 2-hour sessions once a week
- LITFL ECG Library - huge, free, clinical cases
- ECG Wave-Maven (Harvard) - 300+ interactive cases
- ECGMadeSimple.ca - structured free videos
BEST BOOKS (in order of difficulty)
| Book | Level | Why |
|---|---|---|
| The ECG Made Easy - Hampton | Absolute beginner | Most popular starter, very visual, short |
| Dale Dubin's Rapid Interpretation of EKGs | Beginner | Programmed learning, extremely visual |
| 150 ECG Cases - Hampton | Intermediate | Best practice book, clinical scenarios |
| Making Sense of the ECG - Houghton | Intermediate | Clear, systematic, great explanations |
| Chou's Electrocardiography in Clinical Practice | Advanced | Reference standard for cardiologists |
KEY MNEMONICS
- Rate scale: 300 - 150 - 100 - 75 - 60 - 50 (large boxes 1→6)
- Axis: "Lead I and aVF - both up = normal, I up aVF down = Left"
- BBB: WiLLiaM MaRRoW (V1/V6 shapes)
- Wenckebach: "Longer, Longer, Longer, Drop - then you have a Wenckebach"
- STEMI territories: "I Look At Inferior" - I, aVL = lateral; II, III, aVF = inferior; V1-V4 = anterior
- Hyperkalaemia sequence: peaked T → wide QRS → flat P → sine wave → VF
REALISTIC LEARNING TIMELINE
| Week | Goal |
|---|---|
| 1 | Understand waves, intervals, lead placement, paper speed |
| 2 | Master the 7-step method on normal ECGs |
| 3-4 | Learn arrhythmias (AF, heart blocks, SVT, VT) |
| 5-6 | STEMI territories, NSTEMI, BBBs |
| 7-8 | Electrolyte changes, LVH, RVH, PE pattern, pericarditis |
| Ongoing | Practice 5-10 ECGs/day + Anki spaced repetition |
The single most important thing: always use a systematic method, on every ECG, without shortcuts. Pattern recognition only becomes reliable after a systematic framework is solid.
Where exactly ecg leads place
ECG electrode lead placement position chest precordial limb leads diagram
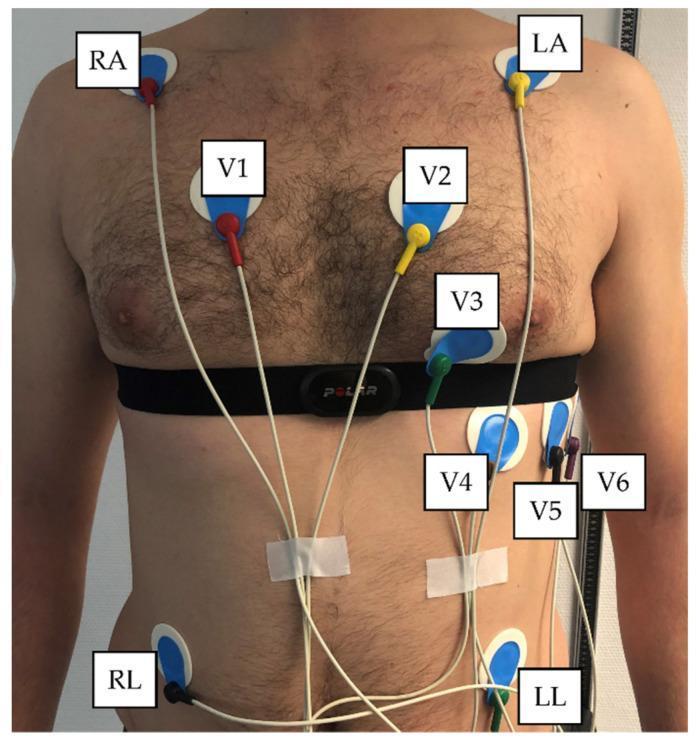
This procedural clinical photograph demonstrates the concurrent placement of a standard 12-lead electrocardiogram (ECG) and a Polar H10 heart rate sensor chest strap on a male subject. The image illustrates proper anatomical positioning for clinical and exercise physiology monitoring. The six precordial leads (V1-V6) are visible across the chest: V1 (4th intercostal space, right sternal border), V2 (4th intercostal space, left sternal border), V3 (midway between V2 and V4), V4 (5th intercostal space, mid-clavicular line), V5 (anterior axillary line), and V6 (mid-axillary line). The leads utilize standard color-coding (Red, Yellow, Green, Brown, Black, Violet). Limb leads are positioned at the shoulders (RA/LA) and the lower ribcage/abdominal area (RL/LL) to facilitate movement during testing. The Polar H10 chest strap is situated inferior to the pectoral muscles, intersecting the mid-precordial electrode line. This visual serves as an educational reference for electrode application in comparative heart rate variability (HRV) studies, highlighting the spatial relationship between traditional medical grade ECG sensors and wearable consumer fitness technology.
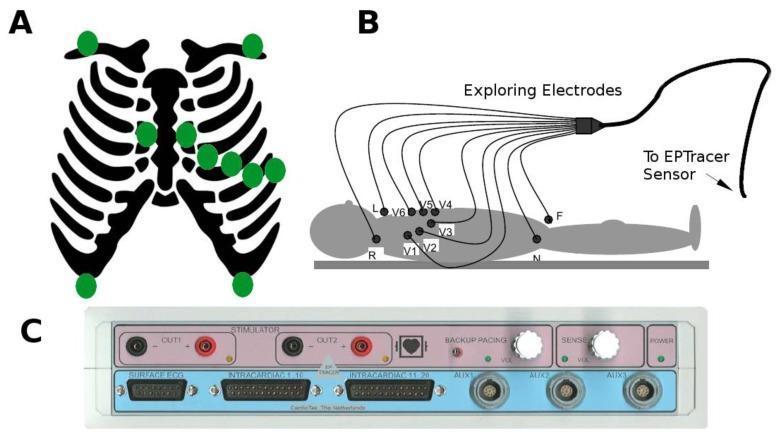
This composite educational graphic illustrates the configuration and hardware for electrocardiogram (ECG) recording. Panel A is an anatomical diagram showing the skeletal thorax with green markers indicating standard electrode placement sites, including the precordial and limb leads. Panel B presents a schematic of a human subject in the supine position, detailing the connection of exploring electrodes (labeled R, L, F, N, and V1–V6) to an EPTracer sensor system. This panel demonstrates the standardized 12-lead ECG nomenclature and the spatial distribution of chest and limb leads used to calculate potential differences against the Wilson central terminal. Panel C is a clinical photograph of the EPTracer sensor front panel, a specialized electrophysiological measurement device. The panel displays various interfaces including stimulator outputs (OUT1, OUT2), specialized ports for surface ECG and intracardiac signal acquisition, and auxiliary inputs. Control knobs for backup pacing and sensing parameters are also visible, highlighting the device's capability for both diagnostic recording and therapeutic cardiac pacing in clinical or experimental electrophysiology environments.
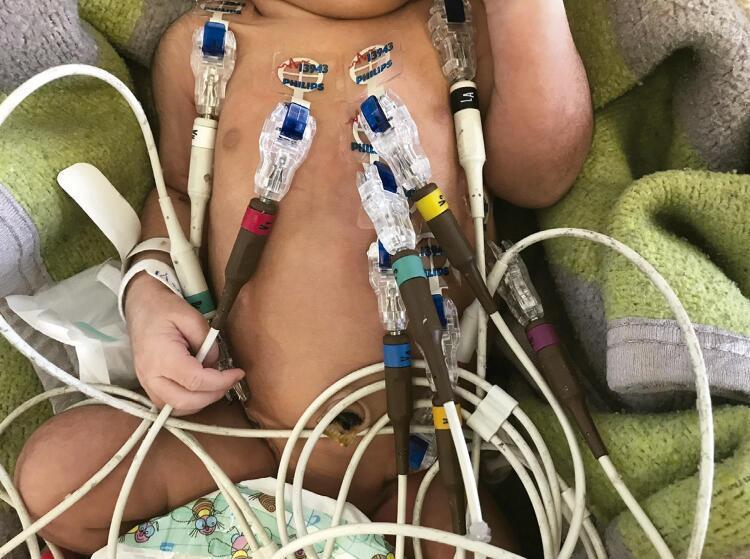
A clinical photograph illustrating the standardized placement of a 12-lead electrocardiogram (ECG) on a neonate. The image shows several electrodes secured to the newborn's skin using clear adhesive gel tabs (Philips brand). The electrode distribution follows neonatology guidelines to minimize motion artifacts: the four limb leads are positioned on the right and left shoulders and the right and left iliac crests, rather than the distal extremities. The precordial leads (V1-V6) are arranged across the anterior chest wall. Each electrode consists of a transparent plastic clip housing, a tapered brown connector with color-coded bands (including red, yellow, green, blue, and purple) for lead identification, and white cabling. The clinical context demonstrates the procedural adaptations required for neonatal cardiac monitoring, such as using torso placement for limb leads to improve signal-to-noise ratio in active infants.
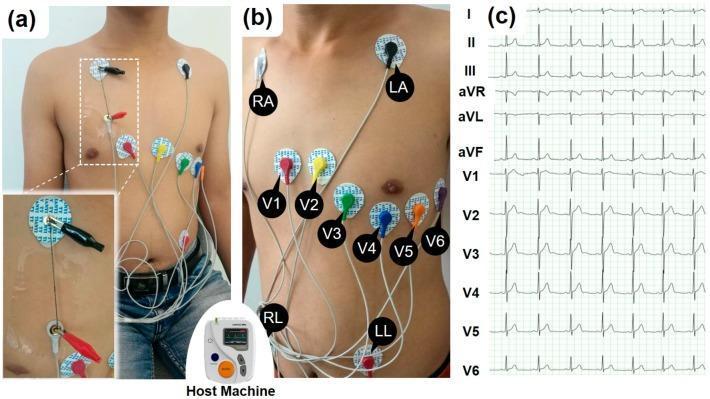
This composite educational graphic illustrates the procedural setup and resulting data for a standard 12-lead electrocardiogram (ECG/EKG). Panels (a) and (b) are clinical photographs demonstrating correct electrode placement on a male torso. The limb leads are positioned as RA (right arm/shoulder) and LA (left arm/shoulder) on the upper chest, with RL (right leg) and LL (left leg) on the lower abdomen. The precordial leads (V1-V6) follow the standard anatomical arc across the chest: V1 and V2 at the fourth intercostal space (right and left of the sternum), V4 at the fifth intercostal space (mid-clavicular line), and V3, V5, and V6 completing the transverse sequence toward the left axilla. Panel (a) includes an inset showing the experimental use of conductive carbon nanotube yarns (SWNT-CYs) connected via alligator clips to the electrodes. Panel (c) displays the resulting 12-lead ECG waveforms on a standard grid, labeled I, II, III, aVR, aVL, aVF, and V1-V6. Each lead shows distinct P-waves, QRS complexes, and T-waves, representing different electrical vectors of cardiac depolarization and repolarization.
A detailed medical education diagram titled "12-LEAD ECG - Exact Electrode Placement" on a white background. Show a front-view anatomical illustration of a human torso with ribs visible and clear anatomical landmarks (clavicle, sternum, ribs numbered 1-6, intercostal spaces, midclavicular line, anterior axillary line, midaxillary line). PRECORDIAL (CHEST) LEADS - show colored circles at exact positions: V1 - RED circle - "4th intercostal space, RIGHT sternal border" V2 - YELLOW circle - "4th intercostal space, LEFT sternal border" V3 - GREEN circle - "Between V2 and V4 (halfway, on 5th rib)" V4 - BLUE circle - "5th intercostal space, MIDCLAVICULAR line (apex of heart)" V5 - ORANGE circle - "Same horizontal level as V4, ANTERIOR AXILLARY line" V6 - PURPLE circle - "Same horizontal level as V4 and V5, MIDAXILLARY line" Show dashed horizontal line connecting V4, V5, V6 to show they are at the same level. LIMB LEADS - shown at corners with colored labels: RA (Right Arm) - RED - right forearm/wrist, or right shoulder if modified LA (Left Arm) - YELLOW - left forearm/wrist, or left shoulder if modified RL (Right Leg) - BLACK/GREEN - right lower leg/ankle (NEUTRAL/GROUND electrode) LL (Left Leg) - GREEN/RED - left lower leg/ankle Show a SEPARATE box on the right side listing: "LIMB LEADS GENERATED:" Lead I = LA - RA (measures lateral) Lead II = LL - RA (longest axis, used for rhythm) Lead III = LL - LA aVR = Augmented Right Arm aVL = Augmented Left Arm aVF = Augmented Foot (Left Leg) Include a small inset showing HOW TO FIND 4th ICS: "Step 1: Feel the sternal notch (top of sternum)" "Step 2: Move down to sternal angle of Louis (junction of manubrium and body) = 2nd rib" "Step 3: Count down: 2nd → 3rd → 4th intercostal space" "Step 4: V1 is just to the RIGHT of sternum at 4th ICS" "Step 5: V2 is just to the LEFT of sternum at 4th ICS" Color coding key at bottom: V1=Red, V2=Yellow, V3=Green, V4=Blue/Brown, V5=Orange/Black, V6=Purple/Violet. Note: "Standard AHA color coding may vary by country" Add a warning box: "COMMON ERRORS: V1/V2 placed too high (most common mistake) | V4-V6 not on same horizontal level | Limb leads on trunk instead of limbs (causes artefact)" Clean anatomical diagram, clear labels with lines pointing to each electrode, professional medical illustration style.
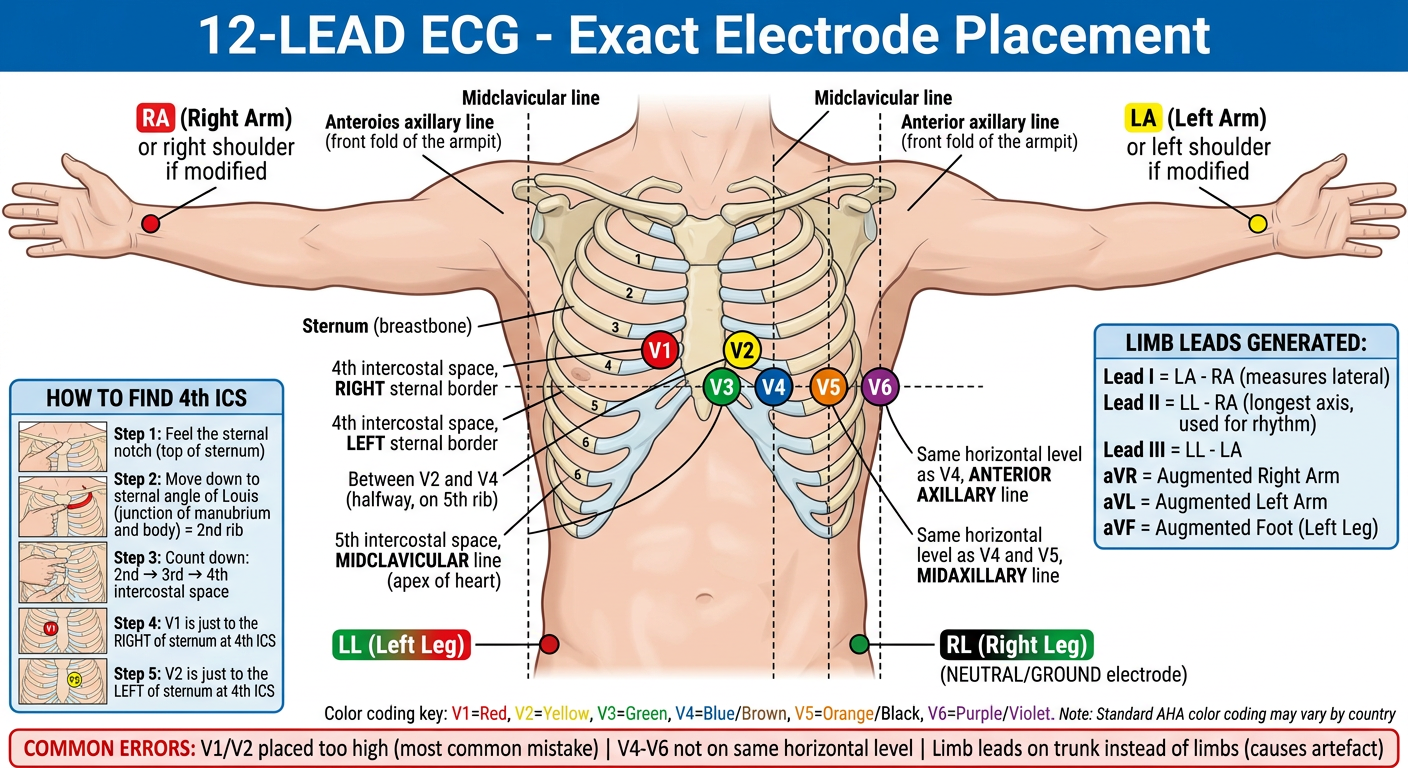
12-LEAD ECG - Exact Electrode Positions
PRECORDIAL (CHEST) LEADS - 6 Electrodes
| Lead | Exact Position | Landmark |
|---|---|---|
| V1 | 4th intercostal space, RIGHT sternal border | Just right of sternum |
| V2 | 4th intercostal space, LEFT sternal border | Just left of sternum |
| V3 | Between V2 and V4 (diagonal, on 5th rib) | Halfway point |
| V4 | 5th intercostal space, midclavicular line | Apex of heart |
| V5 | Same horizontal level as V4, anterior axillary line | Same height as V4 |
| V6 | Same horizontal level as V4 & V5, midaxillary line | Same height as V4 |
Critical rule: V4, V5, and V6 must all be on the same horizontal level. Many students incorrectly angle V5/V6 upward.
HOW TO FIND THE 4TH INTERCOSTAL SPACE (step by step)
1. Place finger on the STERNAL NOTCH (top of manubrium)
2. Slide DOWN to the STERNAL ANGLE (Angle of Louis)
   → This is the bump where manubrium meets the sternal body
   → The 2nd rib attaches here
3. From 2nd rib, count DOWN:
   - Between 2nd and 3rd rib = 2nd ICS
   - Between 3rd and 4th rib = 3rd ICS
   - Between 4th and 5th rib = 4th ICS ← place V1 and V2 here
4. V1 = RIGHT of sternum at 4th ICS
5. V2 = LEFT of sternum at 4th ICS
6. V4 = drop to 5th ICS, follow midclavicular line (below nipple level)
LIMB LEADS - 4 Electrodes
| Lead | Position | Colour (IEC) | Colour (AHA) |
|---|---|---|---|
| RA (Right Arm) | Right wrist / right forearm | Red | White |
| LA (Left Arm) | Left wrist / left forearm | Yellow | Black |
| RL (Right Leg) | Right ankle / right lower leg | Black | Green |
| LL (Left Leg) | Left ankle / left lower leg | Green | Red |
RL (right leg) is the ground/neutral electrode - it does not record, it just reduces interference.
What the Limb Leads Actually Measure
| Lead | Calculation | Direction it "looks" |
|---|---|---|
| Lead I | LA - RA | Horizontal (left) |
| Lead II | LL - RA | Inferolateral (longest axis, used for rhythm strips) |
| Lead III | LL - LA | Inferior |
| aVR | Augmented Right Arm | Toward right shoulder (normally negative) |
| aVL | Augmented Left Arm | Toward left shoulder |
| aVF | Augmented Left Foot (LL) | Straight down (inferior) |
MODIFIED PLACEMENT (for ambulatory/exercise/ICU monitoring)
- RA → right infraclavicular area (below right collarbone)
- LA → left infraclavicular area (below left collarbone)
- RL → right lower thorax / right iliac crest
- LL → left lower thorax / left iliac crest
This is called Mason-Likar placement - used in exercise ECGs and continuous monitoring. Note: it changes the axis slightly and is not ideal for diagnosing MI.
COMMON MISTAKES TO AVOID
| Mistake | Effect on ECG |
|---|---|
| V1/V2 placed too high (most common) | Pseudo-RBBB, false Q waves, rS in V1 looks different |
| V4-V6 not on the same horizontal level | Poor R-wave progression, false findings |
| V3/V4 placed too far left or right | Poor septal lead accuracy |
| Limb leads reversed (RA/LA swapped) | Lead I inverts; aVR looks like aVL - looks like dextrocardia |
| Electrodes on bony prominences | Muscle artefact, poor contact |
| Chest hair not managed | Poor electrode contact → noisy baseline |
Quick check for limb lead reversal: If Lead I is entirely negative and aVR looks positive - suspect RA/LA swap (or true dextrocardia).
ADDITIONAL LEADS (Special Situations)
| Extra Leads | Position | Used For |
|---|---|---|
| V4R | Mirror of V4 on right side (5th ICS, right midclavicular line) | Right ventricular MI (inferior STEMI with RV involvement) |
| V7 | Posterior axillary line, same level as V4-V6 | Posterior MI |
| V8 | Mid-scapular line, same level | Posterior MI |
| V9 | Left paraspinal region, same level | Posterior MI |
Always do right-sided leads (V4R) when you see an inferior STEMI - RV involvement changes management (avoid nitrates, give IV fluids).