
Explain the structure and function of respiratory system
respiratory system anatomy diagram lungs airways
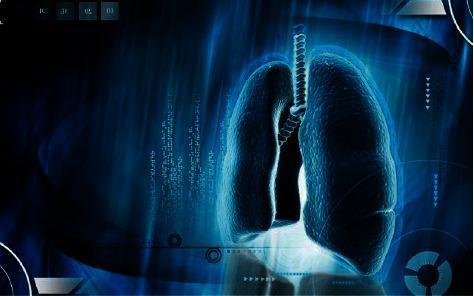
This medical illustration is a stylized 3D anatomical diagram of the human respiratory system, focusing on the lungs and trachea. The central feature is a pair of symmetrically positioned lungs with a granulated, textured surface that evokes the presence of pulmonary parenchyma and alveoli. Connecting them at the superior midline is the trachea, depicted with visible horizontal ridges representing cartilaginous rings. The image utilizes a cool, high-contrast blue color palette with digital overlays—including binary code patterns and circular UI elements—to establish a clinical and technological aesthetic. This infographic-style visual represents the intersection of pulmonology and advanced diagnostic technology, specifically the application of deep learning algorithms and artificial intelligence in lung cancer imaging and nodule detection. The educational focus is on visualizing thoracic anatomy within the context of computer-aided diagnosis (CAD) and medical informatics.
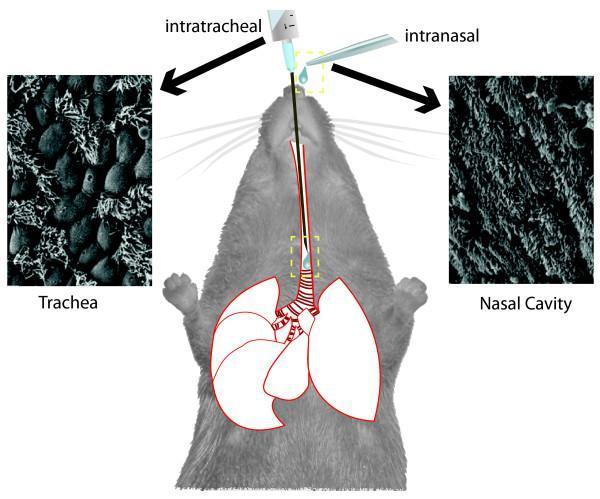
This composite educational diagram illustrates experimental lung infection models using a mouse subject, comparing intranasal and intratracheal administration routes. The central anatomical diagram depicts a mouse with highlighted respiratory structures, including the upper airways, trachea, and lungs. To the left, a Scanning Electron Microscopy (SEM) image labeled 'Trachea' displays the respiratory epithelium of the conducting airways, characterized by prominent dome-shaped cells and ciliated structures. To the right, a corresponding SEM image labeled 'Nasal Cavity' shows the dense, highly convoluted surface of the upper respiratory tract. The diagram uses arrows to indicate the entry points for each method: 'intranasal' via a pipette at the nasal opening and 'intratracheal' via a catheter-based delivery directly into the trachea, bypassing the upper airway's primary immune defenses. This illustration serves to demonstrate how the inoculation route influences the deposition of pathogens (like Pseudomonas aeruginosa) within the distal versus proximal airways, particularly relevant in cystic fibrosis (CF) research and mucociliary clearance studies.
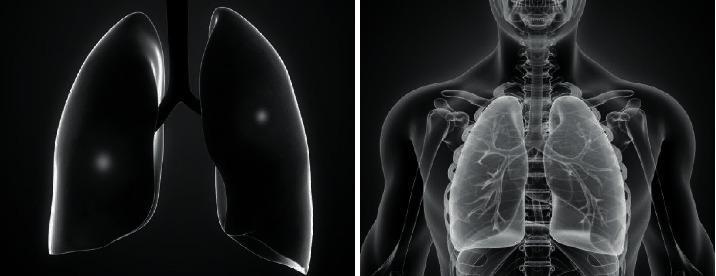
A dual-panel medical illustration titled 'Pathological diagram of severe pneumonia' providing a comparative anatomical view of the human respiratory system. The left panel shows an isolated 3D anatomical model of the lungs and trachea against a black background. The lung surfaces appear smooth and dark, with subtle highlights suggesting three-dimensional volume and lobar structure. The right panel displays the lungs integrated into a full-body sagittal-view silhouette of a human torso. This panel reveals the internal architecture of the respiratory tree, including the branching patterns of the bronchi and bronchioles within the lung parenchyma. The skeletal framework, including the rib cage, clavicles, and vertebral column, is visible as a translucent overlay. This educational visual is designed to demonstrate the relationship between external lung morphology and internal airway distribution, specifically contextualizing the sites of parenchymal inflammation and consolidation typical in severe pneumonia cases for medical students and clinical trainees.
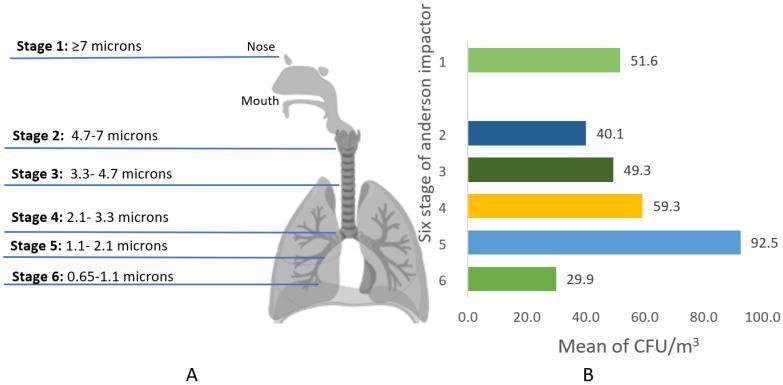
Educational infographic and comparison chart regarding airborne bacteria deposition. Panel A features a pathophysiology diagram showing a schematic of the human respiratory system, including the nose, mouth, trachea, and lungs. It correlates six stages of the Andersen cascade impactor with specific aerodynamic particle size ranges and their corresponding anatomical deposition sites. Stage 1 (≥7.0 µm) corresponds to the nose; Stages 2–6 (ranging from 7.0 µm down to 0.65 µm) track progression from the upper airways deep into the alveolar regions of the lungs. Panel B is a horizontal bar graph illustrating the mean indoor total air bacterial concentrations (CFU/m³) categorized by the same six Andersen impactor stages. The graph indicates that the highest mean concentration (92.5 CFU/m³) occurs at Stage 5 (1.1–2.1 µm), highlighting the prevalence of fine, respirable particles in the studied environment. This content is designed for public health or environmental microbiology education, focusing on the relationship between bioaerosol size and human respiratory health risks.
alveoli gas exchange structure capillary
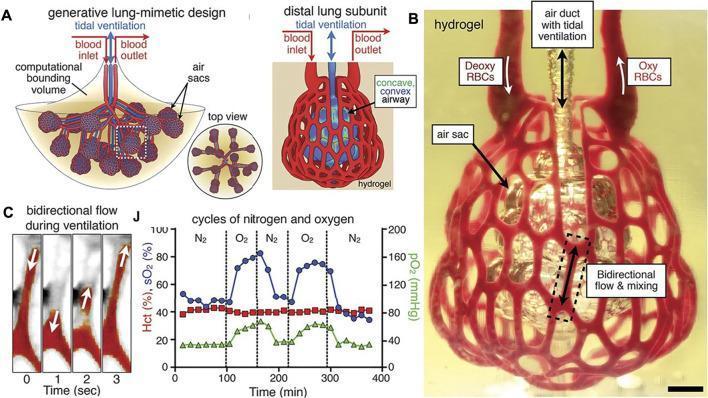
This composite educational image illustrates the 3D bioprinting of lung-mimetic structures for gas exchange studies, specifically mimicking the distal lung subunit. Panel A contains anatomical diagrams of a generative lung-mimetic design, showing air sacs (alveoli) and blood inlets/outlets within a computational bounding volume. Panel B is a clinical photograph of a 3D-printed hydrogel structure created via stereolithography. It features a red, lattice-like framework representing microvascular channels surrounding a central, translucent air sac ventilated by an air duct. Labels indicate the perfusion of deoxygenated (Deoxy) and oxygenated (Oxy) red blood cells (RBCs) through the hydrogel network. Panel C provides a time-series animation frame showing bidirectional flow during tidal ventilation. Panel J is a line graph tracking hematocrit (Hct), oxygen saturation (sO2), and partial pressure of oxygen (pO2) over multiple cycles of nitrogen (N2) and oxygen (O2) ventilation, demonstrating the model's functional gas exchange capacity. This material is used to teach respiratory physiology, tissue engineering, and the development of 3D bioprinted organs.
This image displays a macroscopic clinical photograph of a 3D-printed capillary model designed for biomedical sensing applications. The structure features a distinctive honeycomb-like repeating pattern of interconnected, uniform hexagonal or diamond-shaped cells. This porous architectural arrangement is characteristic of synthetic scaffolds or filtration membranes used in medical engineering to mimic natural capillary beds or to facilitate gas exchange. The overall form factor is semi-circular, suggesting a cross-sectional view of a multi-tier cylindrical column. The small, dark openings represent the individual capillary elements, which are densely packed to maximize the surface-area-to-volume ratio. This design is clinically relevant for studies involving scent-based diagnostic sensors or hemodialysis membrane development, where precise flow control and interaction between a gas or liquid sample and a sensing element are required. The material appears uniform, highlighting advancements in precision medical manufacturing for creating complex anatomical analogues.
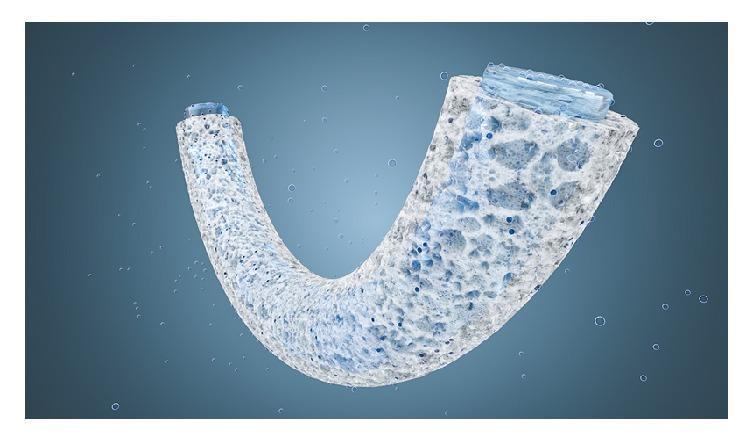
A schematic diagram representing a tubular, U-shaped porous sponge designed for gas-liquid exchange, modeled after physiological systems like lung alveoli or blood vessels. The illustration highlights a high-porosity structural wall with a heterogeneous network of interconnected pores of varying sizes. The sponge material is shown in a light, fiber-like texture, with visible blue-tinted gas bubbles or fluid droplets penetrating and diffusing through the porous walls. Both ends of the tubular structure are sealed with a translucent blue material, suggesting the containment of an inner aqueous solution or reaction channel. The educational focus of this visual is the demonstration of gas diffusion mechanisms across semi-permeable, virtually wall-less containers, applicable in biomedical engineering for respiratory support systems or controlled mineralization studies. The diagram illustrates how the hierarchical pore structure increases surface area for efficient gas-liquid interface reactions while maintaining mechanical stability.
The Respiratory System: Structure and Function
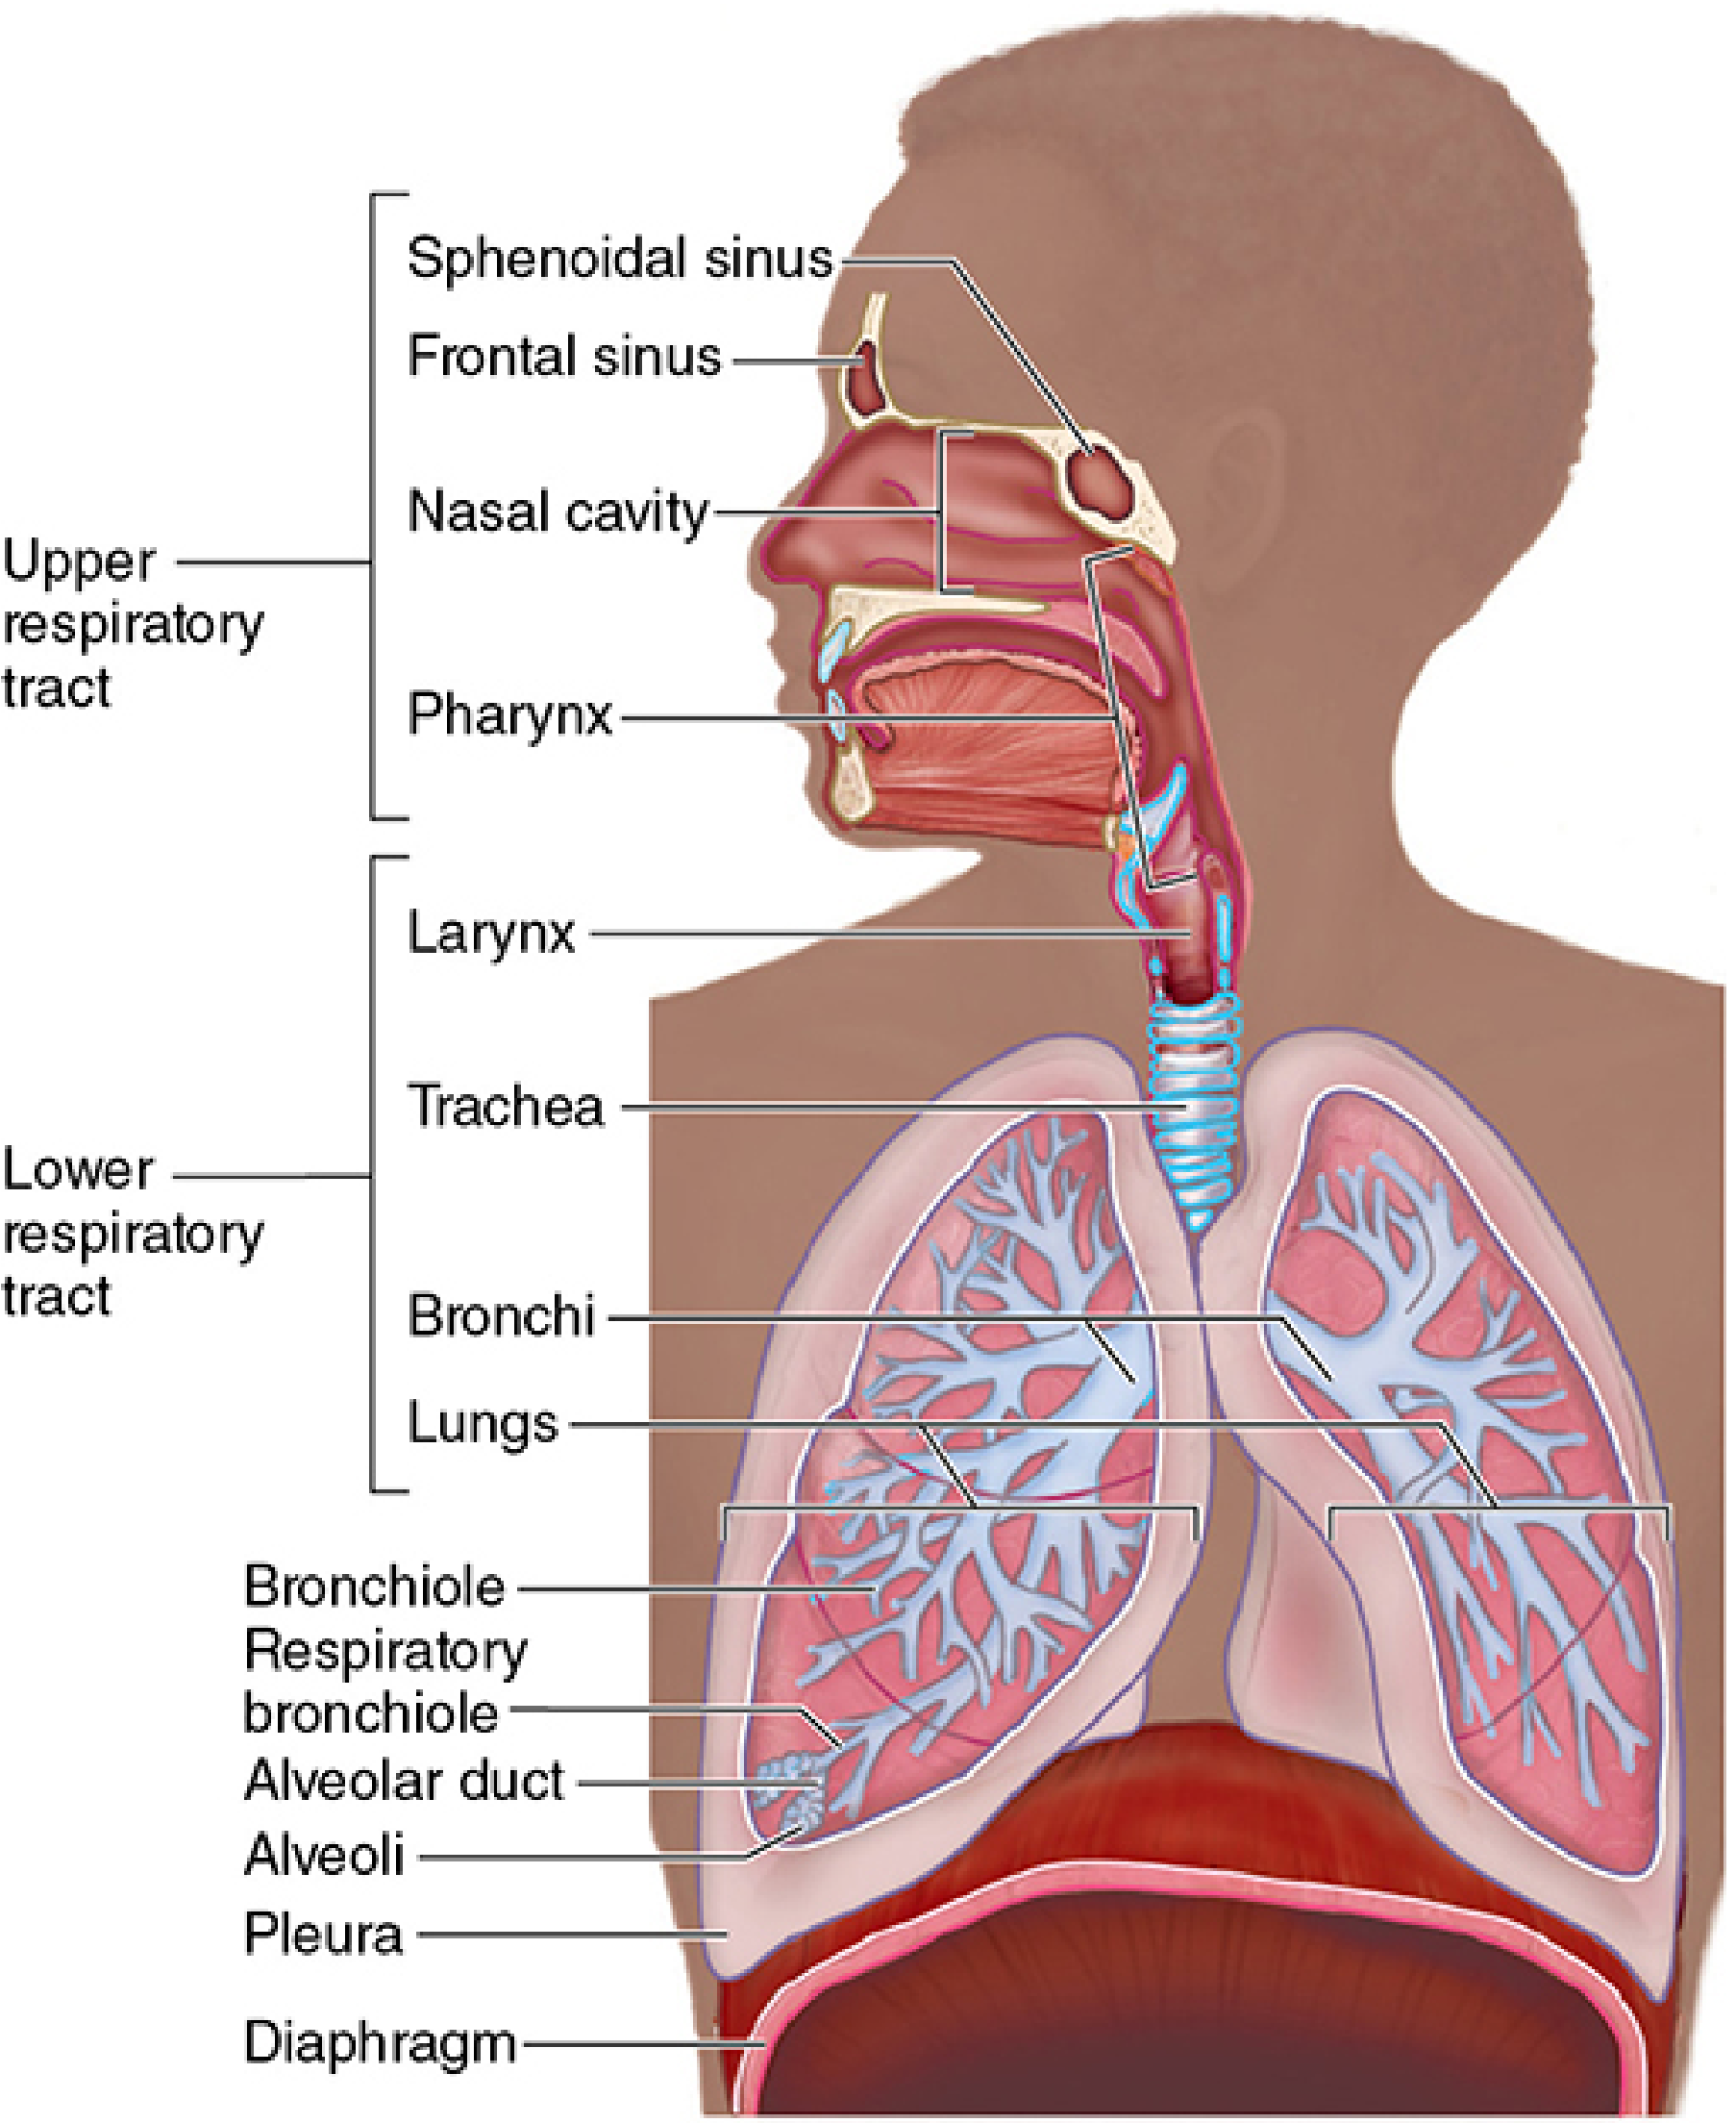
Overview
| Region | Components | Function |
|---|---|---|
| Conducting portion | Nasal cavities, pharynx, larynx, trachea, bronchi, bronchioles, terminal bronchioles | Air conduction, filtration, warming, humidification |
| Respiratory portion | Respiratory bronchioles, alveolar ducts, alveolar sacs, alveoli | Gas exchange (O2/CO2) |
I. Conducting Portion
1. Nasal Cavities
2. Pharynx
- Nasopharynx - posterior to the nasal cavity, contains the pharyngeal tonsil (adenoids) and the openings of the Eustachian tubes
- Oropharynx - posterior to the oral cavity, lined with stratified squamous epithelium (reflecting mechanical stress from food)
- Laryngopharynx - connects to the larynx anteriorly and the esophagus posteriorly
3. Larynx
4. Trachea
- Mucosa: pseudostratified ciliated columnar epithelium + lamina propria with elastic fibers
- Submucosa: loose connective tissue with mucoserous glands
- Cartilaginous rings
- Adventitia: outer connective tissue
5. Bronchi
- Secondary (lobar) bronchi - one per lobe (3 right, 2 left)
- Tertiary (segmental) bronchi - one per bronchopulmonary segment (10 right, 8-10 left)
6. Bronchioles and Terminal Bronchioles
- Secrete surfactant-like proteins and immunoglobulins
- Produce detoxifying enzymes
- Serve as stem cells for bronchiolar epithelial renewal
- Produce CC16 (club cell secretory protein), which has anti-inflammatory functions
II. Respiratory Portion
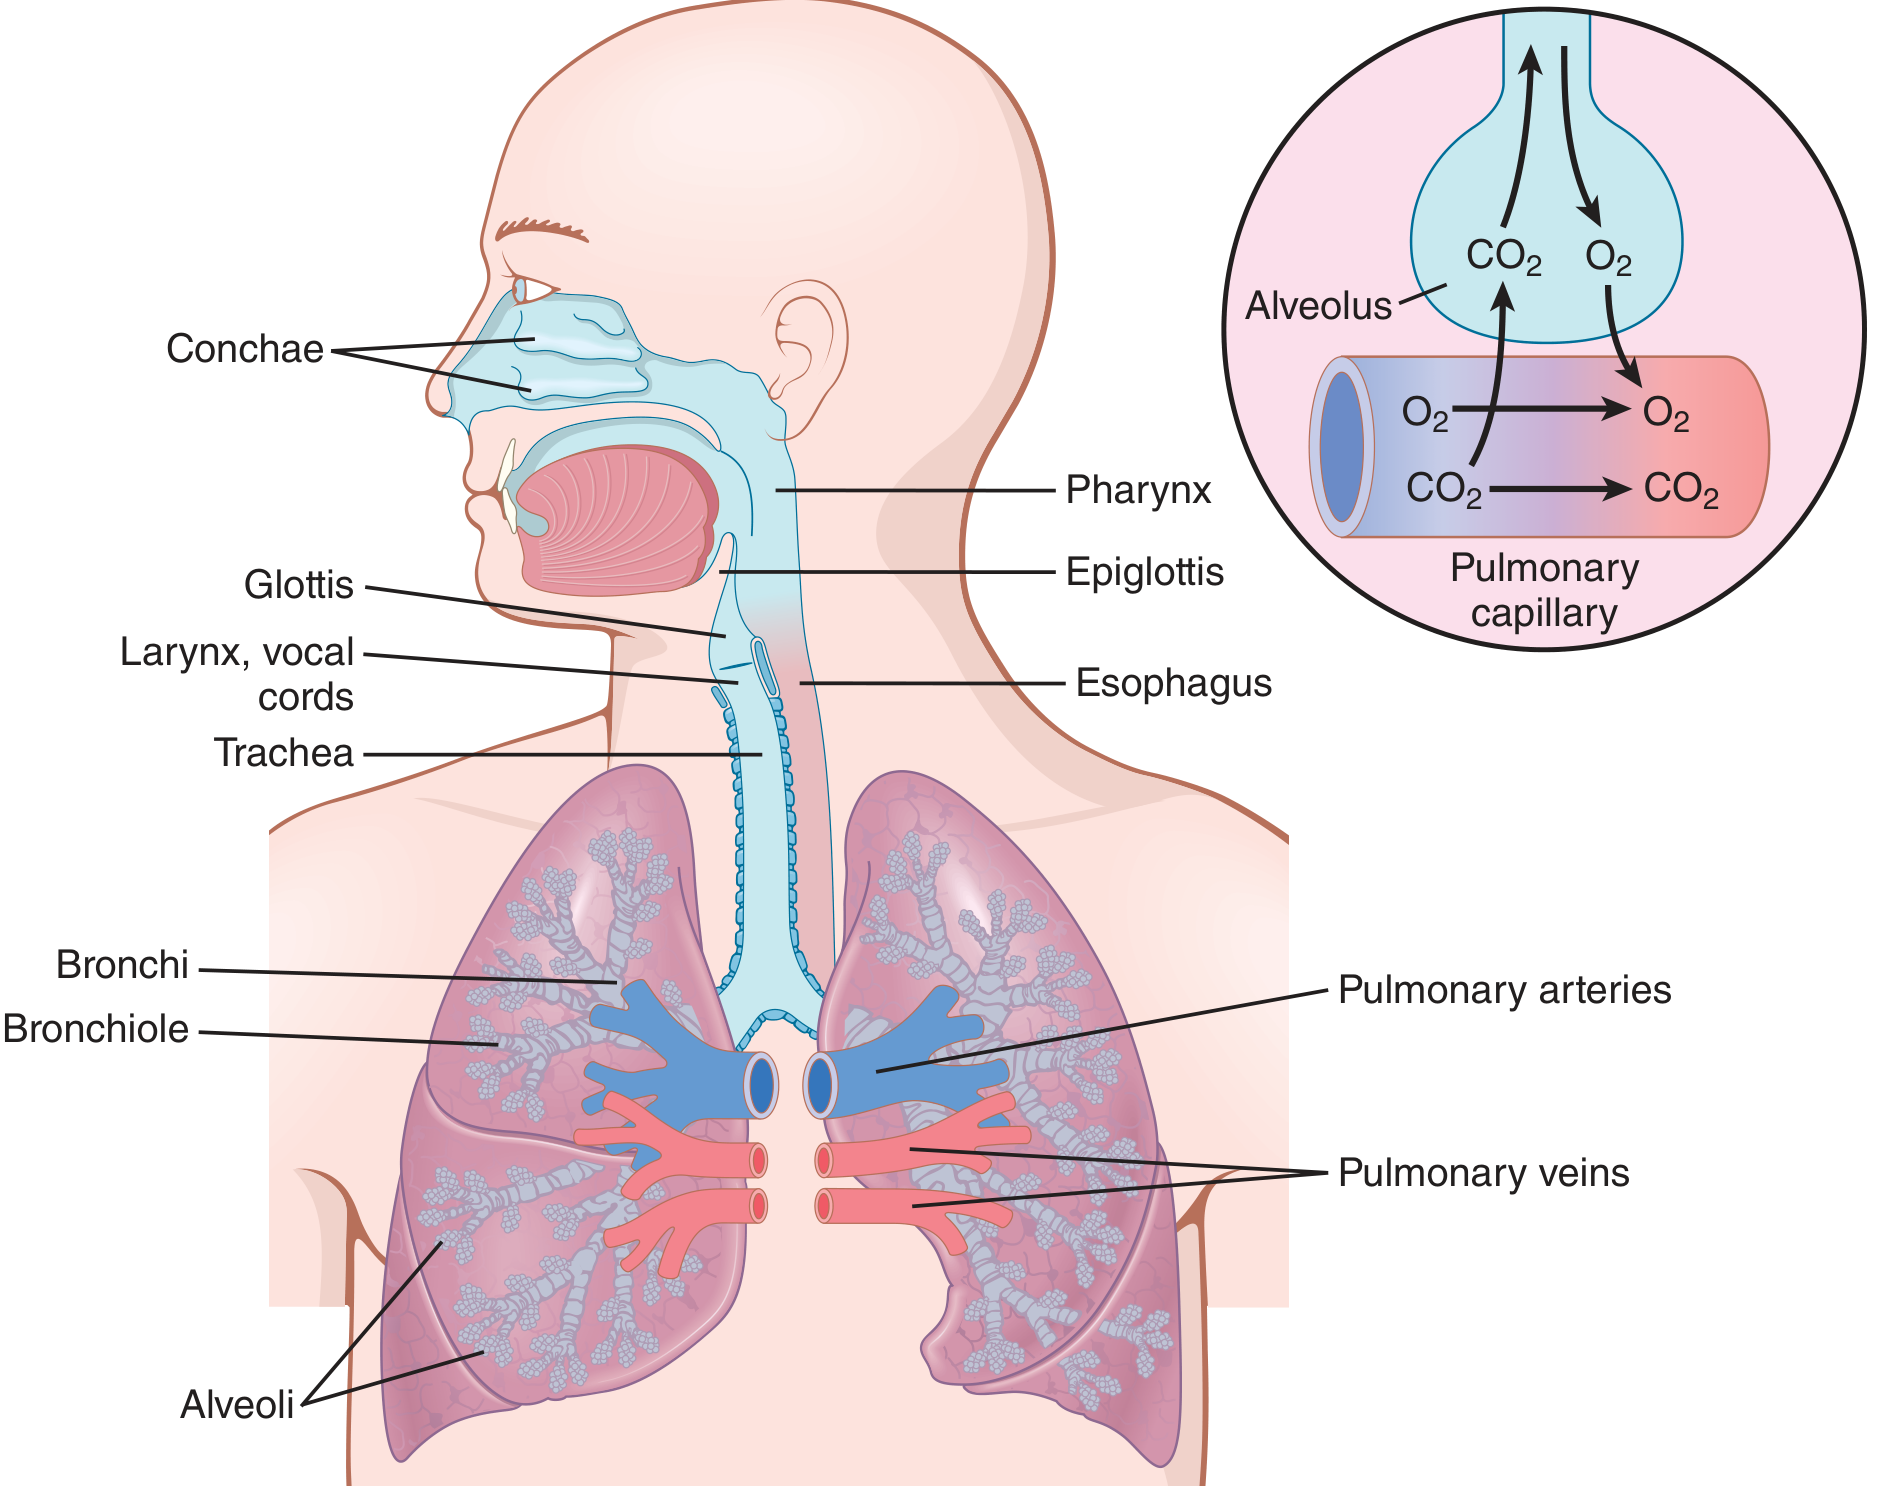
7. Respiratory Bronchioles
8. Alveolar Ducts and Sacs
9. Alveoli - The Gas Exchange Units
| Cell | Description | Function |
|---|---|---|
| Type I pneumocytes | Extremely thin, squamous epithelial cells covering ~95% of alveolar surface | Gas exchange (thin barrier allows diffusion) |
| Type II pneumocytes | Cuboidal cells, ~5% of surface area but 60% of cell count | Produce surfactant (reduces surface tension, prevents collapse); stem cells for Type I regeneration |
| Alveolar macrophages (dust cells) | Free macrophages in alveolar space | Phagocytose inhaled particles, pathogens, and debris |
- Alveolar epithelium (Type I pneumocyte)
- Fused basement membranes
- Pulmonary capillary endothelium
III. The Lungs
- Visceral pleura - adheres directly to the lung
- Parietal pleura - lines the thoracic wall and diaphragm
- Between them is the pleural cavity filled with a thin film of serous fluid (~5-15 mL) that reduces friction and maintains lung adhesion to the chest wall.
IV. Mechanics of Breathing (Ventilation)
- The diaphragm contracts and flattens (the primary muscle - accounts for ~70% of tidal volume)
- External intercostal muscles elevate the ribs and expand the thoracic cage
- Thoracic volume increases → intrapleural pressure falls → lungs expand → alveolar pressure drops below atmospheric → air flows in
- Respiratory muscles relax
- Elastic recoil of lung tissue and chest wall restores volume
- Alveolar pressure rises above atmospheric → air flows out
| Volume/Capacity | Value | Description |
|---|---|---|
| Tidal Volume (TV) | ~500 mL | Air moved per normal breath |
| Inspiratory Reserve Volume | ~3,000 mL | Extra air after normal inspiration |
| Expiratory Reserve Volume | ~1,100 mL | Extra air after normal expiration |
| Residual Volume | ~1,200 mL | Air remaining after maximal expiration |
| Functional Residual Capacity | ~2,300 mL | Air remaining after normal expiration |
| Total Lung Capacity | ~5,800 mL | Total lung volume |
| Vital Capacity | ~4,600 mL | Maximum air moved in one breath |
V. Gas Exchange and Transport
Pulmonary Gas Exchange
| Gas | Alveolar pO2 | Arterial pO2 | Venous pO2 |
|---|---|---|---|
| O2 | ~104 mmHg | ~95 mmHg | ~40 mmHg |
| CO2 | ~40 mmHg | ~40 mmHg | ~45 mmHg |
Oxygen Transport in Blood
- ~98.5% carried bound to hemoglobin as oxyhemoglobin (HbO2)
- ~1.5% dissolved in plasma
CO2 Transport in Blood
- ~70% as bicarbonate (HCO3⁻) in plasma (via carbonic anhydrase in RBCs)
- ~23% bound to hemoglobin as carbaminohemoglobin
- ~7% dissolved in plasma
VI. Control of Breathing
- Dorsal respiratory group (medulla) - drives inspiration
- Ventral respiratory group (medulla) - drives forced expiration
- Pneumotaxic center (pons) - limits inspiration duration
- Apneustic center (pons) - prolongs inspiration
- Central chemoreceptors in the medulla respond to changes in cerebrospinal fluid pH (driven by CO2 levels) - the primary driver of minute-to-minute ventilation
- Peripheral chemoreceptors (carotid and aortic bodies) respond to falling arterial PO2 (<60 mmHg), rising PCO2, and falling pH
VII. Additional Functions
- Immune defense - mucociliary escalator traps particles; IgA, alveolar macrophages, and BALT provide immune surveillance
- Phonation - vocal cord vibration creates voice
- Acid-base regulation - adjusting ventilation rate changes CO2/bicarbonate balance
- Metabolic functions - pulmonary endothelium converts angiotensin I → angiotensin II (via ACE); inactivates bradykinin, serotonin
- Olfaction - olfactory epithelium mediates sense of smell
- Guyton and Hall Textbook of Medical Physiology, 14e
- Junqueira's Basic Histology: Text and Atlas, 17e
- Histology: A Text and Atlas with Correlated Cell and Molecular Biology (Ross & Pawlina)
Can you make it in simple words
Make that simple language without removing the concept the words are difficult to understand i want write notes
The Respiratory System - Simple Notes
What does the Respiratory System do?
- Move air in and out of the body
- Clean and warm the incoming air
- Exchange gases - take in Oxygen (O2) from air and release Carbon Dioxide (CO2) from blood
Two Main Parts
| Part | What's in it | Job |
|---|---|---|
| Conducting Part | Nose, throat, voice box, windpipe, air tubes | Carries air in and cleans it |
| Respiratory Part | Tiny air sacs deep in the lungs | Where actual gas exchange happens |
Part 1 - The Path Air Takes (Conducting Part)
1. Nose (Nasal Cavity)
- Air enters through the nostrils
- Inside the nose there are small hairs (vibrissae) that block dust and large particles
- The walls of the nose are full of blood vessels - these warm and moisten the cold, dry air
- Three shelf-like bones called conchae (turbinates) create swirling air so it contacts the warm walls longer
- The top part of the nose has smell receptors (olfactory cells) - these detect odors
Think of the nose as an air filter + heater + humidifier all in one.
2. Paranasal Sinuses
- Air-filled spaces inside the skull bones (forehead, cheeks)
- They also help humidify air and make the skull lighter
- When they get infected = sinusitis (blocked, painful face)
3. Pharynx (Throat)
- A shared passage for both food and air
- 3 parts: Nasopharynx (behind the nose), Oropharynx (behind the mouth), Laryngopharynx (lower throat)
- The adenoids and tonsils here help fight germs
4. Larynx (Voice Box)
- Made of several pieces of cartilage (firm but flexible tissue)
- Has the vocal cords - two bands that vibrate when air passes through, making sound/voice
- Has the epiglottis - a flap that covers the airway when you swallow, so food doesn't go into the lungs
- When food "goes down the wrong way," the epiglottis didn't close in time
5. Trachea (Windpipe)
- A tube about 10-12 cm long connecting the voice box to the lungs
- Held open by 16-20 C-shaped rings of cartilage - like the rings of a vacuum cleaner hose
- Without these rings, the tube would collapse when you breathe in
- The back of the trachea has a muscle (trachealis) that can slightly narrow the tube
- Inside is lined with cells that have tiny hair-like structures called cilia - these sweep dust and mucus upward toward the throat (like a conveyor belt). This is called the mucociliary escalator
6. Bronchi (Air Tubes Inside the Lungs)
- The trachea splits into 2 main bronchi (one for each lung) at a point called the carina
- Right bronchus is wider and more vertical - that's why swallowed objects usually get stuck on the right side
- Inside each lung, the bronchi keep branching like a tree - getting smaller and smaller:
- Main bronchus → Lobar bronchus (one per lobe) → Segmental bronchus → smaller bronchi
- The large bronchi still have cartilage rings to stay open
- They are lined with mucus-producing cells and cilia to trap and remove germs
7. Bronchioles (Tiny Air Tubes)
- When the tubes get very small (less than 1 mm wide), they become bronchioles
- No cartilage here - instead, they have smooth muscle in their walls
- This smooth muscle can squeeze (constrict) or relax (dilate) to control airflow
- Asthma happens when this muscle squeezes too much, narrowing the tubes and making breathing hard
- The last purely conducting tubes are called terminal bronchioles
- Special cells here called club cells (Clara cells) produce protective secretions and can repair damaged airway cells
Part 2 - Where Gas Exchange Happens (Respiratory Part)
8. Respiratory Bronchioles
- Bronchioles that now have tiny air sacs (alveoli) budding off their walls
- Gas exchange begins here - they both conduct air AND do some exchange
9. Alveolar Ducts and Alveolar Sacs
- Tubes whose walls are almost entirely made of alveoli
- Alveolar sacs = clusters of alveoli at the very end, like a bunch of grapes
10. Alveoli - The Most Important Part ⭐
- Tiny, thin-walled, balloon-like air sacs
- The human lung has about 300-500 million alveoli
- Total surface area = 70-80 square meters (size of a tennis court!) - all packed inside your chest
- Each alveolus is wrapped in a net of tiny blood vessels called pulmonary capillaries
| Cell | Simple Name | Job |
|---|---|---|
| Type I pneumocyte | Thin flat cell | Makes up the wall - allows gas to pass through easily |
| Type II pneumocyte | Round secretory cell | Makes surfactant - a soapy fluid that keeps alveoli from collapsing |
| Alveolar macrophage | Dust cell / Lung cleaner | Eats germs and dust that reach the alveoli |
- Alveolar wall cell (Type I pneumocyte)
- A thin glue layer (basement membrane)
- Capillary wall cell (endothelium)
The Lungs
- Two spongy, cone-shaped organs sitting in the chest
- Right lung - 3 lobes (upper, middle, lower)
- Left lung - 2 lobes (upper, lower) - smaller because the heart takes up space on the left side
- Each lung is covered by a pleura - a double plastic-wrap like membrane with fluid in between
- Inner layer sticks to the lung (visceral pleura)
- Outer layer lines the chest wall (parietal pleura)
- The fluid between them acts like oil, reducing friction during breathing
- When this space fills with air = pneumothorax (collapsed lung); with blood = hemothorax
How We Breathe (Mechanics)
Breathing In (Inspiration)
- The diaphragm (a dome-shaped muscle below the lungs) contracts and moves downward
- The rib muscles (intercostals) pull the ribs upward and outward
- The chest gets bigger → pressure inside drops → air rushes in (like a bellows)
- The diaphragm does about 70% of the work of breathing
Breathing Out (Expiration) - at rest, this is passive
- The diaphragm and rib muscles relax
- The lungs spring back (elastic recoil) like a stretched rubber band
- Chest gets smaller → pressure rises → air is pushed out
Lung Volumes (Good to memorize!)
| Term | Amount | Meaning |
|---|---|---|
| Tidal Volume (TV) | 500 mL | Air in one normal breath |
| Inspiratory Reserve Volume (IRV) | 3,000 mL | Extra air you can breathe IN beyond a normal breath |
| Expiratory Reserve Volume (ERV) | 1,100 mL | Extra air you can push OUT beyond a normal breath |
| Residual Volume (RV) | 1,200 mL | Air left in lungs after maximum breath out (can never be emptied) |
| Vital Capacity (VC) | 4,600 mL | Maximum air you can move in one breath |
| Total Lung Capacity (TLC) | 5,800 mL | Total air lungs can hold |
Gas Exchange - Simple Explanation
- Oxygen moves from the alveoli into the blood (because there's more O2 in air than in blood)
- Carbon dioxide moves from the blood into the alveoli (because there's more CO2 in blood than in air)
- Both move by diffusion - always moving from where there is MORE to where there is LESS
- 98.5% bound to hemoglobin (in red blood cells) as oxyhemoglobin
- 1.5% dissolved directly in blood plasma
- 70% as bicarbonate (HCO3⁻) - converted by an enzyme called carbonic anhydrase inside red blood cells
- 23% attached to hemoglobin as carbaminohemoglobin
- 7% dissolved in plasma
Control of Breathing
| Center | Location | Job |
|---|---|---|
| Respiratory center | Medulla (lower brain) | Basic rhythm of breathing (in/out cycle) |
| Pneumotaxic center | Pons | Stops each breath from going on too long |
| Apneustic center | Pons | Helps prolong inspiration |
- Rising CO2 in blood is the main signal - detected by receptors in the brain (central chemoreceptors)
- Falling O2 (below 60 mmHg) is detected by receptors in neck arteries (carotid bodies) - called peripheral chemoreceptors
- Falling blood pH also triggers faster breathing
Key point: It's rising CO2, NOT falling O2, that mainly drives you to breathe faster.
Quick Summary Table
| Structure | Key Feature | Main Job |
|---|---|---|
| Nose | Cilia, blood vessels, conchae | Filter, warm, humidify air |
| Pharynx | Shared food/air passage | Route air to larynx |
| Larynx | Vocal cords, epiglottis | Voice + protect airway |
| Trachea | Cartilage rings | Keep airway open |
| Bronchi | Branching tubes with cartilage | Carry air into lungs |
| Bronchioles | Smooth muscle, no cartilage | Control airflow |
| Alveoli | 300M+ thin sacs | GAS EXCHANGE |
| Diaphragm | Main breathing muscle | Drives inspiration |
| Pleura | Double membrane | Protects lungs, reduces friction |