
Aplastic anemia definition, etiology peripheral smear Bone marrow picture clinical feature Lab diagnosis
aplastic anemia bone marrow biopsy hypocellular
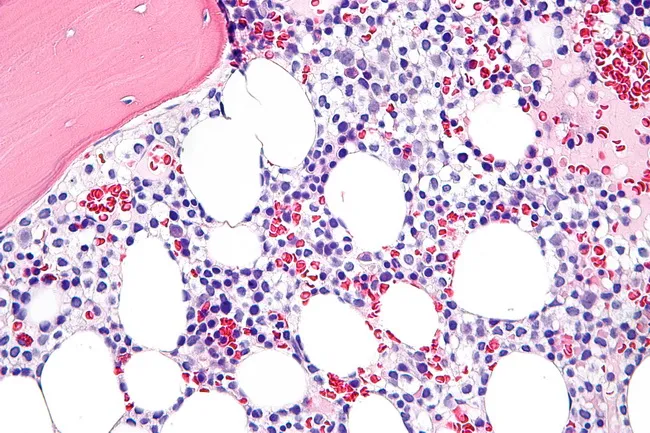
Histopathology: Bone marrow biopsy prepared for light microscopy shows diffuse infiltration by hairy cells rather than well-formed nodules. The marrow is often hypercellular in established disease but can be hypocellular in early stages, mimicking aplastic anemia. Hairy cells appear monotonous with oval nuclei and abundant clear cytoplasm that yields a characteristic fried egg morphology on H&E sections. In some cases, hair-like cytoplasmic projections (hairy indentations) are accentuated with specialized staining such as DBA.44 immunostain, supporting a hairy cell leukemia (HCL) diagnosis. The tumor cells may display spindled forms; the immunophenotype typically includes DBA.44 positivity, and cells may express CD11c, CD25, and CD103 on broader panels. Normal hematopoietic elements, particularly myeloid precursors, are reduced and can show dysplastic changes reminiscent of myelodysplastic syndrome. Plasma cells and mast cells may be mildly increased. Significant reticulin fibrosis is common, contributing to difficult marrow aspirates and making core biopsy essential to determine the extent of marrow replacement. Although marrow evaluation is informative, many cases of HCL can be diagnosed from peripheral blood smear and immunophenotyping alone; however, the biopsy provides baseline disease burden and a reference for assessing therapeutic response and fibrosis progression. This image exemplifies classic HCL marrow involvement with fried egg cells and conspicuous reticulin fibrosis.
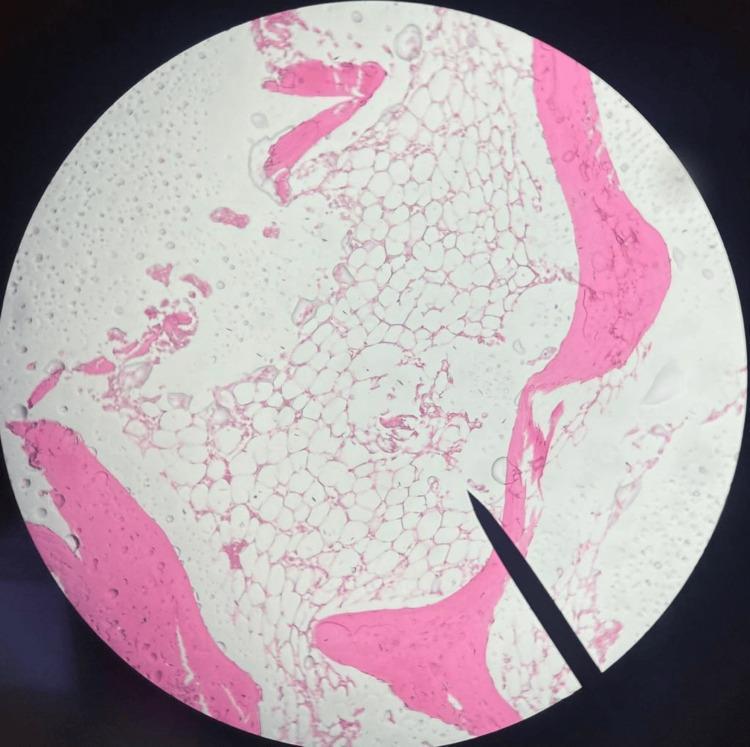
This diagnostic image is a low-magnification light microscopy photomicrograph of a bone marrow trephine biopsy, likely stained with hematoxylin and eosin (H&E). The specimen exhibits marked hypocellularity, a hallmark of severe aplastic anemia. The hematopoietic space is predominantly occupied by clear, vacuolated adipocytes (fatty marrow), with a notable absence of normal myeloid, erythroid, and megakaryocytic cell lines. Eosinophilic (pink) trabecular bone spicules are visible at the periphery and interspersed within the marrow cavity, providing structural context. The clinical significance of this finding is the demonstration of bone marrow failure, where the functional marrow has been replaced by adipose tissue. The absence of infiltrative abnormal cells or significant fibrosis is a key negative finding for differentiating this from myelodysplastic syndromes or myelofibrosis.
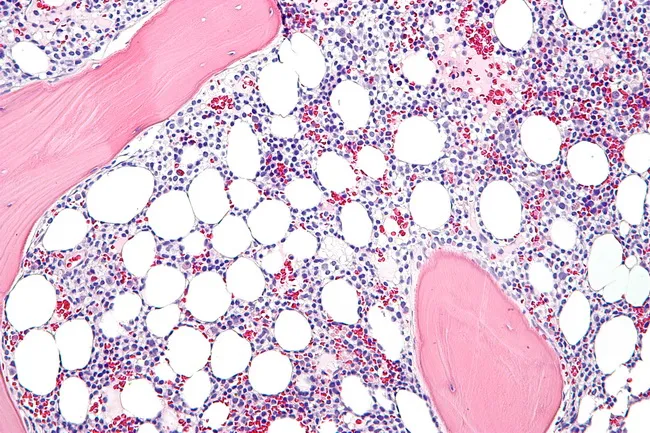
Light microscopy of a bone marrow biopsy from hairy cell leukemia (HCL) shows diffuse infiltration by small to medium lymphoid cells with abundant clear cytoplasm and oval, occasionally reniform nuclei; the cytoplasm creates a fried egg appearance. Hairy projections may be highlighted by immunostaining and by DBA.44 positivity, along with CD11c, CD25, and CD103 markers. The marrow is commonly hypercellular in established disease, whereas early involvement may be hypocellular and mimic aplastic anemia. Prominent reticulin fibrosis is typical and can hinder aspirate yield, making core biopsy essential for assessing infiltration and baseline disease burden. Normal hematopoietic elements, especially the myeloid lineage, are reduced and may display dysplastic changes resembling myelodysplastic syndrome. Plasma cells and mast cells may be mildly increased. In some cases, hairy cells assume a spindle-shaped morphology. The neoplastic cells are typically monotonous with minimal prominent nucleoli, and cytoplasm may exhibit cytoplasmic processes. Unlike several small B-cell lymphomas, discrete cellular aggregates are uncommon, with diffuse replacement predominating. Immunohistochemistry and flow cytometry confirm the diagnosis via characteristic immunophenotype. Clinically, marrow involvement informs staging, prognosis, and treatment planning, though peripheral blood smear and immunophenotypic profiling often suffice for diagnosis. This image, captured at high magnification on a hematoxylin and eosin stained section, showcases classic hairy cell features.
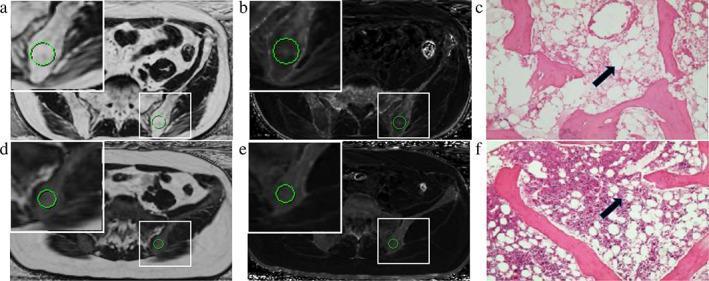
A multi-modal comparison of bone marrow characteristics between Aplastic Anemia (AA) and Myelodysplastic Syndromes (MDS). Panels A, B, D, and E show axial magnetic resonance (MR) images of the pelvis at the level of the left posterior superior ilium. Panels A and D are fat fraction (FF) maps, where the ROI in AA (A) displays significantly higher signal hyperintensity (86.98% FF) compared to MDS (D, 25.84% FF), indicating extensive fatty replacement of marrow. Panels B and E represent R2* maps used for iron content quantification (117.91 vs 147.98/second). Panels C and F provide corresponding H&E stained histological sections of the bone marrow. The AA section (C) demonstrates hypocellularity with a marked increase in large, clear adipocytes (black arrow) and sparse hematopoietic cells. In contrast, the MDS section (F) shows hypercellular marrow with higher hematopoietic cell density and fewer adipocytes (black arrow) amidst bone trabeculae. This composite image illustrates the clinical application of IDEAL-IQ MRI sequences in differentiating marrow failure syndromes by correlating quantitative imaging metrics with histopathological findings.
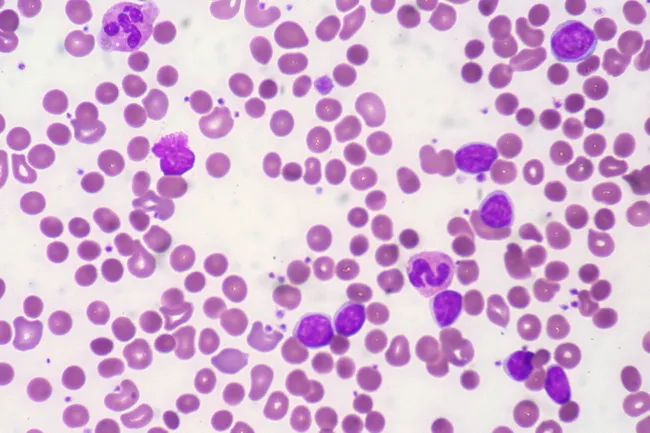
aplastic anemia peripheral blood smear pancytopenia
Histopathology: Bone marrow biopsy prepared for light microscopy shows diffuse infiltration by hairy cells rather than well-formed nodules. The marrow is often hypercellular in established disease but can be hypocellular in early stages, mimicking aplastic anemia. Hairy cells appear monotonous with oval nuclei and abundant clear cytoplasm that yields a characteristic fried egg morphology on H&E sections. In some cases, hair-like cytoplasmic projections (hairy indentations) are accentuated with specialized staining such as DBA.44 immunostain, supporting a hairy cell leukemia (HCL) diagnosis. The tumor cells may display spindled forms; the immunophenotype typically includes DBA.44 positivity, and cells may express CD11c, CD25, and CD103 on broader panels. Normal hematopoietic elements, particularly myeloid precursors, are reduced and can show dysplastic changes reminiscent of myelodysplastic syndrome. Plasma cells and mast cells may be mildly increased. Significant reticulin fibrosis is common, contributing to difficult marrow aspirates and making core biopsy essential to determine the extent of marrow replacement. Although marrow evaluation is informative, many cases of HCL can be diagnosed from peripheral blood smear and immunophenotyping alone; however, the biopsy provides baseline disease burden and a reference for assessing therapeutic response and fibrosis progression. This image exemplifies classic HCL marrow involvement with fried egg cells and conspicuous reticulin fibrosis.
Peripheral blood smear from a patient with known chronic lymphocytic leukemia (CLL) showing autoimmune hemolytic anemia (AIHA). Brightfield microscopy of Wright-Giemsa stained smear at 1000x (oil immersion) reveals two dominant cell populations: numerous small mature lymphocytes typical of CLL and red blood cells showing spherocytic deformation. A smudge cell is evident just left of center, a classical clue for CLL. Red cells display reduced central pallor consistent with spherocytes, indicating intravascular or extravascular hemolysis driven by autoantibodies. The background shows mild polychromasia and rare nucleated RBCs, consistent with a robust reticulocyte response; the corrected reticulocyte count in this case is markedly elevated (>7%). Platelets are not significantly abnormal. These features collectively support autoimmune destruction of erythrocytes in the setting of CLL. Diagnostic significance lies in recognizing AIHA as a common autoimmune complication in CLL, with a clinical picture of sudden Hb decline and compensatory erythropoiesis. Differential considerations include drug-induced hemolysis, other causes of hemolytic anemia, or marrow infiltration by CLL. Clinical correlation includes therapy implications (steroids, rituximab) and close monitoring of hemolysis markers. This image is a valuable teaching resource for hematology morphology, AIHA in CLL, and differential diagnosis in anemia.
This composite image consists of clinical photographs and a diagnostic peripheral blood smear. Figure 1a (left) shows a pediatric patient with clinical signs including total alopecia (complete absence of scalp hair) and nail pitting affecting both hands and feet, characterized by small punctate depressions on the nail plates. Figure 1b (right) is a microscopic view of a peripheral blood smear demonstrating microangiopathic hemolytic anemia. Visible are numerous schistocytes—fragmented, irregular red blood cells including helmet cells and triangular forms—alongside some normal erythrocytes showing central pallor. The educational focus is on the multi-systemic manifestations of a medical condition, likely a microangiopathic process such as Hemolytic Uremic Syndrome (HUS) or similar systemic pathology, illustrating the correlation between dermatological signs (hair and nail changes) and hematological abnormalities (hemolysis and schistocytosis).
Aplastic Anemia - Complete Overview
Definition
- Harrison's Principles of Internal Medicine 22E, p. 852
- Henry's Clinical Diagnosis and Management by Laboratory Methods, p. 687
Etiology
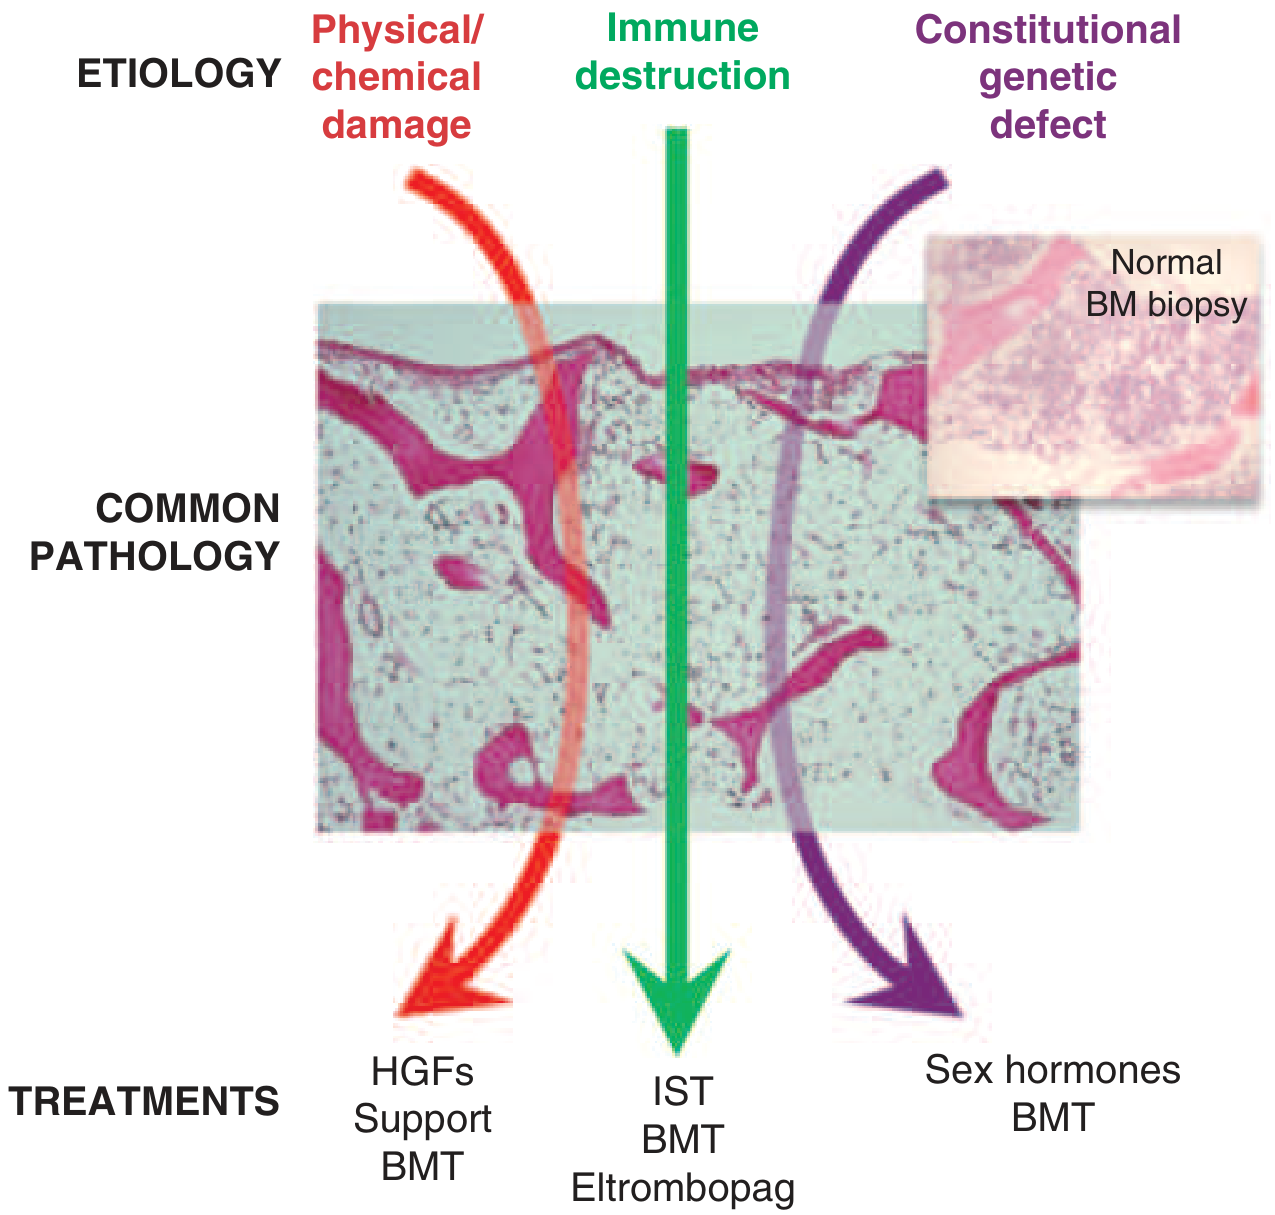
1. Acquired (Immune-Mediated) - Most Common (~70% Idiopathic)
- Idiopathic - no etiologic agent identified in ~70% of acquired cases
- Drugs and chemicals - account for 11-20% of cases:
- Chloramphenicol (classic), sulfonamides, phenylbutazone, gold salts, NSAIDs
- Cytotoxic drugs (dose-dependent, predictable)
- Benzene and organic solvents (chemical)
- Viral infections - 2-9% of cases:
- Seronegative hepatitis (hepatitis-associated AA) - important association
- Epstein-Barr virus (EBV), CMV, parvovirus B19, HIV
- Radiation - damages actively dividing hematopoietic cells; dose-dependent
- Pregnancy - may unmask or worsen AA; can remit post-delivery
- Autoimmune conditions - SLE, RA, eosinophilic fasciitis (~10%)
- Thymoma (usually associated with pure red cell aplasia but can cause AA)
- Paroxysmal nocturnal hemoglobinuria (PNH) - closely linked; PNH clone found in 50-70% of AA patients
2. Inherited / Constitutional (Bone Marrow Failure Syndromes)
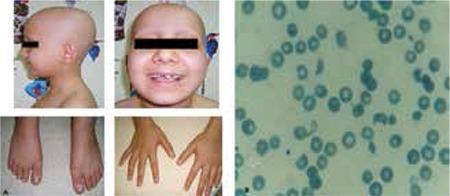
- Fanconi anemia - autosomal recessive; DNA repair defect; presents in childhood with characteristic anomalies (radial aplasia, hyperpigmentation, short stature, microcephaly); chromosomal fragility on testing
- Dyskeratosis congenita - telomere biology disorder; nail dystrophy, oral leukoplakia, skin pigmentation
- Diamond-Blackfan anemia - pure red cell aplasia variant
- GATA2 deficiency, RUNX1 familial platelet disorder - can present as marrow failure in adults
- 30-35% of childhood AA is inherited
3. Pathogenesis of Acquired AA
- Stem cells are antigenically altered by drugs, infections, or unknown insults
- Activated CD8+ cytotoxic T-cell clones are expanded
- Th1 cytokines - particularly IFN-γ - induce Fas expression on CD34+ stem cells → apoptosis
- TNF-α, IL-2, and other type 1 cytokines suppress hematopoietic progenitors
- CD34+ cells fall to <0.3% of marrow cellularity
- Robbins & Kumar Basic Pathology, p. 2079
- Harrison's 22E, p. 854
Peripheral Blood Smear Findings
| Cell Line | Finding |
|---|---|
| Red cells | Normochromic, normocytic anemia (may be macrocytic); no poikilocytosis; no nucleated RBCs (contrast with myelophthisic anemia); relative lymphocytosis |
| White cells | Neutropenia - absolute neutrophil count reduced; lymphocytes relatively preserved |
| Platelets | Thrombocytopenia - reduced numbers, but morphologically normal platelets |
| Reticulocytes | Markedly reduced (reticulocytopenia) - key finding distinguishing hypoproductive from hemolytic anemia |
- No schistocytes (not hemolytic)
- No blast cells (not leukemia)
- No leukoerythroblastic picture (not myelophthisic)
- No splenomegaly (absent organomegaly)
Bone Marrow Picture
- Marked hypocellularity (<25% cellularity in severe AA; normal is ~50% in adults)
- Fatty replacement of marrow - adipocytes dominate
- Near-total absence of myeloid, erythroid, and megakaryocytic lineages
- Residual cells: lymphocytes, plasma cells, mast cells, stromal cells
- No infiltration by abnormal cells (no blasts, no fibrosis - distinguishes from AML/MDS/myelofibrosis)
- Patchy areas of residual normocellularity may occur
- Normal reticulin (no fibrosis)
Classification by Severity
| Category | Criteria |
|---|---|
| Non-severe AA | Hypocellular marrow + cytopenia not meeting severe criteria |
| Severe AA (SAA) | Marrow cellularity <25% + at least 2 of: Neutrophils <0.5×10⁹/L; Platelets <20×10⁹/L; Reticulocytes <20×10⁹/L (or <60×10⁹/L by automated count) |
| Very Severe AA (vSAA) | SAA criteria + Neutrophils <0.2×10⁹/L |
- Henry's Clinical Diagnosis, p. 687
Clinical Features
Symptoms by Cell Line
- Easy bruising, ecchymoses, petechiae
- Bleeding gums, epistaxis, menorrhagia
- Risk of intracranial hemorrhage (catastrophic but rare)
- Fatigue, lassitude, weakness
- Dyspnea on exertion
- Pallor
- Pounding sensation in ears (pulsatile tinnitus)
- Infections (less common as initial presentation than in agranulocytosis)
- Mouth ulcers, perianal infections, fever
- Risk of sepsis with prolonged severe neutropenia
-
Pallor
-
Petechiae, purpura, ecchymoses
-
No splenomegaly - if spleen is palpable, consider another diagnosis
-
No lymphadenopathy
-
Patients often "look remarkably well" despite severe blood count depression (Harrison's)
-
Henry's Clinical Diagnosis, p. 687
-
Harrison's 22E, p. 854
Laboratory Diagnosis
Complete Blood Count (CBC)
| Parameter | Finding |
|---|---|
| Hemoglobin | Low (normochromic, normocytic; occasionally macrocytic) |
| WBC | Low; neutropenia; relative lymphocytosis |
| Platelets | Low |
| Reticulocyte count | Markedly low (reticulocytopenia) - absolute reticulocyte count <20×10⁹/L |
| MCV | Normal to mildly elevated |
Peripheral Smear
- Pancytopenia (all three lines reduced)
- Normal RBC morphology (no poikilocytosis)
- No blasts, no leukoerythroblastic picture
Bone Marrow Aspiration and Biopsy
- Hypocellular marrow (<25% cellularity in severe AA)
- Replacement by fat
- Markedly reduced CD34+ cells (<0.3% of marrow)
- No dysplasia, no fibrosis, no infiltration
Special Studies
- Flow cytometry for PNH clone - GPI-anchored proteins (CD55, CD59) absent on RBCs and granulocytes; positive in 50-70% of AA patients
- Chromosomal fragility test (diepoxybutane / DEB test or mitomycin C) - for Fanconi anemia diagnosis
- Telomere length testing - for telomere biology disorders (dyskeratosis congenita)
- HLA typing - for transplant planning
- Vitamin B12 and folate - to exclude nutritional causes
- Serum iron - elevated (iron not utilized due to aplasia)
- Erythropoietin - markedly elevated (appropriate response to anemia)
- LFTs, hepatitis serology - to identify hepatitis-associated AA
- Autoimmune screen (ANA, anti-dsDNA) - to exclude SLE-associated AA
Diagnostic Criteria Summary
- Pancytopenia on CBC
- Hypocellular bone marrow on biopsy
- Exclusion of other causes (leukemia, MDS, myelofibrosis, B12/folate deficiency, hypersplenism)
- Henry's Clinical Diagnosis and Management by Laboratory Methods, p. 687
- Robbins & Kumar Basic Pathology, p. 2077-2089
- Harrison's Principles of Internal Medicine 22E, p. 852-854
Aplastic anemia definition, etiology peripheral smear Bone marrow picture clinical feature Lab diagnosis with simple explaination in point of view
🩸 Aplastic Anemia - Simple Explanation
1. DEFINITION - "What is it?"
Think of it this way: The bone marrow is a factory that makes blood cells. In aplastic anemia, this factory shuts down and gets replaced by fat.
- Aplastic anemia = Pancytopenia (all 3 blood cell lines are low) + Hypocellular bone marrow (marrow replaced by fat, not making cells)
- The word "aplastic" = "a" (no) + "plastic" (forming) = bone marrow cannot form blood cells
2. ETIOLOGY - "Why does it happen?"
Simple Memory Framework: "I D R A C"
| Letter | Cause | Examples |
|---|---|---|
| I | Idiopathic (most common!) | No known cause - ~70% of cases |
| D | Drugs & Chemicals | Chloramphenicol ⭐, benzene, NSAIDs, gold salts, sulfonamides |
| R | Radiation | X-rays, nuclear accidents |
| A | Autoimmune / Infections | Hepatitis (seronegative), EBV, CMV, parvovirus B19, SLE |
| C | Congenital (Inherited) | Fanconi anemia, Dyskeratosis congenita |
The Mechanism (Why cells die):
Imagine your immune system (T-cells) mistakenly attacks your own bone marrow stem cells - like a soldier attacking their own base.
- Activated CD8+ T-cells release IFN-γ (interferon gamma)
- IFN-γ triggers apoptosis (death) of CD34+ stem cells
- Result = empty marrow = no blood cell production
- This is why immunosuppressive therapy works in 60-70% of patients
3. PERIPHERAL BLOOD SMEAR - "What do you see under the microscope?"
Think: "Everything is low, but what's there looks NORMAL"
| What you see | Why |
|---|---|
| Few RBCs (pale, normochromic, normocytic) | Factory not making enough |
| Low platelets | Factory not making enough |
| Low neutrophils | Factory not making enough |
| Relative lymphocytosis | Lymphocytes survive (they don't come from the failing stem cells as rapidly) |
| Low reticulocytes ⭐ | KEY FINDING - no new RBCs being made |
What you do NOT see (important negatives!):
- ❌ No blast cells (not leukemia)
- ❌ No schistocytes (not hemolytic anemia)
- ❌ No nucleated RBCs (not myelophthisic anemia)
- ❌ No tear-drop cells
4. BONE MARROW PICTURE - "The Gold Standard"
Simple image: Normal marrow looks like a busy factory (80% cells). In aplastic anemia, it looks like an empty warehouse full of fat globules.
What you see on biopsy:
| Finding | Meaning |
|---|---|
| Hypocellularity (<25% cells) | Factory mostly empty |
| Fat cells (adipocytes) dominate | Fat has replaced marrow |
| No myeloid/erythroid/megakaryocyte precursors | All blood cell lines absent |
| No fibrosis, no blasts | Distinguishes from MDS/myelofibrosis/leukemia |
| Residual lymphocytes, plasma cells | These survive |
On aspirate:
- "Dry tap" - you pull the needle out and get almost nothing
5. CLINICAL FEATURES - "What does the patient look/feel like?"
Memory trick: The symptoms follow the 3 cell lines that are failing:
Three groups of symptoms:
- Fatigue, weakness
- Pallor (pale skin, conjunctiva)
- Shortness of breath
- Pounding heartbeat
- Easy bruising
- Petechiae (tiny red dots on skin)
- Bleeding gums, nosebleeds
- Heavy periods (menorrhagia)
- Recurrent infections
- Mouth ulcers
- Fever
- Sepsis in severe cases
Physical Exam Key Points:
| Finding | Significance |
|---|---|
| Pallor | Anemia |
| Petechiae/ecchymoses | Thrombocytopenia |
| No splenomegaly ⭐ | If spleen is big = think of another diagnosis! |
| No lymphadenopathy | Helps rule out lymphoma |
Who gets it?
- Bimodal - peaks at teens/20s AND >60 years
- Males = Females (equal)
6. LAB DIAGNOSIS - "How do we confirm it?"
Step-by-step approach:
| Test | Result in AA |
|---|---|
| Hemoglobin | ↓ Low |
| WBC | ↓ Low (especially neutrophils) |
| Platelets | ↓ Low |
| Reticulocytes | ↓↓ Very low ⭐ (key!) |
| MCV | Normal or slightly high |
- Pancytopenia with normal morphology
- Low reticulocytes
- No blasts, no dysplastic cells
- <25% cellularity = Severe AA
- Fatty replacement
- No infiltration, no fibrosis
Severity Classification (Important for treatment decisions!):
| Type | Neutrophils | Platelets | Reticulocytes |
|---|---|---|---|
| Non-severe AA | >0.5×10⁹/L | >20×10⁹/L | Normal range |
| Severe AA (SAA) | <0.5×10⁹/L | <20×10⁹/L | <20×10⁹/L |
| Very Severe AA | <0.2×10⁹/L ⭐ | <20×10⁹/L | <20×10⁹/L |
| Test | What it detects |
|---|---|
| Flow cytometry (CD55/CD59) | PNH clone (found in 50-70% of AA) |
| Chromosomal fragility (DEB test) | Fanconi anemia |
| Telomere length | Dyskeratosis congenita |
| Serum iron | Elevated (iron not being used) |
| Erythropoietin level | Very high (body trying to compensate) |
| Hepatitis serology, ANA | Rule out causes |
| HLA typing | For bone marrow transplant planning |
QUICK SUMMARY TABLE
| Feature | Aplastic Anemia |
|---|---|
| Definition | Pancytopenia + hypocellular marrow |
| Mechanism | T-cell attack on stem cells |
| Most common cause | Idiopathic (70%) |
| Classic drug cause | Chloramphenicol |
| Peripheral smear | Normocytic anemia + ↓↓ reticulocytes + no blasts |
| Bone marrow | Empty, fatty, hypocellular |
| Key negative finding | No splenomegaly |
| Confirmatory test | Bone marrow biopsy |
| Treatment | HSCT (young patients) / IST with ATG + cyclosporine (others) |
One-line memory: "In aplastic anemia, the T-cells attack the stem cells, the factory shuts down, fat fills the marrow, and the patient bleeds, gets infections, and becomes anaemic - with NO spleen enlargement."
difference between metaplasia & dysplasia
metaplasia vs dysplasia histology comparison
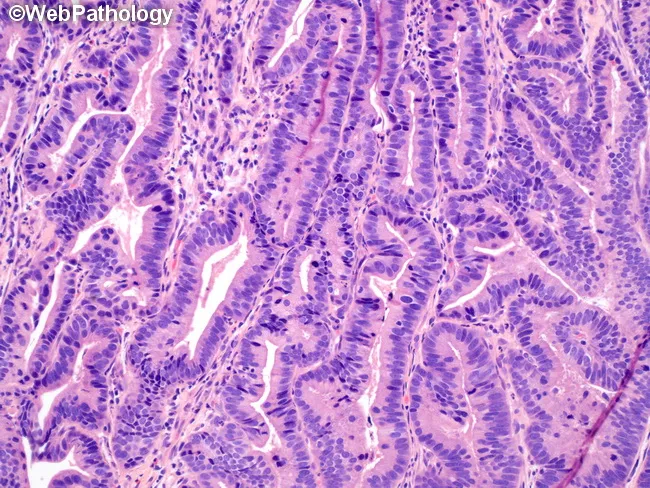
Histology image of Barrett esophagus with low-grade dysplasia illustrating intestinal metaplasia of the distal esophageal mucosa. The material is a formalin-fixed, paraffin-embedded biopsy section stained with hematoxylin and eosin and viewed at high magnification. The mucosa shows tubular glands with goblet cells characteristic of Barrett mucosa, embedded in lamina propria and terminating at the muscularis mucosae. In LGD, cytologic atypia is evident: mild to moderate nuclear pleomorphism, increased nuclear-to-cytoplasmic ratio, hyperchromasia, and pseudostratification of nuclei within dysplastic gland bases. Architectural crowding with elongated, irregular glands and occasional outpouchings is compatible with dysplastic change. Normal-appearing Barrett epithelium with intestinal metaplasia is present but lacks high-grade features or invasion. There is no invasion beyond the mucosa; no desmoplasia or submucosal invasion is seen. Clinically, Barrett esophagus with LGD carries a higher risk of progression to high-grade dysplasia or adenocarcinoma and supports intensified endoscopic surveillance or therapeutic eradication strategies. This image is relevant for educational comparison of LGD versus non-dysplastic BE and for radiologic-pathologic correlation, pathology slide review, and multidisciplinary case discussion in gastroenterology and pathology. No invasion beyond the muscularis mucosa is evident, underscoring mucosal-confined dysplasia. The image aids teaching on LGD criteria, biopsy interpretation, and risk stratification guiding endoscopic management today.
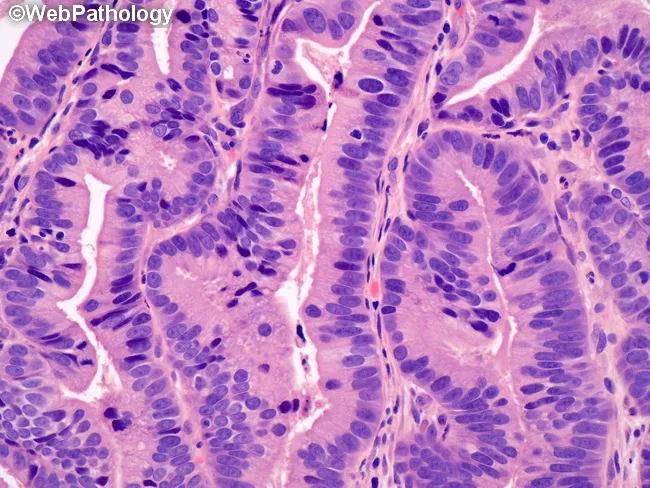
Imaging modality: Light microscopy of Hematoxylin and Eosin (H&E) stained tissue from a distal esophageal mucosal biopsy. The histology shows Barrett esophagus with intestinal metaplasia and areas of low-grade dysplasia. Within the mucosa, tall columnar epithelial cells with basally oriented nuclei form elongated, irregular glands that extend toward the luminal surface. Goblet cells containing mucin are present, confirming intestinal differentiation. Nuclear features include mild enlargement, hyperchromasia, and pseudostratification with slight crowding in the lower to middle thirds of the epithelium, while overall gland architecture remains relatively preserved in comparison to high-grade lesions. The lamina propria shows mild chronic inflammatory infiltrate; no invasion is evident. Overall, the lesion demonstrates early dysplastic changes consistent with LGD in Barrett mucosa: precancerous changes that portend progression risk if not managed. Diagnostic significance: LGD signals increased risk of progression to high-grade dysplasia and esophageal adenocarcinoma; requires close endoscopic surveillance and often endoscopic eradication therapy or risk-stratified management per guidelines. Potential clinical use: pathology teaching, gastroenterology training, endoscopic-luminal cancer risk assessment, research on BE progression. Keywords: Barrett esophagus, LGD, intestinal metaplasia, goblet cells, dysplasia, H&E, distal esophagus, GEJ, precancerous lesion, cancer risk, surveillance, endoscopic ablation. Importantly.
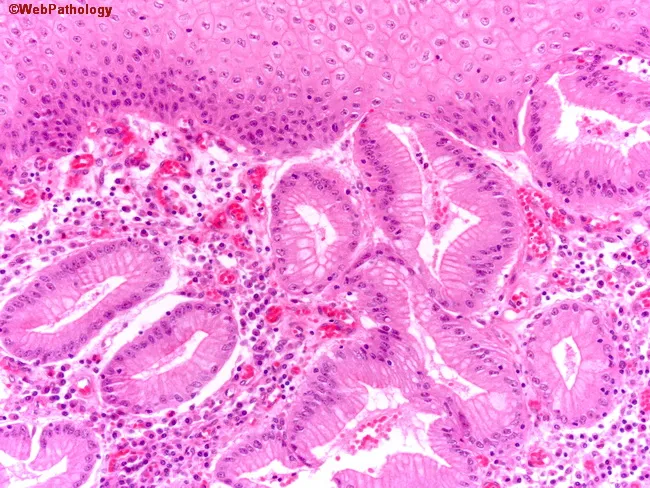
Histopathology: Hematoxylin and eosin stained paraffin-embedded distal esophageal biopsy demonstrating Barrett-type mucosa with intestinal metaplasia. The squamous lining is replaced by specialized columnar epithelium containing scattered goblet cells, consistent with intestinal differentiation. Nuclei are basally oriented within mature enteric-type epithelial cells; goblet cells exhibit mucin-rich cytoplasm. There is no cytologic atypia or architectural disarray; nuclei show normal polarity; mucosal glands appear orderly with preserved stratification of superficial cells. Inflammation is mild; no Barrett dysplasia, no cellular atypia, no cribriforming, and no glandular crowding. The mucosa lies just proximal to the gastroesophageal junction; distribution is patchy to diffuse along the distal esophagus. Overall impression: Barrett esophagus with intestinal metaplasia, negative for dysplasia. Clinical significance: pivotal for surveillance strategy and cancer risk stratification; in BE, intestinal metaplasia defines eligibility for surveillance intervals; absence of dysplasia reduces immediate risk but requires longitudinal monitoring. Differential diagnoses include intestinal metaplasia without dysplasia vs. esophagitis with regenerative change or gastritis involving the distal esophagus. Correlation with endoscopy findings and prior biopsies is recommended to assess progression risk to low-grade/high-grade dysplasia or adenocarcinoma. This slide exemplifies BE pathology suitable for educational review, histology correlation, and pathology teaching slides.
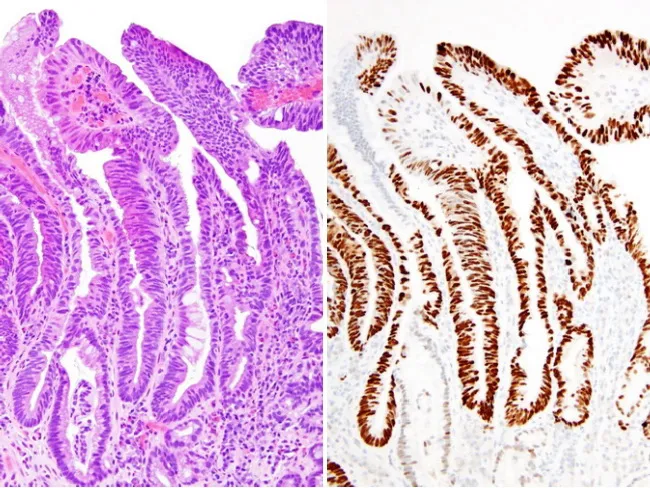
Two-panel histology image illustrating Barrett esophagus with high-grade dysplasia. Modality: Bright-field light microscopy of formalin-fixed esophageal biopsy tissue. Left panel shows hematoxylin and eosin (H&E) stained section revealing intestinal metaplasia in the distal esophagus with goblet cells, glandular architecture disrupted by architectural disarray, stratified, hyperchromatic epithelial nuclei, and mitotic activity consistent with high-grade dysplasia. Right panel demonstrates immunohistochemistry for p53, with strong nuclear brown staining accentuating dysplastic glands, reflecting p53 protein accumulation/mutational inactivation in the Barrett epithelium. The combination of BE with high-grade dysplasia and p53 overexpression supports TP53 pathway disruption and a higher risk of progression to esophageal adenocarcinoma. The image highlights the concordance between morphology and biomarker status, where p53 immunoreactivity correlates with molecular alterations (TP53 mutation) and may portend clonal evolution within BE. Clinically relevant for risk stratification, endoscopic surveillance strategies, and therapeutic decision-making, including consideration of early endoscopic eradication therapy. Visual features include intact surface mucosa with columnar epithelium, goblet cell-containing intestinal metaplasia, nuclear atypia, mitotic figures, and robust p53 positivity in dysplastic glands. This image is valuable for education, pathology training, and research into goblet cell metaplasia, BE progression, and targeted biomarker validation. These data support biomarker-guided management and targeted prevention of progression in BE.