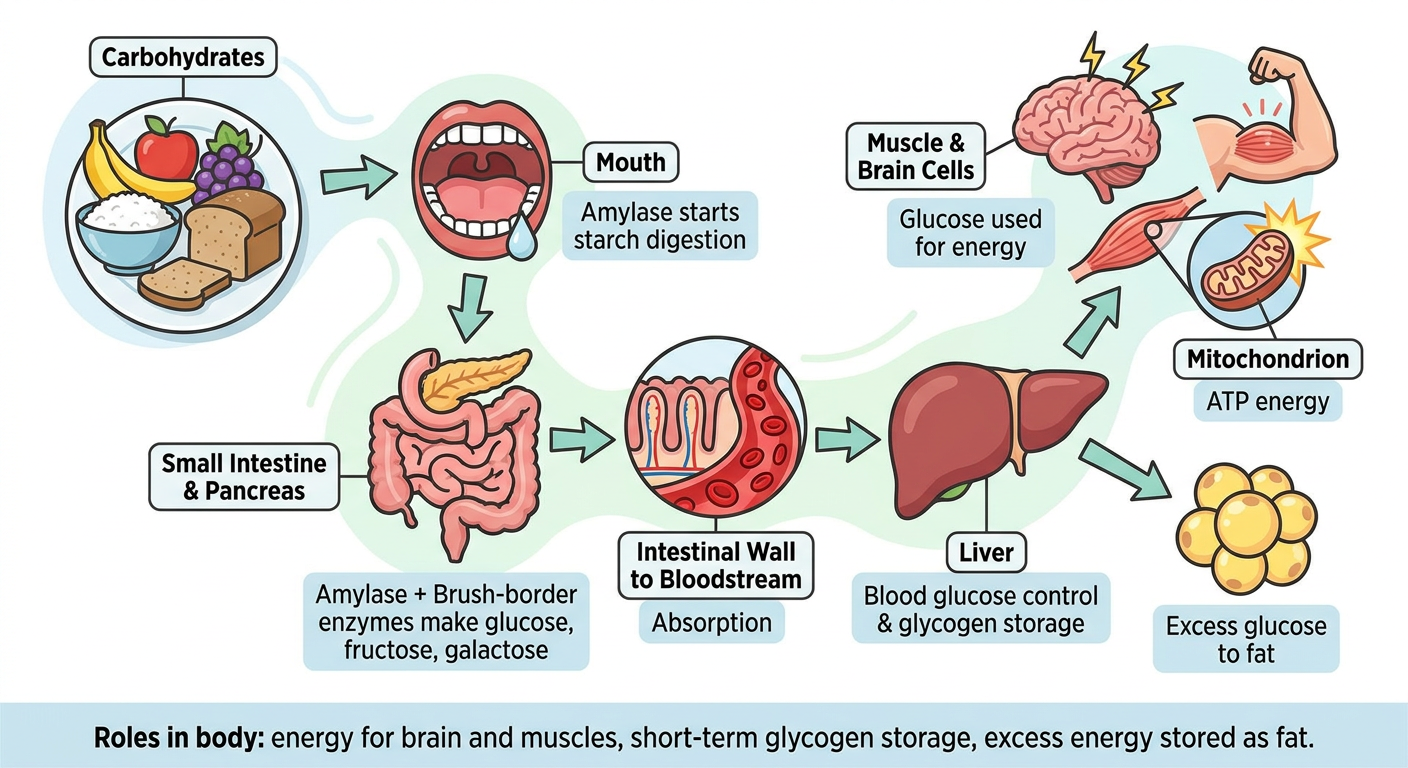
Make photo or pictogram from carbohydrate digestion absorption to it metabolism with only key steps and role in body
carbohydrate digestion absorption
carbohydrate digestion absorption metabolism overview glucose glycogen ATP authoritative
A clear educational pictogram infographic showing the journey of carbohydrate in the human body with only key steps: plate of rice, bread and fruit labelled Carbohydrates; mouth with saliva labelled Amylase starts starch digestion; small intestine and pancreas labelled Amylase plus brush-border enzymes make glucose, fructose and galactose; intestinal wall to red bloodstream labelled Absorption; liver labelled Blood glucose control and glycogen storage; branching to muscle and brain cells labelled Glucose used for energy; mitochondrion labelled ATP energy; a small storage branch labelled Excess glucose to fat. Include a simple footer: Roles in body: energy for brain and muscles, short-term glycogen storage, excess energy stored as fat. Use short, accurate labels and arrows in correct order, without extra pathways.
Make a combine poster for glycolysis, gluconeogenesis, and glycogen metabolism pictogram in one page
glycolysis gluconeogenesis glycogen metabolism
glycolysis gluconeogenesis glycogen metabolism pathway overview NIH
One-page educational medical pictogram poster titled “GLUCOSE METABOLISM: Three Connected Pathways”. Show a central large Glucose-6-phosphate hub with three color-coded, simple branches and arrows, using few key steps only. Left branch, Glycolysis in all cells: Glucose -> Glucose-6-phosphate -> Pyruvate, then mitochondrion -> ATP energy; label “Fed state, insulin promotes”. Right branch, Gluconeogenesis in liver and kidney: Lactate, glycerol and amino acids -> Pyruvate -> Glucose -> blood; label “Fasting, glucagon promotes” and “uses ATP”. Bottom branch, Glycogen metabolism: Liver and skeletal muscle glycogen store icon. Show glycogenesis: Glucose -> Glycogen, label insulin and fed state; show glycogenolysis: Glycogen -> Glucose-6-phosphate, label glucagon fasting in liver, exercise in muscle. Add only one clear note: liver releases glucose to maintain blood glucose; muscle uses glycogen locally for energy. Include small pictograms for liver, muscle, blood, mitochondrion, ATP battery, food plate and fasting moon. Use accurate labels, a clean readable one-page layout, arrows and minimal text, no complex enzyme lists, no extra pathways.
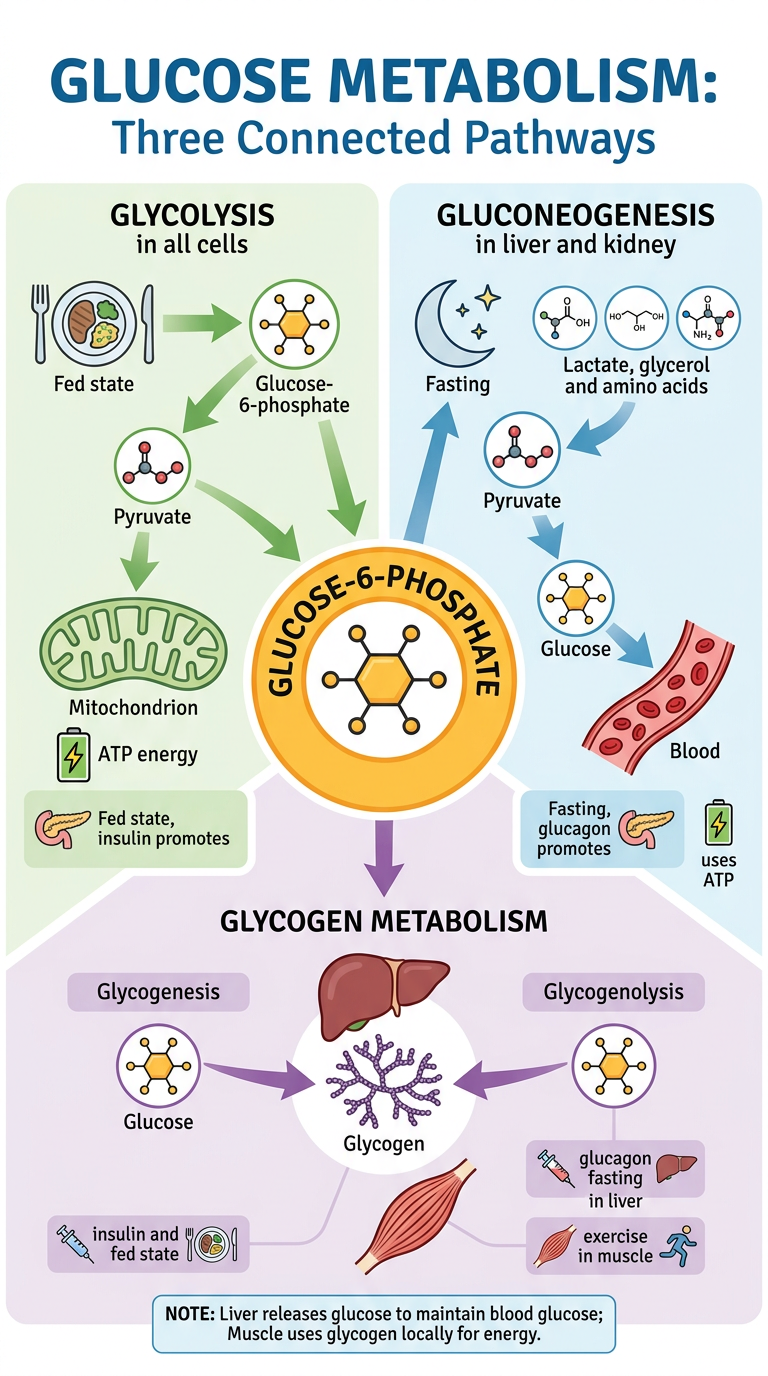
- Glycolysis: glucose breakdown to make ATP.
- Gluconeogenesis: liver and kidney make glucose during fasting.
- Glycogen metabolism: glucose stored as glycogen after meals and released during fasting or exercise.
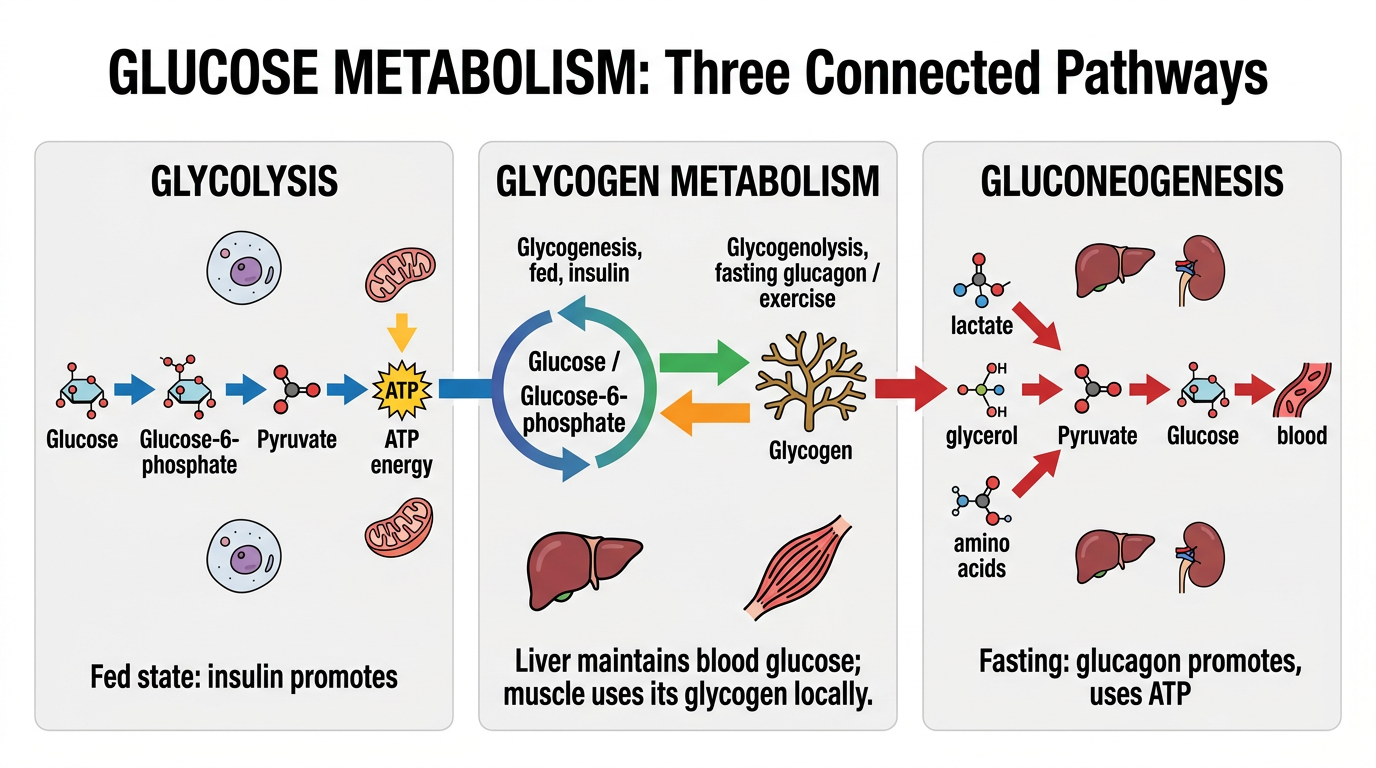
Make horizontally
A HORIZONTAL LANDSCAPE one-page educational medical pictogram poster, wide 16:9 format, titled “GLUCOSE METABOLISM: Three Connected Pathways”. Arrange three large panels side by side from left to right with a central Glucose / Glucose-6-phosphate hub connecting them. LEFT PANEL: “GLYCOLYSIS” in all cells: Glucose -> Glucose-6-phosphate -> Pyruvate -> ATP energy, with small mitochondrion icon; label “Fed state: insulin promotes”. CENTER PANEL: “GLYCOGEN METABOLISM” with liver and skeletal muscle icons. Show Glucose -> Glycogen labelled “Glycogenesis, fed, insulin” and Glycogen -> Glucose-6-phosphate labelled “Glycogenolysis, fasting glucagon / exercise”. Include note: “Liver maintains blood glucose; muscle uses its glycogen locally.” RIGHT PANEL: “GLUCONEOGENESIS” in liver and kidney: lactate, glycerol, and amino acids -> pyruvate -> glucose -> blood, label “Fasting: glucagon promotes, uses ATP”. Use short accurate labels, bold horizontal flow arrows, simple colorful medical icons, plentiful whitespace, large legible typography, no detailed enzyme lists and no extra pathways.
Make pictogram of lipid or fatty acid digestion aborption and its metabolism with olny key steps and role in body in horizontal
lipid digestion absorption metabolism
lipid digestion absorption chylomicrons fatty acid metabolism overview NCBI
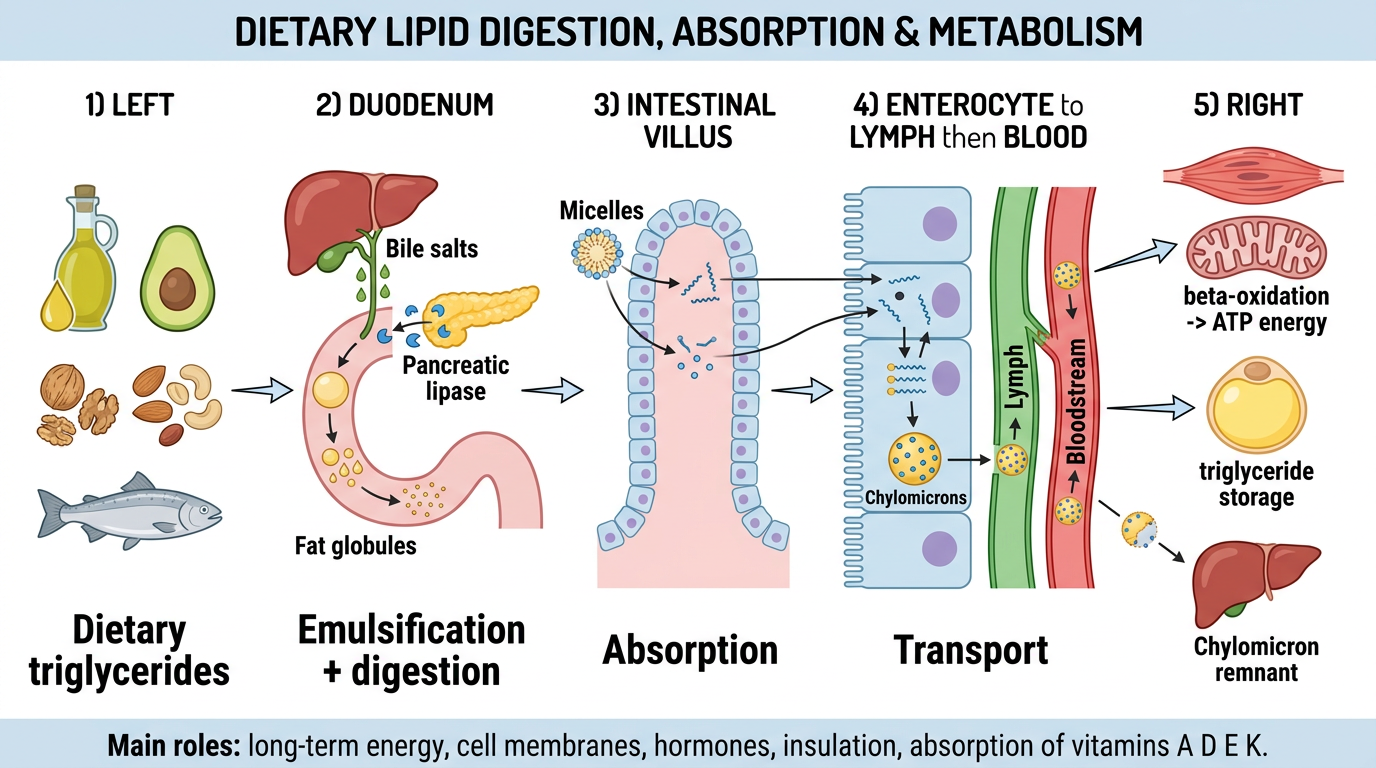
A HORIZONTAL LANDSCAPE, wide 16:9 educational medical pictogram titled “DIETARY LIPID DIGESTION, ABSORPTION & METABOLISM”. Create one clean left-to-right journey with only key steps and large readable labels. 1) LEFT: food icons for oil, avocado, nuts and fish labelled “Dietary triglycerides”. 2) DUODENUM: liver and gallbladder icon releases bile salts, pancreas icon releases pancreatic lipase; label “Emulsification + digestion”. 3) INTESTINAL VILLUS: micelles carry fatty acids and monoglycerides into enterocyte; label “Absorption”. 4) ENTEROCYTE to LYMPH then BLOOD: re-form triglycerides and package them as chylomicrons; arrows enter lymph then bloodstream; label “Transport”. 5) RIGHT: chylomicrons deliver fatty acids to muscle and adipose. Show muscle mitochondrion with “beta-oxidation -> ATP energy”; show adipose cell with “triglyceride storage”. Include a small liver icon receiving chylomicron remnants. Footer: “Main roles: long-term energy, cell membranes, hormones, insulation, absorption of vitamins A D E K.” Use simple arrows, precise wording, no enzyme details beyond bile salts and pancreatic lipase, no complex pathways, polished professional flat pictogram style.
Diagramatic form relationship of all types lipids and their normal range and its effect on body make 2 pic horizontal
lipid profile LDL HDL triglyceride guideline
CDC cholesterol LDL HDL triglycerides normal ranges mg dL
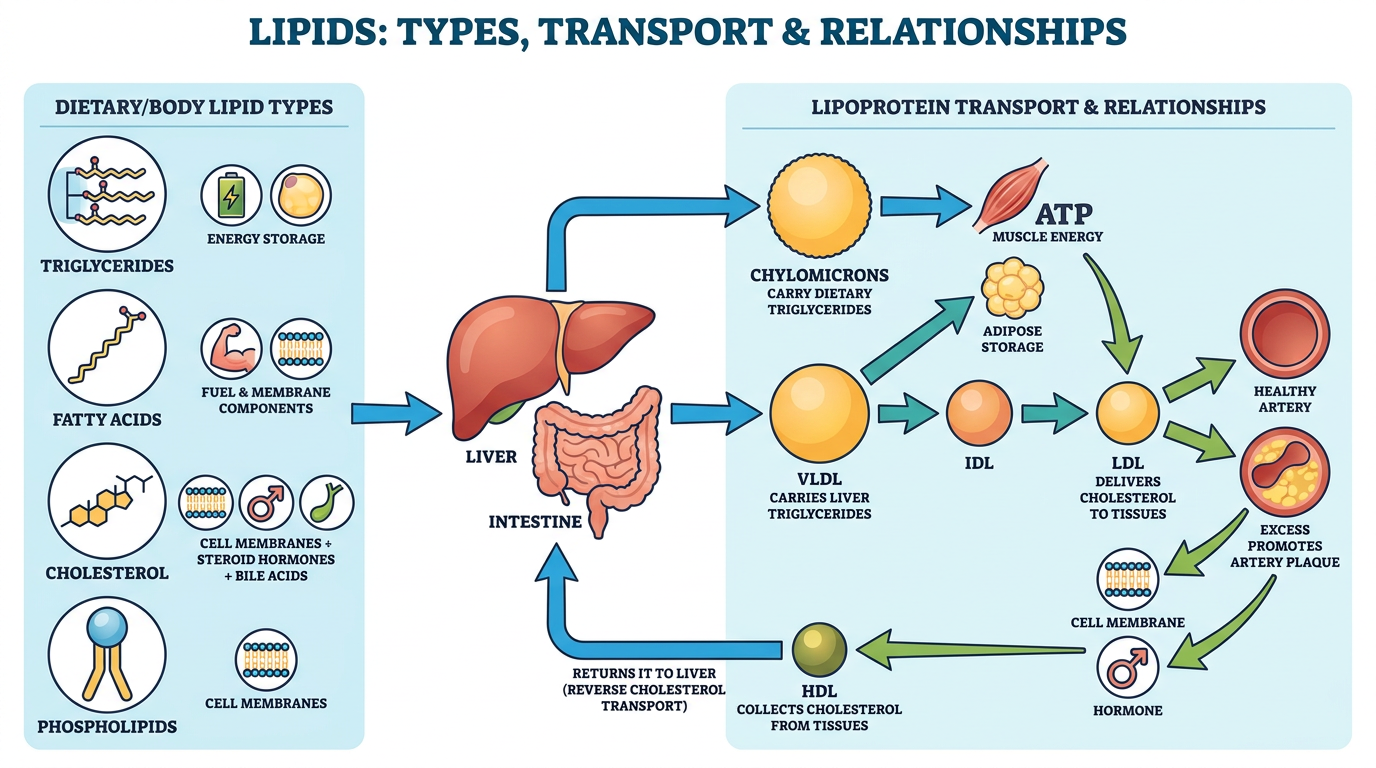
Create a HORIZONTAL LANDSCAPE 16:9 medical educational pictogram titled “LIPIDS: TYPES, TRANSPORT & RELATIONSHIPS”. Show a clear left-to-right connected diagram with few key labels. Left: four dietary/body lipid types as icons: triglycerides = energy storage, fatty acids = fuel and membrane components, cholesterol = cell membranes plus steroid hormones plus bile acids, phospholipids = cell membranes. Center: liver and intestine produce transport particles. Right: show lipoprotein relationship as a clean flow: Chylomicrons carry dietary triglycerides from intestine; VLDL carries liver triglycerides and becomes IDL then LDL; LDL delivers cholesterol to tissues and excess promotes artery plaque; HDL collects cholesterol from tissues and returns it to liver, reverse cholesterol transport. Add simple body-effect icons: ATP muscle energy, adipose storage, cell membrane, hormone, healthy artery, plaque artery. Do not use words good cholesterol or bad cholesterol. Use only accurate concise labels, bold arrows, wide readable layout, polished flat pictogram style.
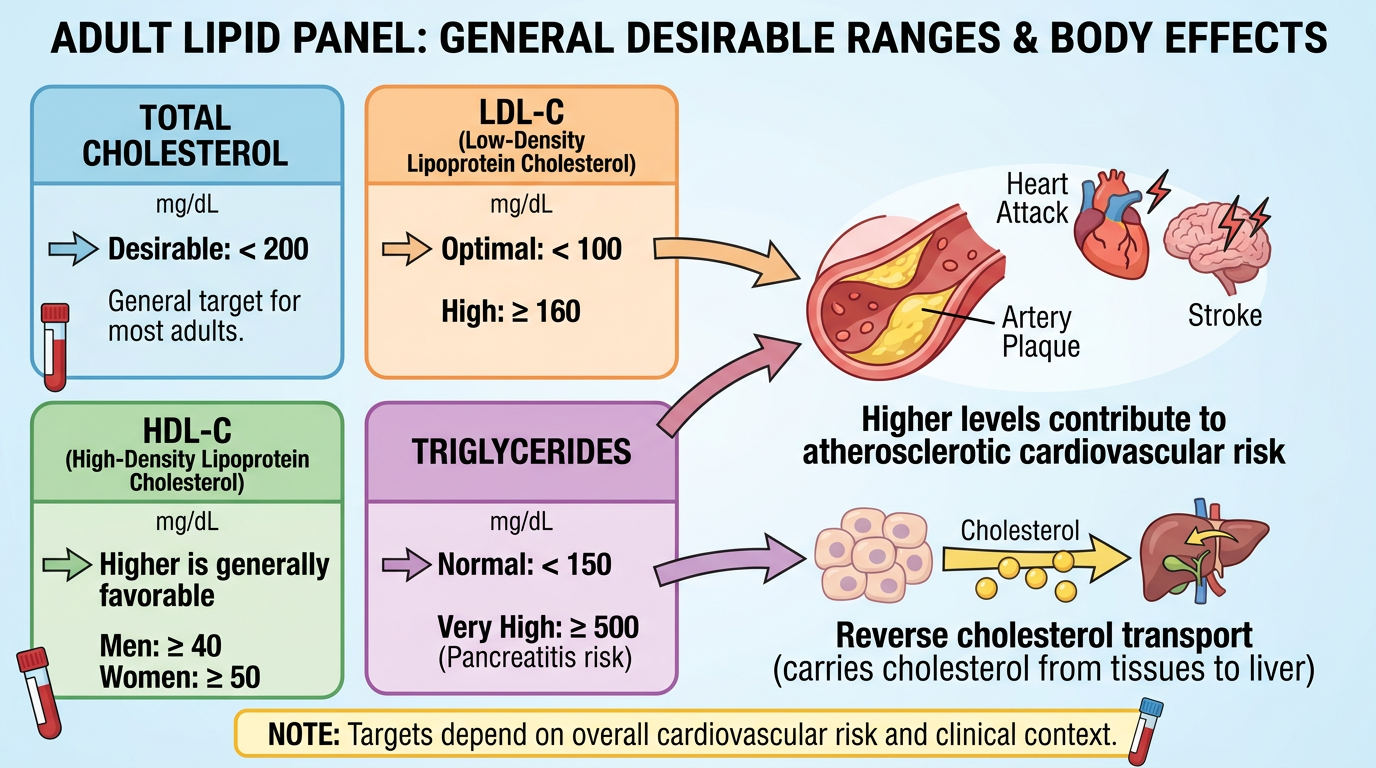
Create a HORIZONTAL LANDSCAPE 16:9 clinical educational pictogram titled “ADULT LIPID PANEL: GENERAL DESIRABLE RANGES & BODY EFFECTS”. Make four large side-by-side color-coded cards with readable labels and units mg/dL: Total cholesterol: desirable less than 200; LDL-C: optimal less than 100, 160 or higher high; HDL-C: higher is generally favorable, at least 40 men and at least 50 women; Triglycerides: normal less than 150, 500 or higher pancreatitis risk. Connect LDL-C and triglycerides with arrows to an artery plaque, heart attack and stroke risk icon, labeled “Higher levels contribute to atherosclerotic cardiovascular risk”. Connect HDL-C with an arrow carrying cholesterol from tissues to liver labeled “reverse cholesterol transport”. Add central note: “Targets depend on overall cardiovascular risk and clinical context.” Use a small blood test tube icon. Do not include treatment advice, no invented ranges, no good/bad labels. Clean precise wide diagram with large text and simple medical icons.
1. Lipid types, transport, and body roles
2. Adult lipid panel ranges and body effects
Make a pictograph of digestion absorption metabolism of proteins
protein digestion absorption
protein digestion absorption amino acid metabolism overview NCBI
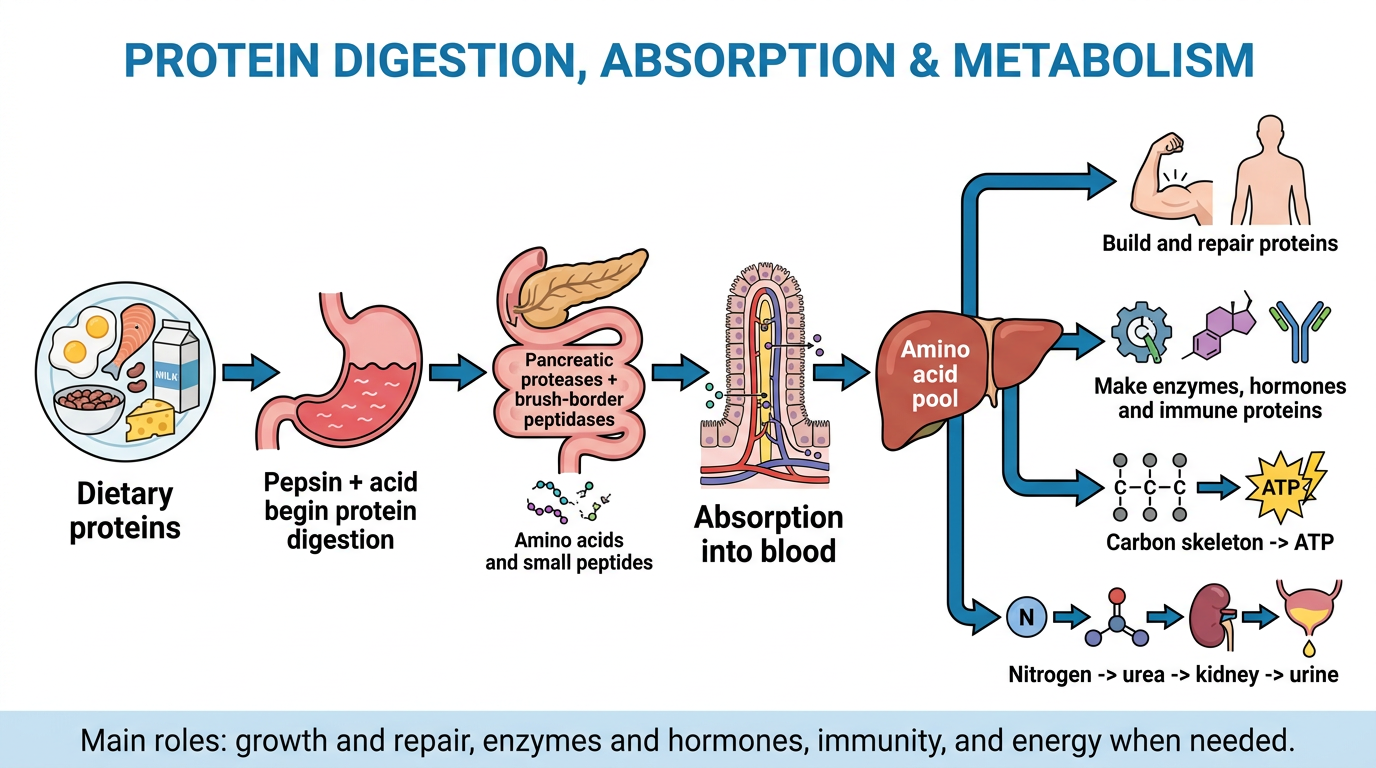
Create a HORIZONTAL LANDSCAPE wide 16:9 educational medical pictogram titled “PROTEIN DIGESTION, ABSORPTION & METABOLISM”. Show a clean left-to-right journey with only the key steps and large, accurate labels. 1) Food plate with eggs, fish, beans and dairy, labelled “Dietary proteins”. 2) Stomach icon: “Pepsin + acid begin protein digestion”. 3) Duodenum / small-intestine icon with pancreas: “Pancreatic proteases + brush-border peptidases” then “Amino acids and small peptides”. 4) Intestinal villus: transport into enterocyte and then portal blood, label “Absorption into blood”. 5) Liver as central distribution hub labelled “Amino acid pool”. 6) Right-side branches: muscle and body tissue labelled “Build and repair proteins”; enzyme, hormone and antibody icons labelled “Make enzymes, hormones and immune proteins”; energy branch showing carbon skeleton -> ATP; waste branch showing nitrogen -> urea -> kidney -> urine. Footer: “Main roles: growth and repair, enzymes and hormones, immunity, and energy when needed.” Use simple bold arrows, correct order, minimal words, no detailed biochemical pathways, polished professional flat pictogram style.
Enlist role of protein
dietary protein physiological function
protein functions in the human body NIH amino acids
Roles of proteins in the body
-
Growth and tissue repair
Build and maintain muscles, skin, hair, nails, connective tissue, and internal organs. -
Enzymes
Most enzymes are proteins that speed up chemical reactions, including digestion and energy production. -
Hormones and signaling
Some hormones and receptors are proteins or protein-derived, for example insulin, which helps regulate blood glucose. -
Immunity and defense
Antibodies, complement proteins, and many immune-cell signaling molecules help fight infections. -
Transport and storage
Proteins carry substances in blood and cells:- Hemoglobin carries oxygen.
- Albumin carries hormones, drugs, fatty acids, and helps maintain fluid balance.
- Transferrin carries iron.
-
Fluid balance
Plasma proteins, especially albumin, help keep water within blood vessels. Low albumin can contribute to edema. -
Acid-base buffering
Proteins can bind or release hydrogen ions, helping maintain normal blood pH. -
Movement
Actin and myosin enable skeletal-muscle contraction, heart contraction, and many cellular movements. -
Structure and strength
Collagen provides strength to skin, tendons, ligaments, bone, and blood vessels. Keratin forms hair, nails, and the outer skin layer. -
Blood clotting
Clotting proteins such as fibrinogen help stop bleeding after injury. -
Energy source when needed
Protein provides about 4 kcal/g. It is not the body's preferred energy store, but amino acids can be used for energy during fasting, prolonged exercise, or inadequate carbohydrate intake. -
Source of nitrogen and amino acids
Amino acids are needed to make nucleotides, neurotransmitters, creatine, glutathione, and other important molecules.
Make picto graph with daily requirements of protein , consequences when deficiency or high
dietary protein intake deficiency health outcomes
Dietary Reference Intake protein adults 0.8 g kg NIH Office Dietary Supplements protein deficiency high protein risks
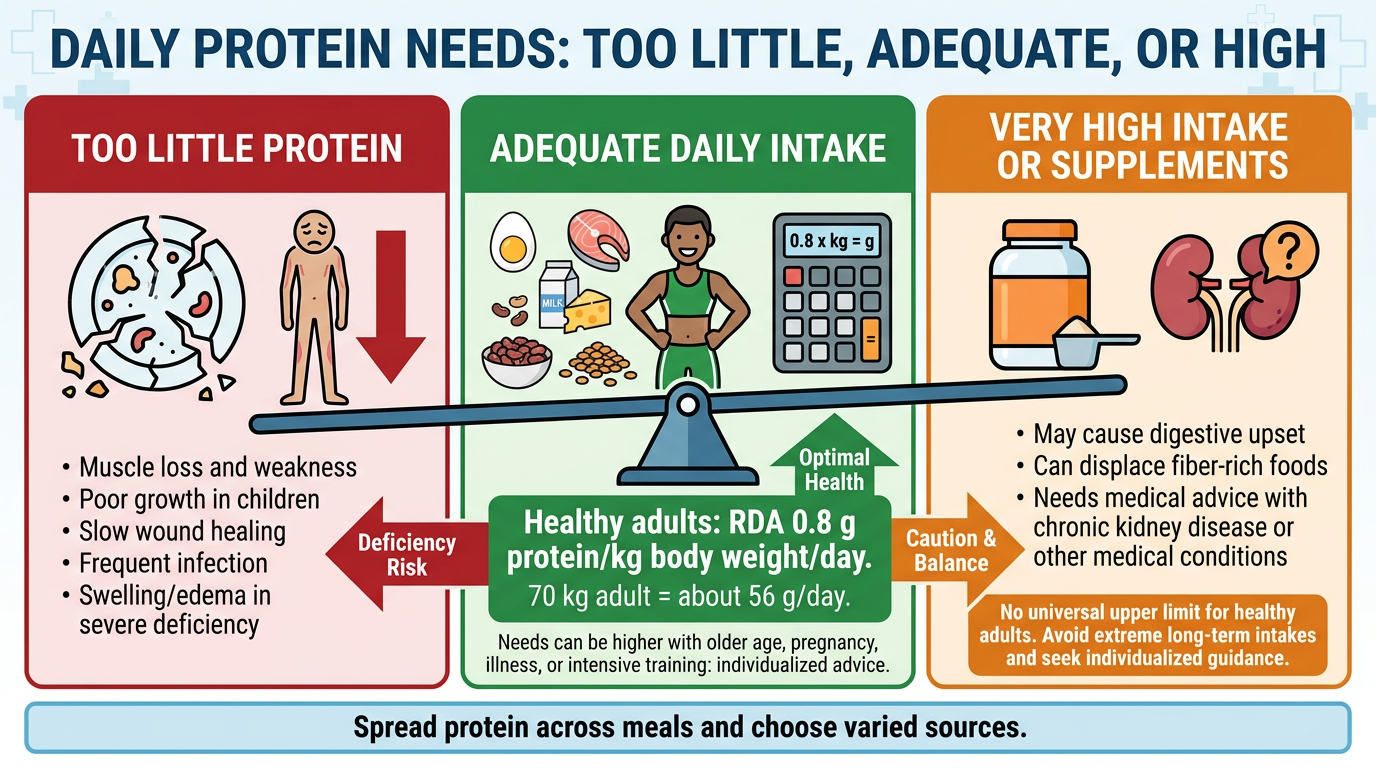
Create a HORIZONTAL LANDSCAPE 16:9 medical educational pictograph titled “DAILY PROTEIN NEEDS: TOO LITTLE, ADEQUATE, OR HIGH”. Use a clear three-column left-to-right balance scale design with big readable text. LEFT RED PANEL: “Too little protein” with broken food plate and body icons. List: muscle loss and weakness, poor growth in children, slow wound healing, frequent infection, swelling/edema in severe deficiency. CENTER GREEN PANEL: “Adequate daily intake” with healthy adult, food icons egg fish dairy beans lentils, and calculator. Large key statement: “Healthy adults: RDA 0.8 g protein/kg body weight/day.” Add calculation example: “70 kg adult = about 56 g/day.” Add small note “Needs can be higher with older age, pregnancy, illness, or intensive training: individualized advice.” RIGHT ORANGE PANEL: “Very high intake or supplements” with shake bottle and kidney icon. List: may cause digestive upset, can displace fiber-rich foods, and needs medical advice with chronic kidney disease or other medical conditions. Important balanced note: “No universal upper limit for healthy adults. Avoid extreme long-term intakes and seek individualized guidance.” Footer: “Spread protein across meals and choose varied sources.” Use scientifically cautious language, no invented toxicity thresholds, no fear-based messaging, polished professional flat pictogram style, bold arrows and minimal text.
Make pic adverse effect of excessive fatty acid intake
saturated fatty acids cardiovascular disease
American Heart Association saturated fat health effects LDL heart disease dietary guidance
Create a HORIZONTAL LANDSCAPE 16:9 medical educational pictogram titled “EXCESS FATTY ACID INTAKE: POSSIBLE ADVERSE EFFECTS”. Use a clear, scientifically balanced left-to-right flow. LEFT: food icons for fried foods, butter, fatty processed meat, pastries and large oil bottle, labelled “Frequent excess calories and saturated fat”. Center: show rising LDL-cholesterol particles and triglyceride particles in blood, plus an enlarging adipose cell, labelled “Can raise blood lipids and body-fat stores”. RIGHT: three connected body-effect panels: 1) artery with plaque -> “Atherosclerosis: higher risk of heart attack and stroke”; 2) liver with fat droplets -> “Fatty liver risk with excess energy intake”; 3) abdominal/insulin icon -> “Weight gain and insulin resistance risk”. Add a bottom balance strip: “Not all fats have the same effect: replace saturated and trans fats with unsaturated fats from nuts, seeds, fish and vegetable oils. Overall diet and energy balance matter.” Include a small warning icon: “Very high triglycerides can cause pancreatitis.” Use precise cautious language: use can and risk, not guaranteed effects. Do not imply that all fatty acids are harmful. Use clean large readable labels, bold arrows, minimal text, professional flat medical pictogram style.
- Glycolysis: glucose breakdown to make ATP.
- Gluconeogenesis: liver and kidney make glucose during fasting.
- Glycogen metabolism: glucose stored as glycogen after meals and released during fasting or exercise.
2. Adult lipid panel ranges and body effects
-
Growth and tissue repair
Build and maintain muscles, skin, hair, nails, connective tissue, and internal organs. -
Enzymes
Most enzymes are proteins that speed up chemical reactions, including digestion and energy production. -
Hormones and signaling
Some hormones and receptors are proteins or protein-derived, for example insulin, which helps regulate blood glucose. -
Immunity and defense
Antibodies, complement proteins, and many immune-cell signaling molecules help fight infections. -
Transport and storage
Proteins carry substances in blood and cells:- Hemoglobin carries oxygen.
- Albumin carries hormones, drugs, fatty acids, and helps maintain fluid balance.
- Transferrin carries iron.
-
Fluid balance
Plasma proteins, especially albumin, help keep water within blood vessels. Low albumin can contribute to edema. -
Acid-base buffering
Proteins can bind or release hydrogen ions, helping maintain normal blood pH. -
Movement
Actin and myosin enable skeletal-muscle contraction, heart contraction, and many cellular movements. -
Structure and strength
Collagen provides strength to skin, tendons, ligaments, bone, and blood vessels. Keratin forms hair, nails, and the outer skin layer. -
Blood clotting
Clotting proteins such as fibrinogen help stop bleeding after injury. -
Energy source when needed
Protein provides about 4 kcal/g. It is not the body's preferred energy store, but amino acids can be used for energy during fasting, prolonged exercise, or inadequate carbohydrate intake. -
Source of nitrogen and amino acids
Amino acids are needed to make nucleotides, neurotransmitters, creatine, glutathione, and other important molecules.
Quick answer
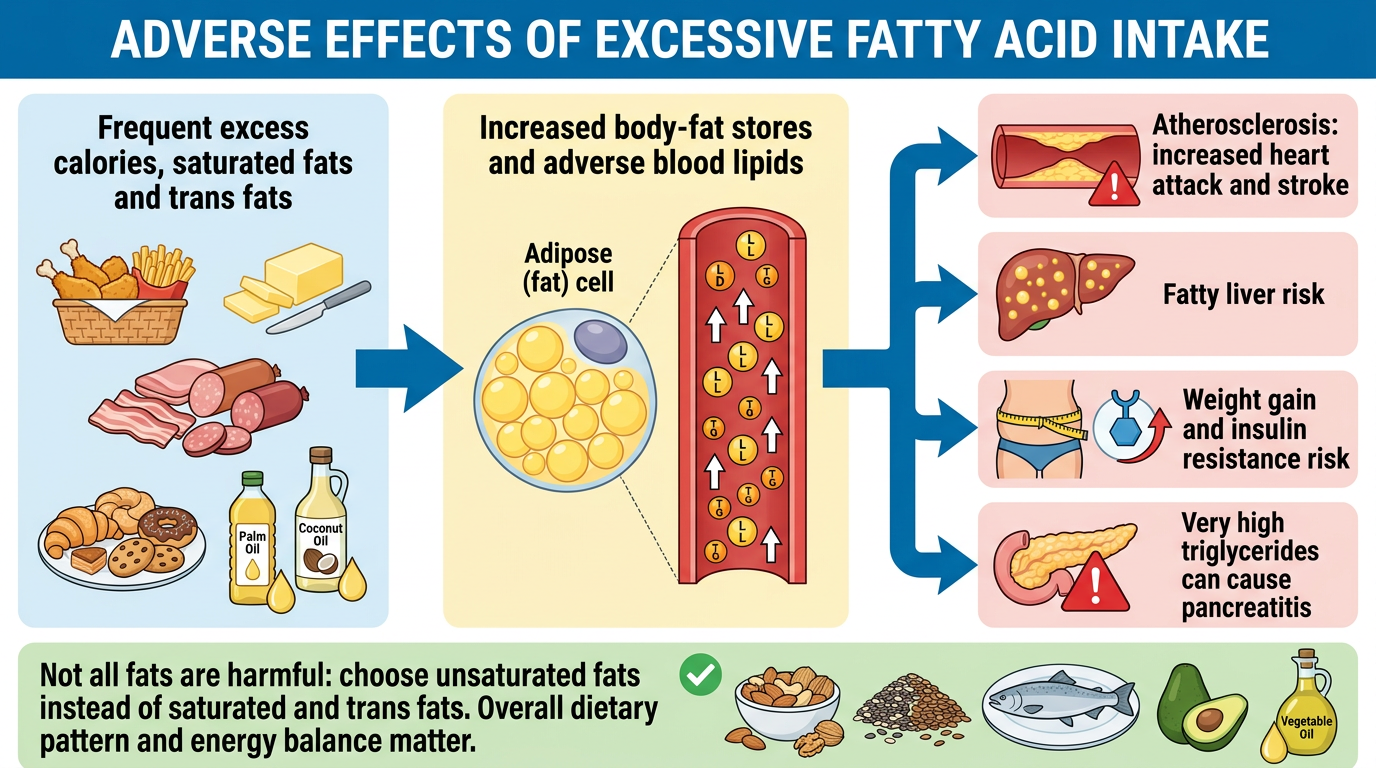
Excessive fatty acid intake: adverse effects
Frequent excess calories + saturated/trans fats
        │
        ├──> ↑ LDL cholesterol and triglycerides
        │          │
        │          └──> Artery plaque (atherosclerosis)
        │                    └──> Higher risk of heart attack and stroke
        │
        ├──> Excess fat storage
        │          └──> Weight gain and abdominal obesity
        │                    └──> Insulin resistance and type 2 diabetes risk
        │
        ├──> Fat deposition in liver
        │          └──> Fatty liver disease risk
        │
        └──> Very high triglycerides
                   └──> Acute pancreatitis risk
Make diagram of adverse effect of excessive fatty acids intake
saturated fatty acids cardiovascular disease
American Heart Association saturated fat raises LDL cardiovascular risk
Create a HORIZONTAL LANDSCAPE 16:9 medical educational diagram titled “ADVERSE EFFECTS OF EXCESSIVE FATTY ACID INTAKE”. Use a clear left-to-right infographic with bold arrows, very large readable labels, and only key steps. Left panel: fried foods, butter, processed meat, pastries, palm/coconut oil, labelled “Frequent excess calories, saturated fats and trans fats”. Center panel: enlarged adipose cell and blood vessel with rising LDL-cholesterol and triglycerides, labelled “Increased body-fat stores and adverse blood lipids”. Right panel splits into four outcome branches: 1) artery plaque -> “Atherosclerosis: increased heart attack and stroke risk”; 2) liver with fat droplets -> “Fatty liver risk”; 3) waistline and insulin icon -> “Weight gain and insulin resistance risk”; 4) pancreas warning icon -> “Very high triglycerides can cause pancreatitis”. Along the bottom include a green balance strip with food icons of nuts, seeds, fish, avocado and vegetable oil labelled “Not all fats are harmful: choose unsaturated fats instead of saturated and trans fats. Overall dietary pattern and energy balance matter.” Use cautious scientific phrasing such as can raise and increases risk, not guaranteed effects. No detailed biochemical pathways. Polished professional flat medical pictogram style.
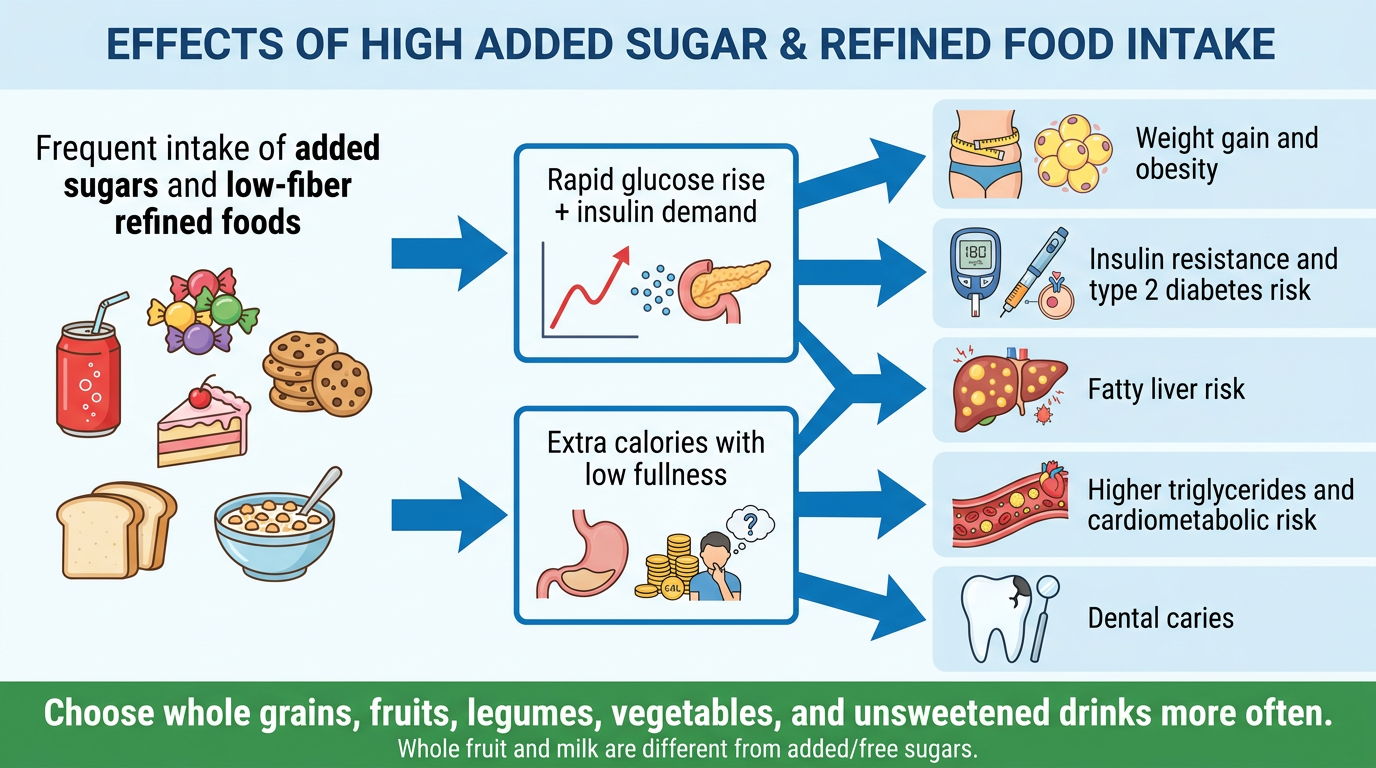
Adverse events of high sugar or refined products intake
added sugar refined carbohydrates health outcomes
WHO guideline free sugars adverse health effects obesity dental caries refined grains
Adverse effects of frequent high intake of added sugar and refined products
| Effect | Why it may occur |
|---|---|
| Weight gain and obesity | Sugary drinks, sweets, and refined snacks can add calories with little fullness. |
| Blood glucose spikes | Refined carbohydrates such as white bread, pastries, and sugary drinks are rapidly absorbed, causing repeated high blood-glucose and insulin responses. |
| Insulin resistance and type 2 diabetes risk | Long-term excess intake, especially with weight gain and low activity, can increase risk. |
| High triglycerides and low HDL-C | Excess added sugars and refined carbohydrates can worsen the lipid profile in some people. |
| Fatty liver disease | Excess energy intake, particularly from sugar-sweetened beverages, can promote liver fat accumulation. |
| Heart and stroke risk | Risk rises indirectly through obesity, diabetes, high triglycerides, and adverse cholesterol changes. |
| Dental caries | Frequent sugar exposure feeds oral bacteria, which produce acid that damages tooth enamel. |
| Low fiber and nutrient intake | Choosing refined foods instead of whole grains, fruits, legumes, and vegetables may reduce fiber, vitamins, and minerals, contributing to constipation and poorer diet quality. |
| Hunger and overeating | Low-fiber refined foods may be less filling, making it easier to overconsume calories. |
Mke diagram
Create a HORIZONTAL LANDSCAPE 16:9 educational medical diagram titled “EFFECTS OF HIGH ADDED SUGAR & REFINED FOOD INTAKE”. Use clean simple pictograms, bold left-to-right arrows, large readable labels, and only key facts. LEFT: icons of soda, candy, cookies, cake, white bread, sweetened cereal, labelled “Frequent intake of added sugars and low-fiber refined foods”. CENTER: two mechanisms: “Rapid glucose rise + insulin demand” and “Extra calories with low fullness”. RIGHT: five outcome branches with body icons: enlarged waist and adipose cells labelled “Weight gain and obesity”; insulin and glucose meter labelled “Insulin resistance and type 2 diabetes risk”; liver with fat droplets labelled “Fatty liver risk”; blood vessel with triglyceride particles labelled “Higher triglycerides and cardiometabolic risk”; tooth with cavity labelled “Dental caries”. Add a green bottom strip stating “Choose whole grains, fruits, legumes, vegetables, and unsweetened drinks more often.” Include a small precise note: “Whole fruit and milk are different from added/free sugars.” Use cautious wording like can increase risk, not certainty. Professional flat medical infographic style, no dense text, no complex pathways.