Write pdf on Tissue in situ hybridization technique in pathology using flow chart and line diagram for md pathology rguhs exam

Reading File
Reading File
Finding Sources
Searching Images

in situ hybridization ISH FISH tissue pathology technique
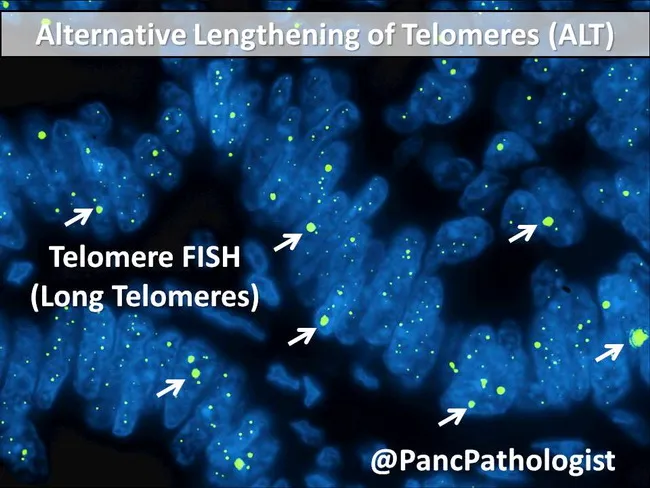
Fluorescence in situ hybridization (FISH) image of pancreatic neuroendocrine tumor tissue illustrating the alternative lengthening of telomeres (ALT) phenotype. Telomere probes labeled with green fluorescence highlight telomeric sequences within interphase nuclei on a blue DAPI counterstain, with arrows pointing to prominent ultrabright nuclear signals characteristic of ALT. This pattern reflects telomere maintenance independent of telomerase, commonly observed in PanNETs that harbor DAXX or ATRX pathway alterations and correlates with chromatin remodeling defects. The accompanying text notes that approximately 43% of PanNETs show mutually exclusive mutations in DAXX or ATRX, and that loss of their nuclear expression by immunohistochemistry can accompany ALT detected by telomere FISH. The image serves educational purposes, illustrating how ALT can be visualized in tissue sections and how telomere FISH results relate to telomere biology in endocrine pancreatic tumors. Clinically, ALT positivity and DAXX/ATRX loss are associated with distinct morphological/biological PanNET subtypes and may imply a more aggressive course, informing prognosis and potential enrollment in targeted therapy trials. The slide exemplifies telomere biology, ALT mechanism, and the practical use of Telomere FISH in diagnostic pathology. This image thus integrates genetic, epigenetic, and telomere biology concepts, bridging translational cancer genomics with routine pathology workflows and precision oncology decision-making.
Fluorescence in situ hybridization (FISH) image of pancreatic neuroendocrine tumor tissue illustrating the alternative lengthening of telomeres (ALT) phenotype. Telomere probes labeled with green fluorescence highlight telomeric sequences within interphase nuclei on a blue DAPI counterstain, with arrows pointing to prominent ultrabright nuclear signals characteristic of ALT. This pattern reflects telomere maintenance independent of telomerase, commonly observed in PanNETs that harbor DAXX or ATRX pathway alterations and correlates with chromatin remodeling defects. The accompanying text notes that approximately 43% of PanNETs show mutually exclusive mutations in DAXX or ATRX, and that loss of their nuclear expression by immunohistochemistry can accompany ALT detected by telomere FISH. The image serves educational purposes, illustrating how ALT can be visualized in tissue sections and how telomere FISH results relate to telomere biology in endocrine pancreatic tumors. Clinically, ALT positivity and DAXX/ATRX loss are associated with distinct morphological/biological PanNET subtypes and may imply a more aggressive course, informing prognosis and potential enrollment in targeted therapy trials. The slide exemplifies telomere biology, ALT mechanism, and the practical use of Telomere FISH in diagnostic pathology. This image thus integrates genetic, epigenetic, and telomere biology concepts, bridging translational cancer genomics with routine pathology workflows and precision oncology decision-making.

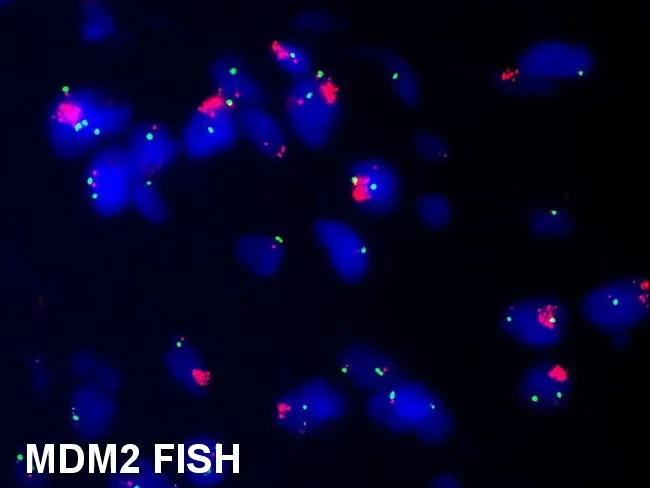
Imaging modality and technique: Fluorescence in situ hybridization (FISH) on interphase nuclei reveals MDM2 gene amplification (red) with a centromeric 12 reference signal CEP12 (green). In this case, the dual-color assay demonstrates a focal, high MDM2-to-CEP12 signal ratio consistent with amplification rather than mere polysomy; controls show intact reference signals. The specimen derives from soft tissue lipomatous tumor, most compatible with atypical lipomatous tumor/well-differentiated liposarcoma (ALT/WDL). A normal adipocytic lipoma would typically lack MDM2 amplification. Pathology: MDM2 amplification is a defining molecular hallmark that helps separate ALT/WDL and dedifferentiated liposarcoma from benign lipomatous tumors and other soft tissue sarcomas. Signal pattern: multiple red MDM2 signals co-localize with blue/green nuclei, with green CEP12 signals serving as a centromeric control. The image context emphasizes the diagnostic significance of MDM2 FISH in older patients (>50 years) with deep-seated, large, or recurrent lipomatous lesions or retroperitoneal tumors without peculiar cytology. Clinical relevance: when MDM2 amplification is demonstrated, management typically involves wide surgical excision with clear margins and surveillance for recurrence, since ALT/WDL may recur and DDLS risk rises with dedifferentiation. This assay option enhances diagnostic confidence and guides therapy decisions. Note: image credits and caption indicate courtesy of Dr. Runjan Chetty. used with permission.
Imaging modality and technique: Fluorescence in situ hybridization (FISH) on interphase nuclei reveals MDM2 gene amplification (red) with a centromeric 12 reference signal CEP12 (green). In this case, the dual-color assay demonstrates a focal, high MDM2-to-CEP12 signal ratio consistent with amplification rather than mere polysomy; controls show intact reference signals. The specimen derives from soft tissue lipomatous tumor, most compatible with atypical lipomatous tumor/well-differentiated liposarcoma (ALT/WDL). A normal adipocytic lipoma would typically lack MDM2 amplification. Pathology: MDM2 amplification is a defining molecular hallmark that helps separate ALT/WDL and dedifferentiated liposarcoma from benign lipomatous tumors and other soft tissue sarcomas. Signal pattern: multiple red MDM2 signals co-localize with blue/green nuclei, with green CEP12 signals serving as a centromeric control. The image context emphasizes the diagnostic significance of MDM2 FISH in older patients (>50 years) with deep-seated, large, or recurrent lipomatous lesions or retroperitoneal tumors without peculiar cytology. Clinical relevance: when MDM2 amplification is demonstrated, management typically involves wide surgical excision with clear margins and surveillance for recurrence, since ALT/WDL may recur and DDLS risk rises with dedifferentiation. This assay option enhances diagnostic confidence and guides therapy decisions. Note: image credits and caption indicate courtesy of Dr. Runjan Chetty. used with permission.

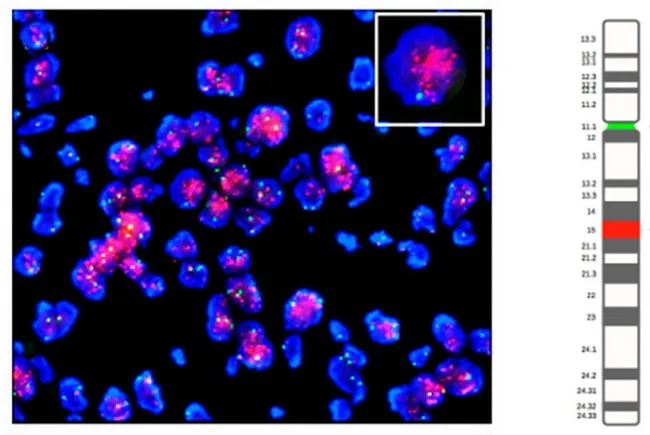
This molecular pathology image is a dual-color fluorescence in situ hybridization (FISH) study performed on FFPE soft tissue tumor tissue from a dedifferentiated liposarcoma (DLPS). The primary target probes label the MDM2 gene locus on chromosome 12q15 in red, while the reference CEP12 probe specific for the chromosome 12 centromere is shown in green. Nuclei are counterstained blue (DAPI). The image demonstrates high-level amplification of MDM2, evidenced by multiple red signals per nucleus in a background of predominantly two green CEP12 signals; some nuclei display clustered red signals, consistent with focal gene amplification typical of DLPS. The inset highlights a representative cell with prominent red MDM2 signals adjacent to green centromeric signals, illustrating signal co-localization and increased copy number. This amplification profile aligns with known oncogenic drivers of liposarcoma, particularly the 12q13-15 amplicon that also harbors CDK4 and HMGA2; GLI1 and DDIT3 may be variably overexpressed. MDM2 amplification aids diagnostic discrimination from benign lipomas and other sarcomas, and supports a diagnosis of DLPS in morphologically ambiguous cases. Potential pitfalls include signal overlap, copy-number heterogeneity, and FFPE-related artifacts; accurate interpretation requires counting multiple nuclei and cross-referencing with histology and immunohistochemistry. This image, derived from Gambella et al., demonstrates the utility and limitations of FISH for detecting MDM2 amplification in liposarcoma.
This molecular pathology image is a dual-color fluorescence in situ hybridization (FISH) study performed on FFPE soft tissue tumor tissue from a dedifferentiated liposarcoma (DLPS). The primary target probes label the MDM2 gene locus on chromosome 12q15 in red, while the reference CEP12 probe specific for the chromosome 12 centromere is shown in green. Nuclei are counterstained blue (DAPI). The image demonstrates high-level amplification of MDM2, evidenced by multiple red signals per nucleus in a background of predominantly two green CEP12 signals; some nuclei display clustered red signals, consistent with focal gene amplification typical of DLPS. The inset highlights a representative cell with prominent red MDM2 signals adjacent to green centromeric signals, illustrating signal co-localization and increased copy number. This amplification profile aligns with known oncogenic drivers of liposarcoma, particularly the 12q13-15 amplicon that also harbors CDK4 and HMGA2; GLI1 and DDIT3 may be variably overexpressed. MDM2 amplification aids diagnostic discrimination from benign lipomas and other sarcomas, and supports a diagnosis of DLPS in morphologically ambiguous cases. Potential pitfalls include signal overlap, copy-number heterogeneity, and FFPE-related artifacts; accurate interpretation requires counting multiple nuclei and cross-referencing with histology and immunohistochemistry. This image, derived from Gambella et al., demonstrates the utility and limitations of FISH for detecting MDM2 amplification in liposarcoma.

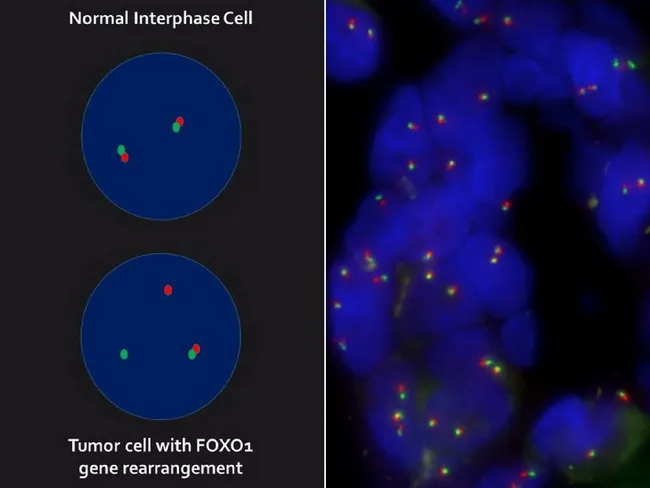
Imaging modality: Interphase Fluorescence in situ hybridization (FISH) using a FOXO1 break-apart probe on a formalin-fixed paraffin-embedded (FFPE) soft tissue tumor section with interphase nuclei. Anatomical location: alveolar rhabdomyosarcoma (ARMS) tissue, FOXO1 genetic locus at 13q14.11. In normal interphase cells, the green and red FOXO1 probe signals co-localize as fused signals, representing two non-rearranged 13q14.11 loci. In tumor cells with FOXO1 rearrangement, signal pattern changes to one green/red fusion signal (non-rearranged copy) plus one separate green signal and one separate red signal, corresponding to a rearranged allele with one break-apart. The right panel shows dispersed small signals from numerous nuclei within tumor tissue; the left panel demonstrates the contrasting patterns in normal versus tumor interphase cells. This pattern is diagnostic for FOXO1 gene rearrangements, typically resulting from PAX3-FOXO1 or PAX7-FOXO1 fusion transcripts in ARMS. The diagnostic significance: confirms molecular subtype of rhabdomyosarcoma; supports prognosis and therapeutic decisions, including risk stratification and potential targeted therapy considerations. The technique is robust for detecting cryptic rearrangements in FFPE tissues; limits include tissue quality and signal overlap. Clinical correlation with histology reveals alveolar morphology with alveolar pattern; differential diagnoses include embryonal RMS and other sarcomas lacking FOXO1 rearrangement. This image exemplifies break-apart FISH interpretation and is useful for education, quality control, and diagnostic reference.
Imaging modality: Interphase Fluorescence in situ hybridization (FISH) using a FOXO1 break-apart probe on a formalin-fixed paraffin-embedded (FFPE) soft tissue tumor section with interphase nuclei. Anatomical location: alveolar rhabdomyosarcoma (ARMS) tissue, FOXO1 genetic locus at 13q14.11. In normal interphase cells, the green and red FOXO1 probe signals co-localize as fused signals, representing two non-rearranged 13q14.11 loci. In tumor cells with FOXO1 rearrangement, signal pattern changes to one green/red fusion signal (non-rearranged copy) plus one separate green signal and one separate red signal, corresponding to a rearranged allele with one break-apart. The right panel shows dispersed small signals from numerous nuclei within tumor tissue; the left panel demonstrates the contrasting patterns in normal versus tumor interphase cells. This pattern is diagnostic for FOXO1 gene rearrangements, typically resulting from PAX3-FOXO1 or PAX7-FOXO1 fusion transcripts in ARMS. The diagnostic significance: confirms molecular subtype of rhabdomyosarcoma; supports prognosis and therapeutic decisions, including risk stratification and potential targeted therapy considerations. The technique is robust for detecting cryptic rearrangements in FFPE tissues; limits include tissue quality and signal overlap. Clinical correlation with histology reveals alveolar morphology with alveolar pattern; differential diagnoses include embryonal RMS and other sarcomas lacking FOXO1 rearrangement. This image exemplifies break-apart FISH interpretation and is useful for education, quality control, and diagnostic reference.

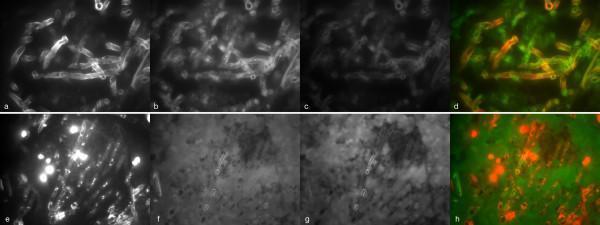
Fluorescence microscopy panels demonstrating the challenges of assessing Fluorescence In Situ Hybridization (FISH) signals in tissue specimens with invasive aspergillosis. The images are organized into two rows (a-d and e-h) across four channels: DAPI (nucleic acid stain), FITC (eukaryotic universal probe univ-SSU), Cy-3, and a composite fusion of DAPI and FITC channels. Panels a-d illustrate autofluorescence of mould hyphae, where the filamentous structures show non-specific signal in both DAPI and FITC channels, appearing as multi-colored orange and green structures in the fusion image (d). Panels e-h show high background autofluorescence from the surrounding human tissue, particularly in the FITC channel (f), which obscures the specific hybridization signals. In the DAPI channel (e), host cell nuclei are intensely stained. The composite image (h) displays red-stained nuclei against a diffuse green background. These images highlight how intrinsic fluorescence of fungal hyphae and host tissue can impair the diagnostic evaluation of ribosomal RNA probes in fungal pathology.
Fluorescence microscopy panels demonstrating the challenges of assessing Fluorescence In Situ Hybridization (FISH) signals in tissue specimens with invasive aspergillosis. The images are organized into two rows (a-d and e-h) across four channels: DAPI (nucleic acid stain), FITC (eukaryotic universal probe univ-SSU), Cy-3, and a composite fusion of DAPI and FITC channels. Panels a-d illustrate autofluorescence of mould hyphae, where the filamentous structures show non-specific signal in both DAPI and FITC channels, appearing as multi-colored orange and green structures in the fusion image (d). Panels e-h show high background autofluorescence from the surrounding human tissue, particularly in the FITC channel (f), which obscures the specific hybridization signals. In the DAPI channel (e), host cell nuclei are intensely stained. The composite image (h) displays red-stained nuclei against a diffuse green background. These images highlight how intrinsic fluorescence of fungal hyphae and host tissue can impair the diagnostic evaluation of ribosomal RNA probes in fungal pathology.

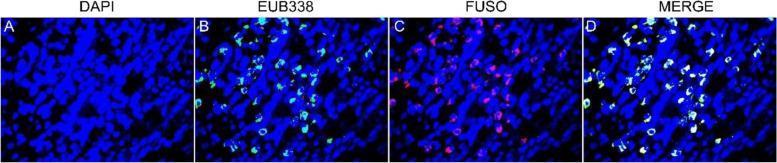
This diagnostic image series displays fluorescence in situ hybridization (FISH) micrographs of esophageal squamous cell carcinoma (ESCC) tissue specimens at 400x magnification. The panel illustrates the detection and localization of Fusobacterium nucleatum within the tumor microenvironment using specific molecular probes. Panel A shows DAPI staining, which identifies host cell nuclei in blue. Panel B adds the EUB338 universal bacterial probe, highlighting all conserved bacterial regions in green. Panel C utilizes the FUSO probe to specifically identify Fusobacterium-specific regions in red. Panel D presents a triple-stained merged image (DAPI/EUB338/FUSO), demonstrating the spatial co-localization of F. nucleatum within the broader bacterial population and its proximity to the ESCC tumor cells. This visual evidence supports the clinical finding of Fusobacterium nucleatum enrichment in esophageal malignant tissues, serving as a key educational tool for understanding microbial involvement in gastrointestinal carcinogenesis and the application of multi-color FISH in diagnostic pathology.

This diagnostic image series displays fluorescence in situ hybridization (FISH) micrographs of esophageal squamous cell carcinoma (ESCC) tissue specimens at 400x magnification. The panel illustrates the detection and localization of Fusobacterium nucleatum within the tumor microenvironment using specific molecular probes. Panel A shows DAPI staining, which identifies host cell nuclei in blue. Panel B adds the EUB338 universal bacterial probe, highlighting all conserved bacterial regions in green. Panel C utilizes the FUSO probe to specifically identify Fusobacterium-specific regions in red. Panel D presents a triple-stained merged image (DAPI/EUB338/FUSO), demonstrating the spatial co-localization of F. nucleatum within the broader bacterial population and its proximity to the ESCC tumor cells. This visual evidence supports the clinical finding of Fusobacterium nucleatum enrichment in esophageal malignant tissues, serving as a key educational tool for understanding microbial involvement in gastrointestinal carcinogenesis and the application of multi-color FISH in diagnostic pathology.

Finding Sources
Finding Sources
Your credits are exhausted. You can purchase a top-up or subscribe to a plan to continue using Orris. If you're already subscribed, your daily credits will reset tomorrow.
This is a shared conversation. Sign in to Orris to start your own chat.