stephan curve
Reading File
Finding Sources
Searching the Web
Stephan curve dental caries pH plaque
Finding Sources
Reading Web Page
Stephan curve pH plaque caries mechanism
Finding Sources
Searching Images
Stephan curve plaque pH after sugar intake dental caries
Loading Image
Finding Sources
Reading File
I now have comprehensive information. Let me compile the full answer.
The Stephan Curve
The Stephan curve is a graph that plots dental plaque pH against time after a fermentable carbohydrate challenge (typically sugar). It was first described by Dr. Robert Stephan in 1940 and remains the standard method for visualizing the cariogenic potential of foods and drinks.
Shape of the Curve
The curve has a characteristic pattern:
- Rapid fall in pH — Within 1–3 minutes of sugar exposure, oral bacteria (primarily Streptococcus mutans and lactobacilli) ferment the carbohydrate and produce lactic acid, sharply dropping plaque pH from ~7 down to 4.5–5.5.
- Nadir — pH reaches its lowest point, often below the critical pH of 5.5 (the threshold below which hydroxyapatite in enamel undergoes demineralization).
- Gradual recovery — pH slowly returns to baseline (resting ~7) over 30–60 minutes via salivary buffering and clearance of the acid.
Critical pH
- Critical pH = 5.5 (generally accepted value)
- Above 5.5 → remineralization can occur
- Below 5.5 → demineralization of enamel and dentine occurs
- Individual critical pH values vary depending on the calcium and phosphate concentration of saliva
Biochemical Basis
As detailed in Basic Medical Biochemistry (6e): bacteria in dental plaque convert dietary sugars to acid in under 20 minutes. Lactobacilli and S. mutans derive almost all their energy from anaerobic glycolysis, producing lactic acid as the end product. These bacteria are aciduric — they thrive at the very low pH they generate. The decrease in pH initiates demineralization of hydroxyapatite in tooth enamel. Other plaque bacteria also produce acetic acid and formic acid, contributing to the acidic environment.
S. mutans additionally secretes dextran (an insoluble polysaccharide), which helps form the plaque biofilm scaffold, promoting smooth-surface caries.
Clinical Significance
| Feature | Detail |
|---|---|
| Area under the curve | Represents total acid exposure (cariogenic challenge) |
| Frequency of sugar intake | Multiple exposures = repeated pH drops = prolonged demineralization |
| Salivary flow | High flow → faster pH recovery → less caries risk |
| Food consistency | Sticky/slow-clearing foods → prolonged acid production |
| Acidogenic foods | Sucrose > glucose > fructose > starch |
| Non-cariogenic sweeteners | Sorbitol, xylitol, saccharin, aspartame → no pH drop |
Factors That Modify the Curve
- Milk (protein + fat + carbohydrate) → faster pH recovery than water or juice
- Cheese → raises plaque pH (anti-cariogenic)
- Fibrous foods requiring chewing → increased salivary flow, faster acid clearance
- Fluoride → lowers the critical pH, making enamel more resistant to demineralization
- Xerostomia (dry mouth) → prolonged acid exposure, higher caries risk
Diagram — Caries Pathophysiology
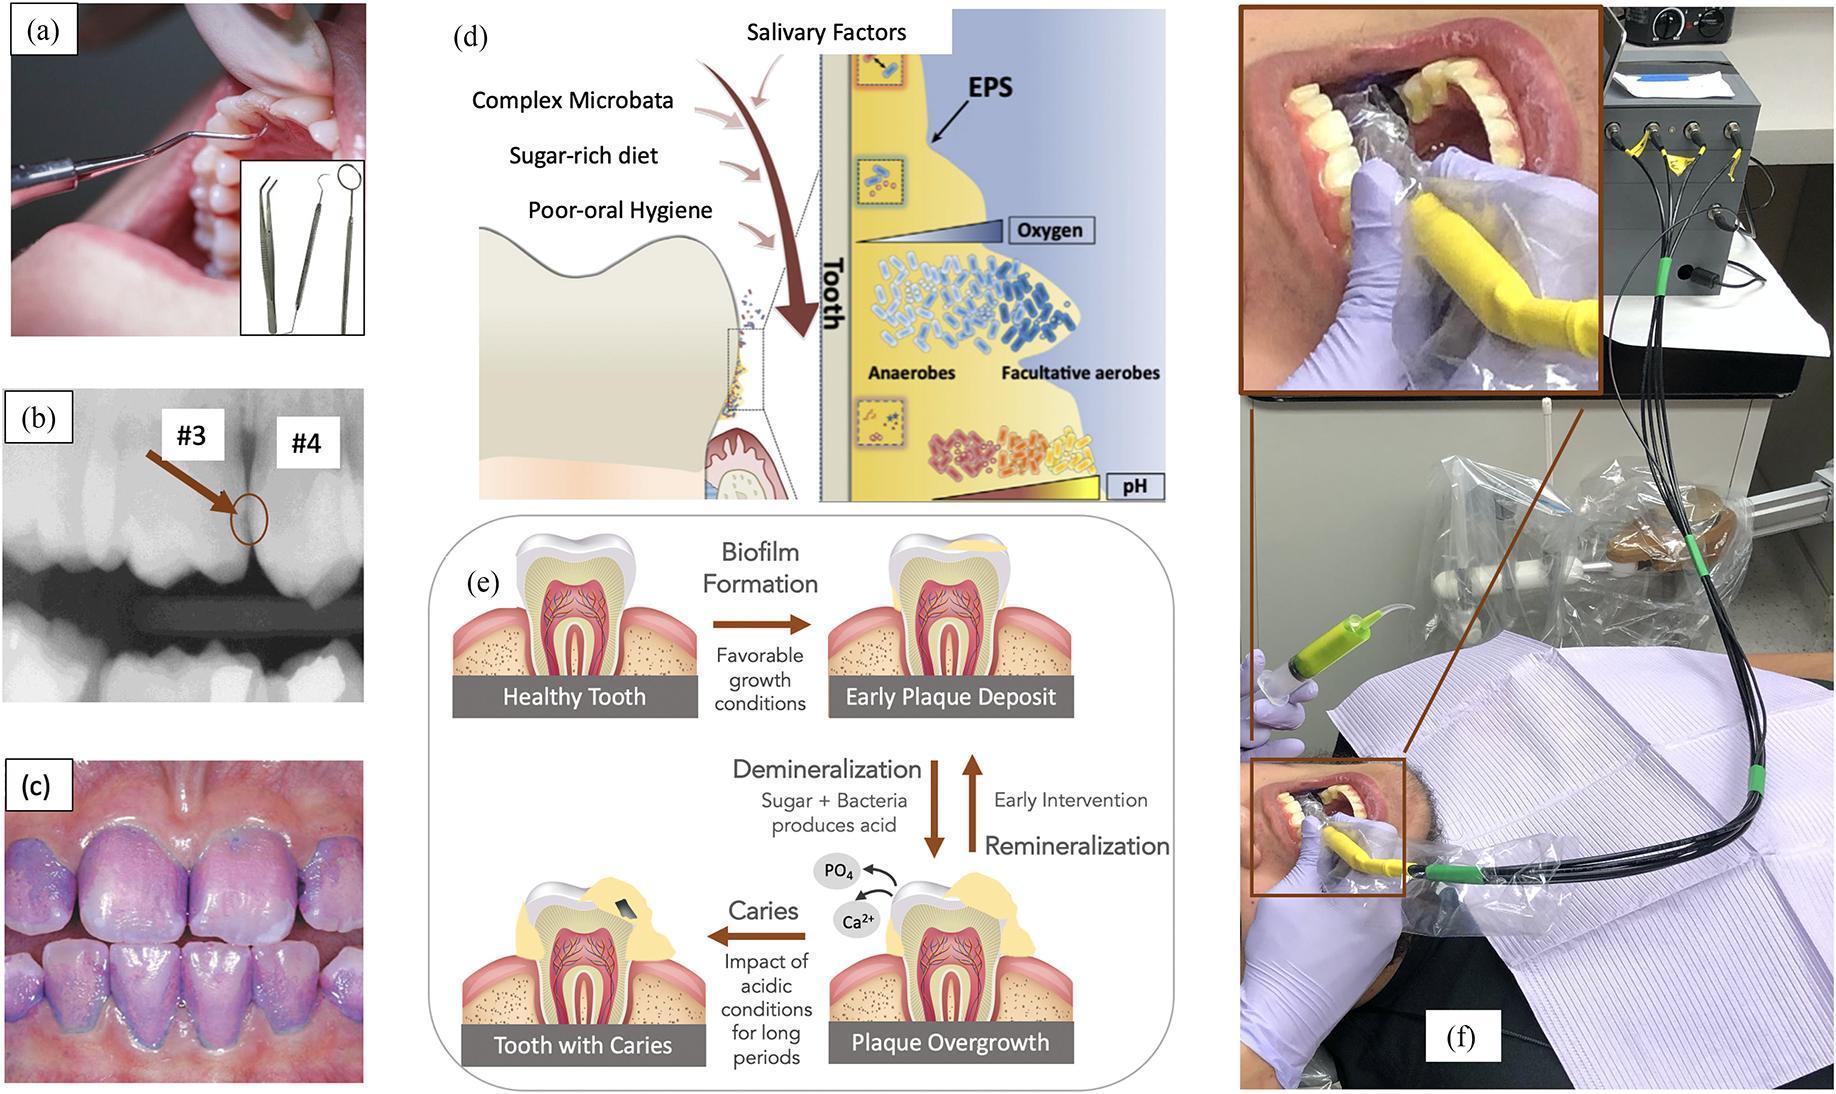
The diagram shows: sugar-rich diet + complex microbiota → biofilm overgrowth → bacterial acid production → loss of Ca²⁺ and PO₄ from enamel (demineralization) → caries. Early lesions are reversible with remineralization.
Key Takeaway
The Stephan curve teaches that caries risk is not just about the amount of sugar consumed, but frequency and duration of acid exposure. Each sugar intake resets the curve. Frequent snacking means plaque pH remains below the critical pH for prolonged periods, cumulating in net enamel loss.
Sources: Basic Medical Biochemistry — A Clinical Approach (6e); dentalcare.com CE713
This is a shared conversation. Sign in to Orris to start your own chat.