
give me image showing epidemiology of acute appendicitis from standard textbook with reference
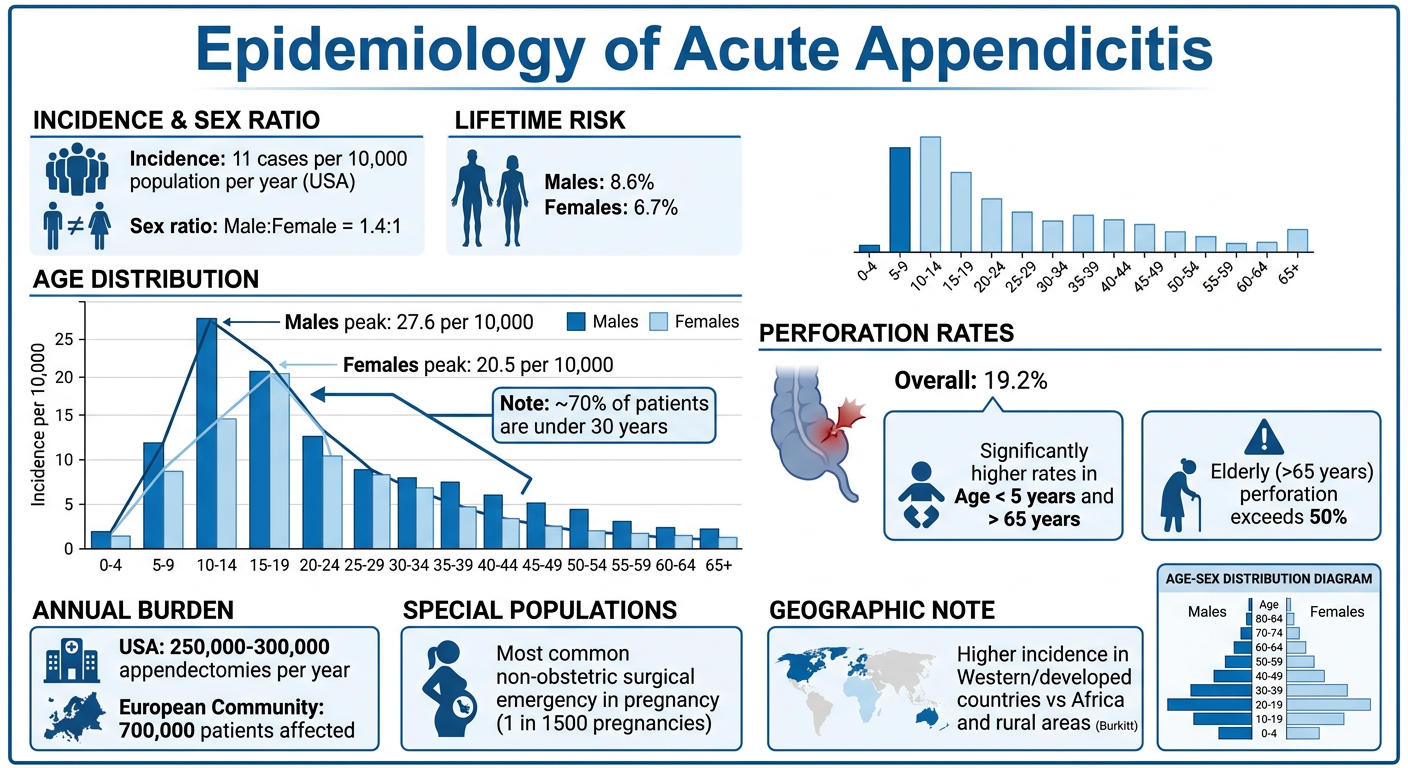
A medical infographic titled "Epidemiology of Acute Appendicitis" showing these statistics in a clean clinical layout: Incidence: 11 cases per 10,000 population per year (USA); Sex ratio: Male:Female = 1.4:1; Lifetime risk: Males 8.6%, Females 6.7%; Age distribution bar chart showing peak incidence - Males peak at 10-14 years (27.6 per 10,000), Females peak at 15-19 years (20.5 per 10,000); note that ~70% of patients are under 30 years; Perforation rates: Overall 19.2%, Age under 5 years and over 65 years have significantly higher rates, Elderly (>65 years) perforation exceeds 50%; Annual burden: 250,000-300,000 appendectomies per year in USA, 700,000 patients affected in European community; Special populations: Most common non-obstetric surgical emergency in pregnancy (1 in 1500 pregnancies); Geographic note: Higher incidence in Western/developed countries vs Africa and rural areas (Burkitt). Include a small diagram showing age-sex distribution. Professional textbook style, blue and white color scheme.
Epidemiology of Acute Appendicitis
Incidence
- 11 cases per 10,000 population per year in the United States
- Annual US burden: 250,000-300,000 appendectomies performed per year
- European community: approximately 700,000 patients affected annually (Tintinalli's Emergency Medicine)
Sex Distribution
- Slightly more common in males: Male:Female ratio = 1.4:1
- Lifetime risk: 8.6% in males, 6.7% in females
- US data from Tintinalli's estimates lifetime risk at 12% for males and 25% for females (including misdiagnosis/negative appendectomy rates)
Age Distribution
| Group | Peak Incidence |
|---|---|
| Males | 10-14 years (27.6 per 10,000) |
| Females | 15-19 years (20.5 per 10,000) |
| Overall | ~70% of patients are under 30 years |
- Most common cause of atraumatic abdominal pain in children >1 year old
- Most common non-obstetric surgical emergency in pregnancy, complicating 1 in 1,500 pregnancies
Perforation Rates
- Overall perforation rate: 19.2% of all acute appendicitis cases
- Significantly higher in patients under 5 years and over 65 years
- In patients older than 65: perforation occurs in >50% of cases
Temporal Trends (USA, 1993-2008)
- Annual rate increased from 7.62 to 9.38 per 10,000 (reversal of a previous decline)
- Rate of negative appendectomy has declined (improved imaging)
- Rate of perforation decreased between 2001-2008, though not consistently
Geographic & Socioeconomic Factors
- Higher incidence in Western/developed countries vs Africa and rural areas
- Burkitt attributed this to the Western diet - low dietary fiber, high in refined sugars and fat - leading to prolonged intestinal transit time and increased intraluminal pressure
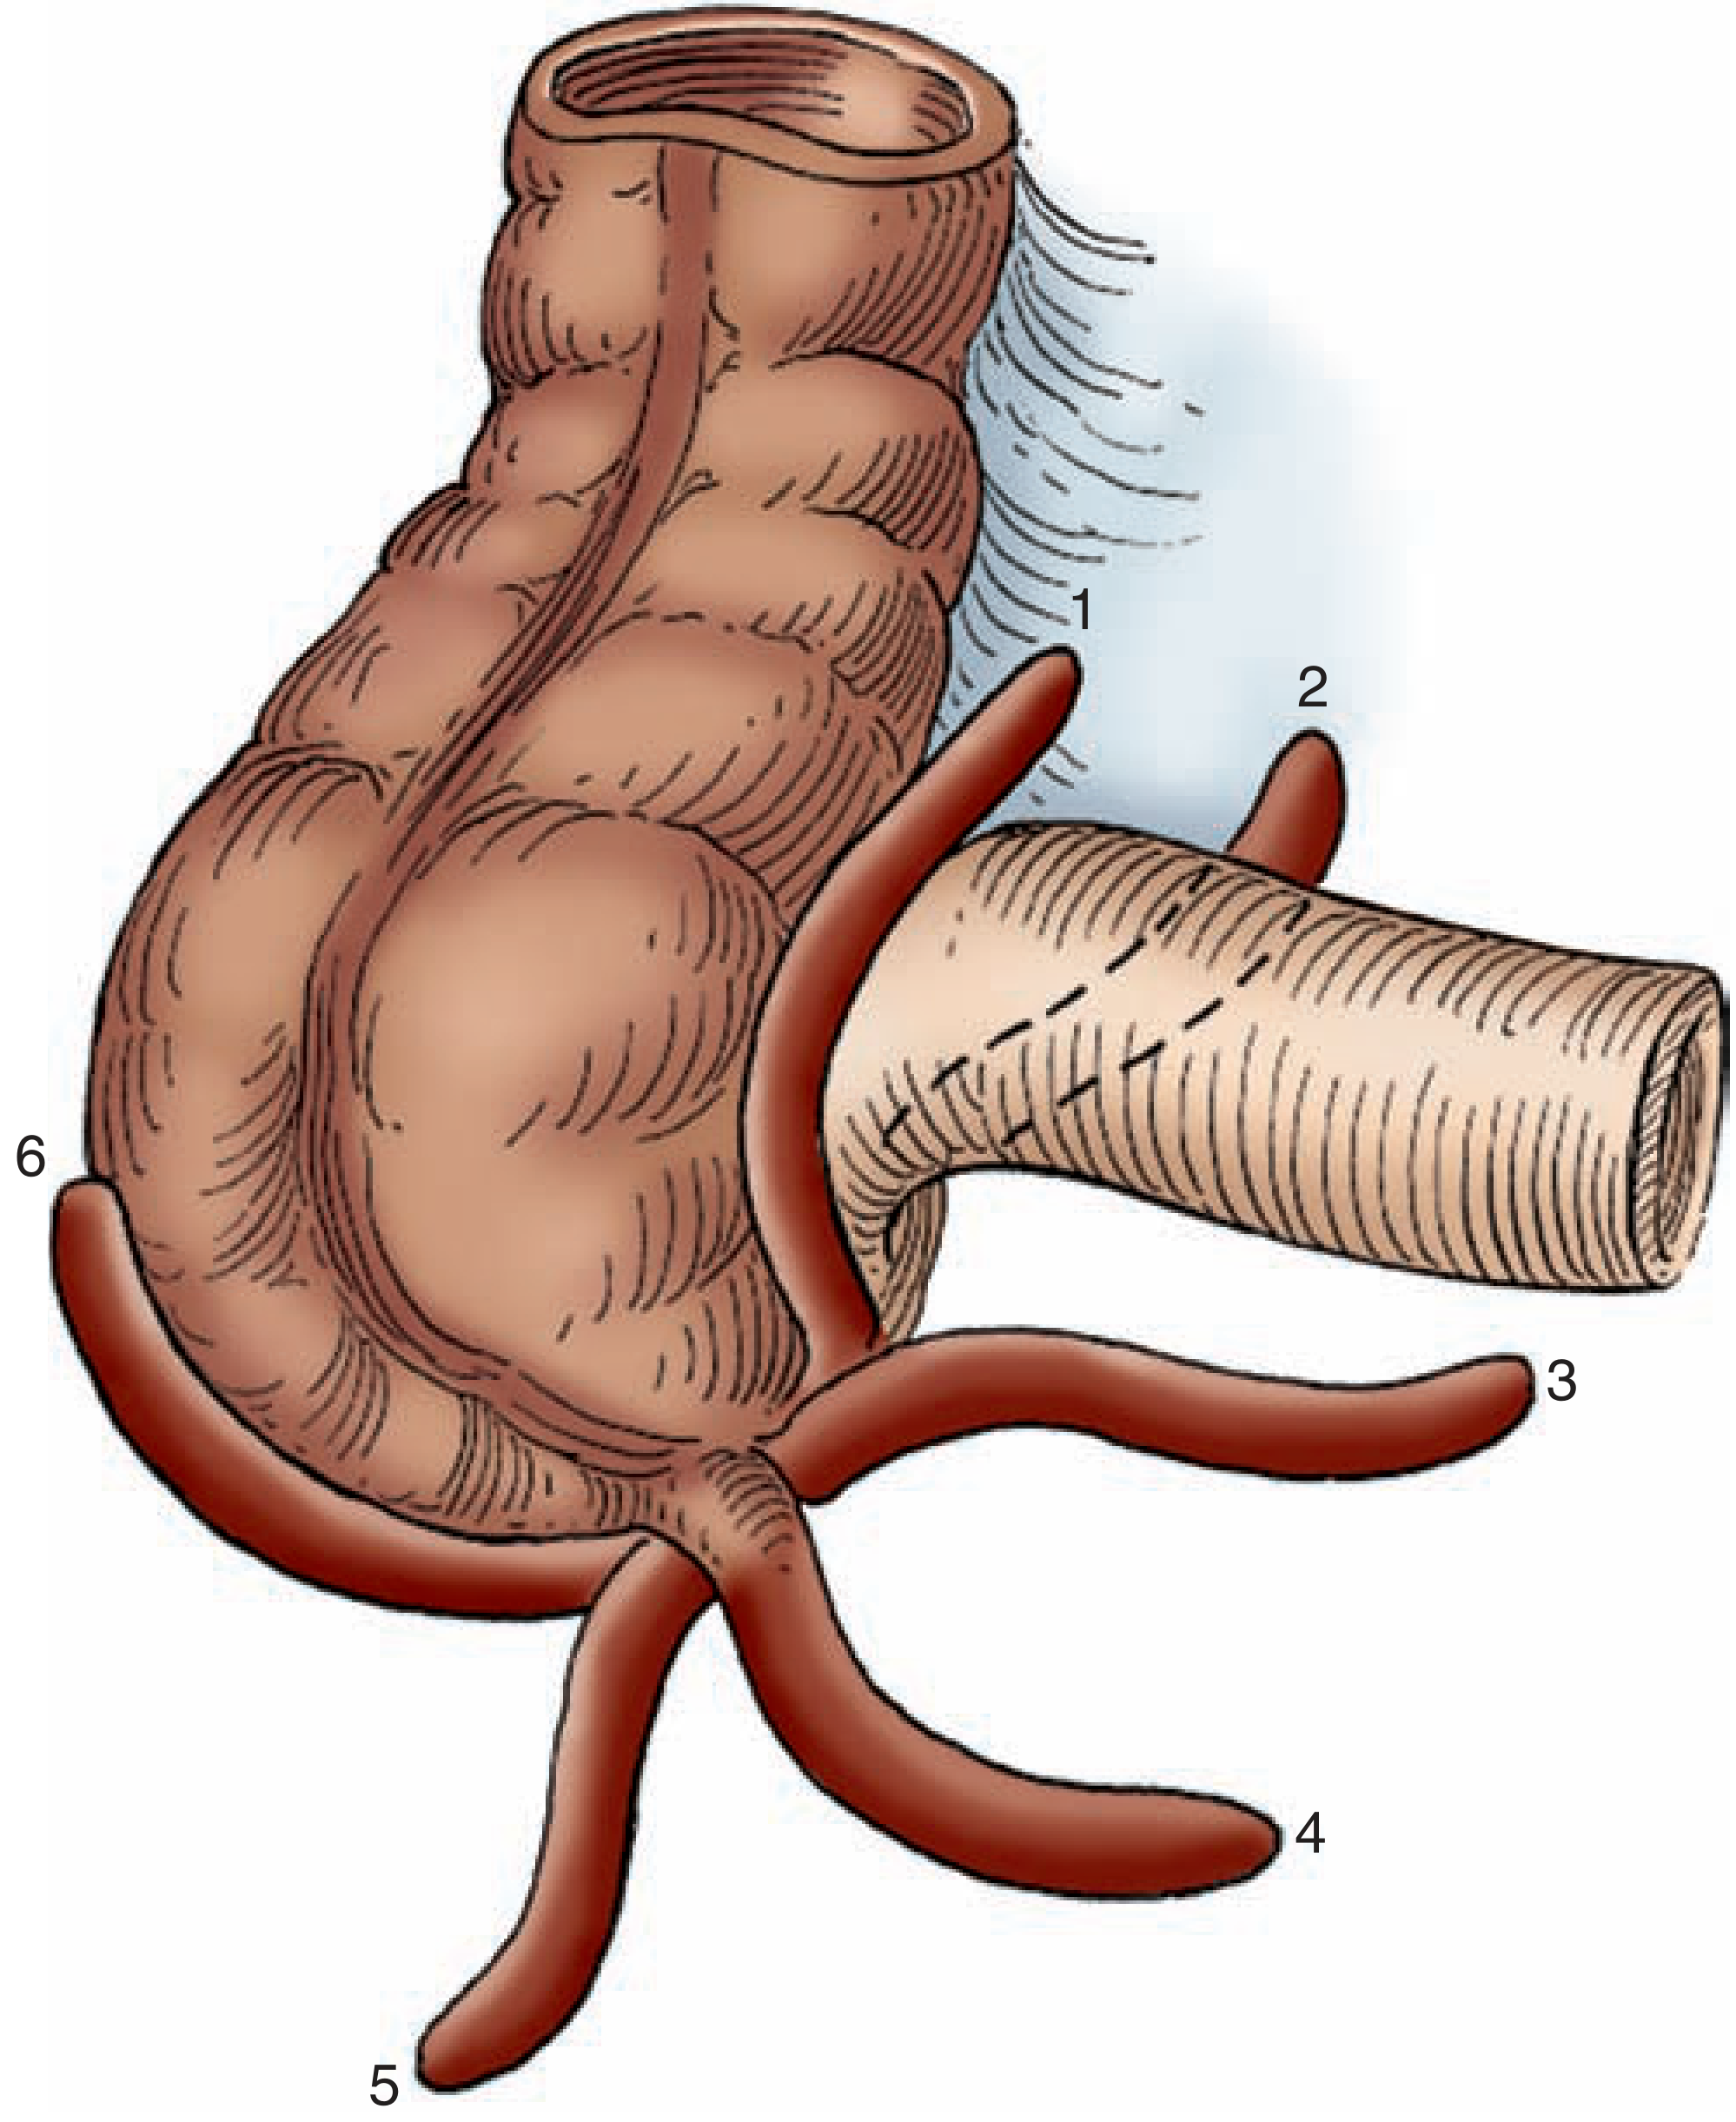
- Maingot's Abdominal Operations - Chapter 31, Acute Appendicitis, pp. 643+ (Addiss DG et al. 1990 data)
- Tintinalli's Emergency Medicine: A Comprehensive Study Guide, Chapter 81 - Acute Appendicitis, p. 333
- Burkitt DP. The aetiology of appendicitis. Br J Surg. 1971;58:695
dont generate any image just give me original image from any standard textbook or any article
"acute appendicitis" AND epidemiology AND incidence
PMID: 33533331
acute appendicitis epidemiology incidence age sex figure chart published open access PMC
https://pmc.ncbi.nlm.nih.gov/articles/PMC9945388
appendicitis global burden disease 2019 GBD figure incidence age sex site:pmc.ncbi.nlm.nih.gov OR site:bmcpublichealth.biomedcentral.com
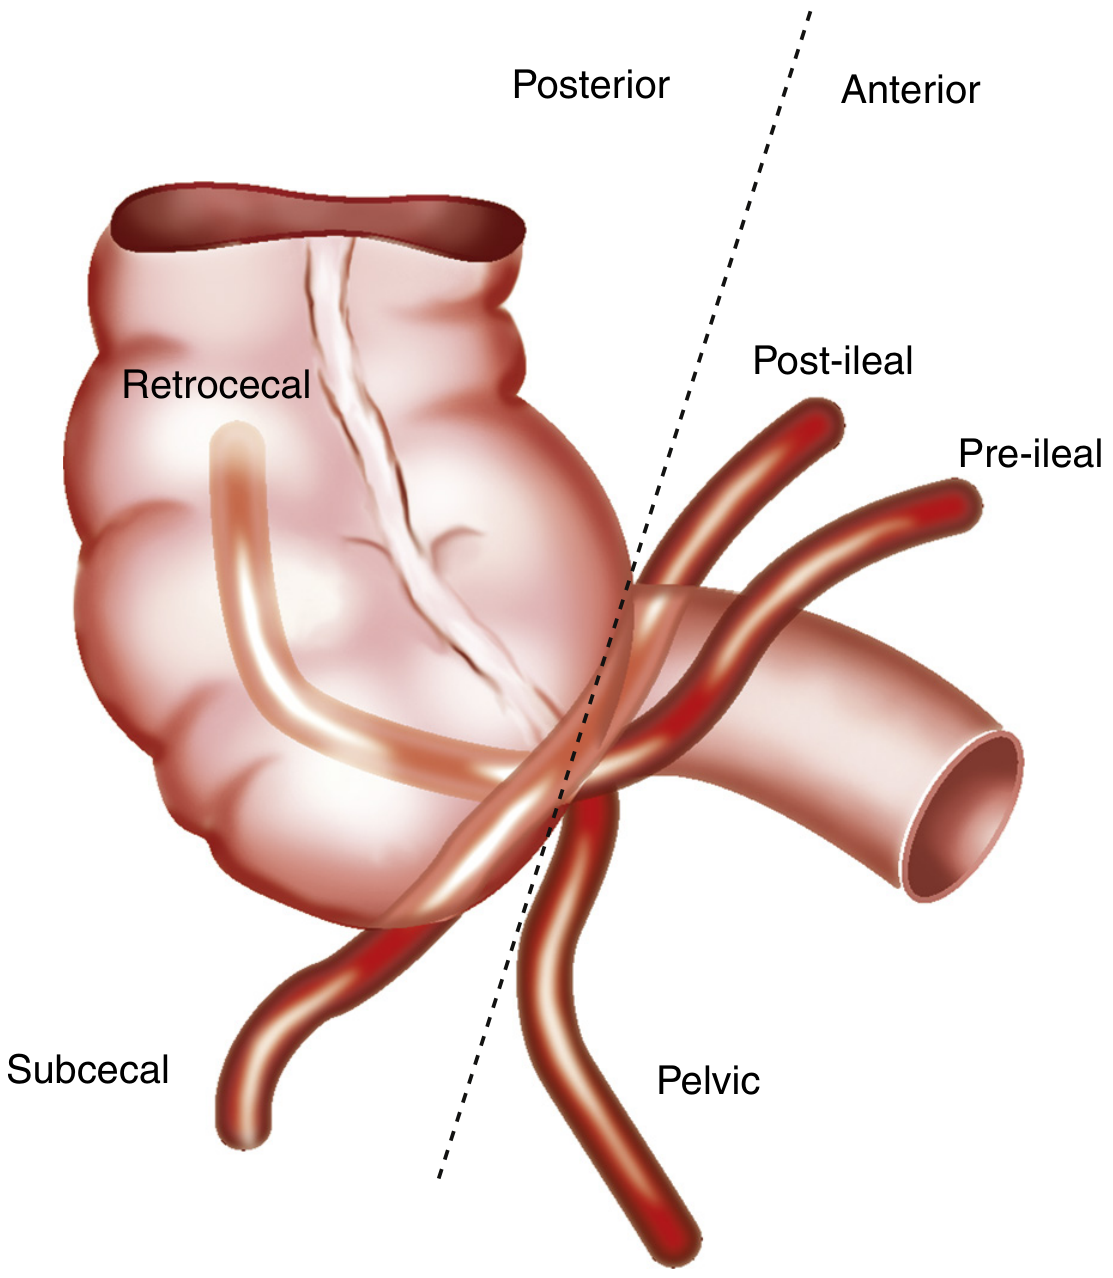
Original Textbook Image - Positions of the Appendix (Sleisenger & Fordtran's)
Why no "epidemiology chart" exists in the textbooks
Epidemiology Data (from Standard Textbooks)
| Parameter | Data |
|---|---|
| Annual incidence (USA) | 11 per 10,000 population/year |
| Annual appendectomies (USA) | ~250,000-300,000 |
| Male:Female ratio | 1.4:1 |
| Lifetime risk - males | 8.6% |
| Lifetime risk - females | 6.7% |
| Peak incidence - males | Age 10-14 years (27.6/10,000) |
| Peak incidence - females | Age 15-19 years (20.5/10,000) |
| Patients under 30 years | ~70% of all cases |
| Overall perforation rate | 19.2% |
| Perforation in elderly (>65 yrs) | >50% |
same for pathophysiology
continue
Pathophysiology of Acute Appendicitis - Original Textbook Images & Text
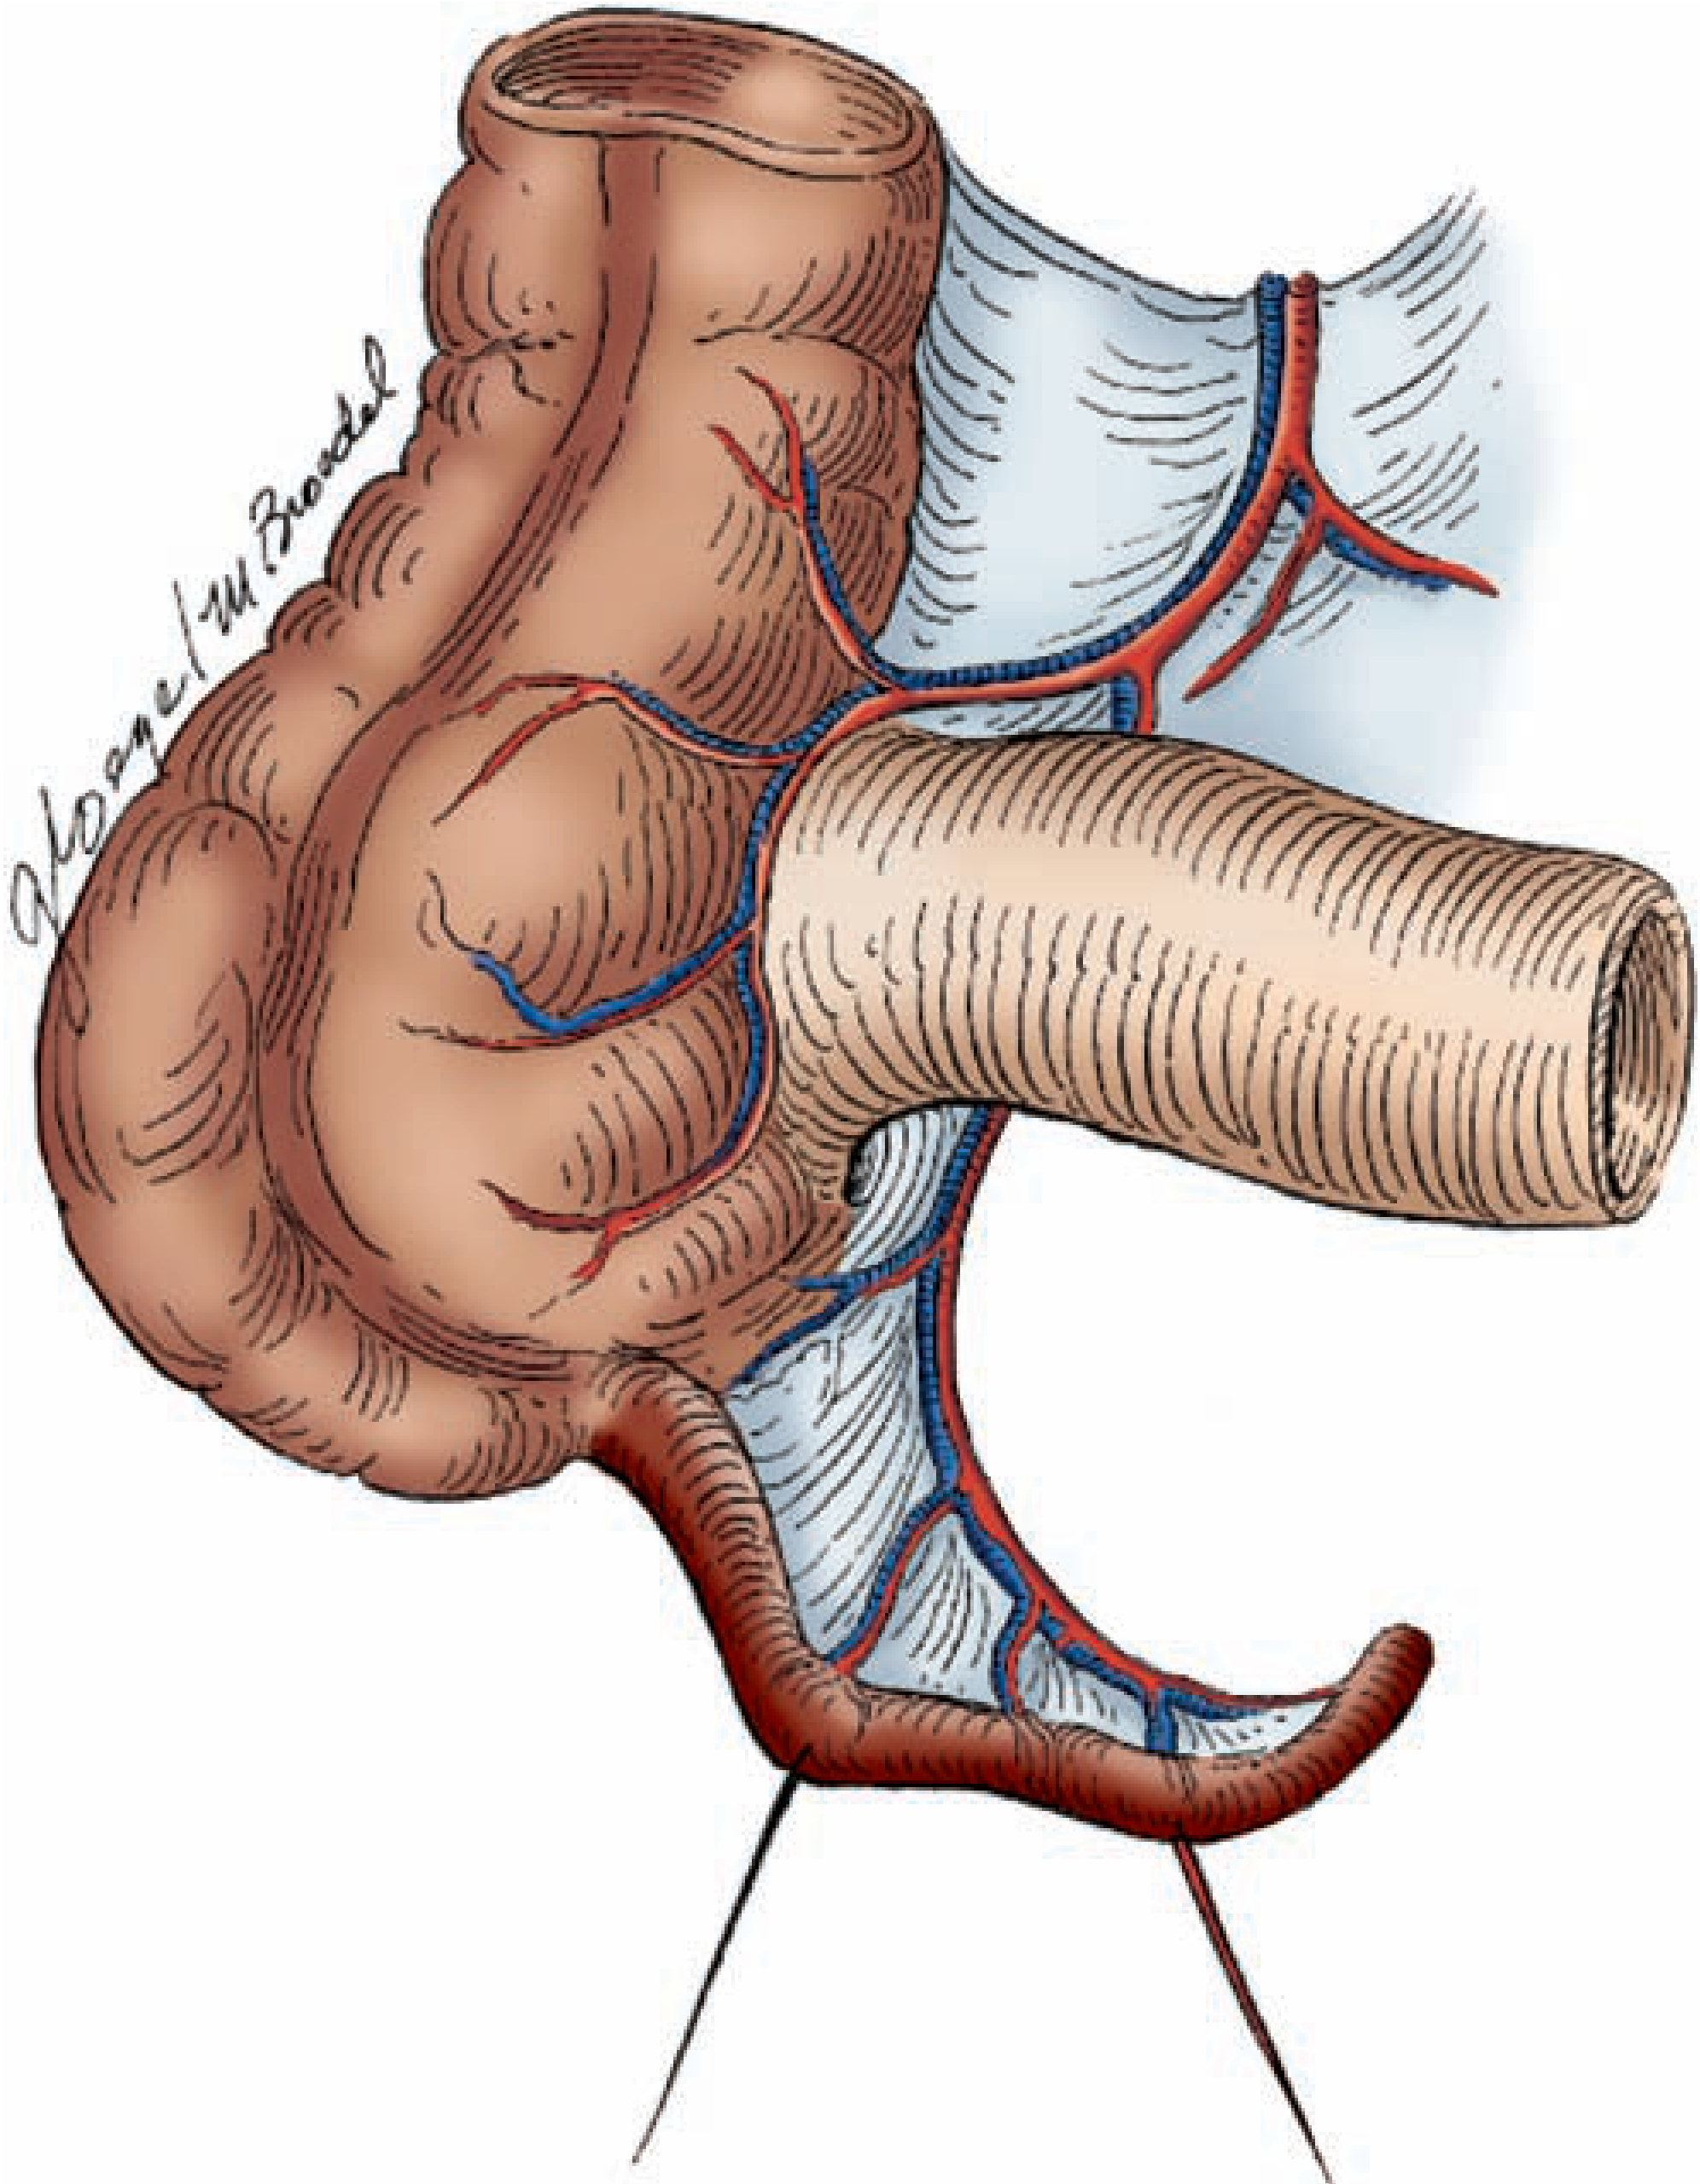
IMAGE 1 - Appendix & Arterial Supply (Maingot's, Fig. 31-2)
Pathophysiology Sequence (Bailey & Love's, Chapter 76)
- Luminal obstruction - by fecalith/appendicolith, lymphoid hyperplasia (commonest in children), tumour, parasites (Enterobius vermicularis), or foreign body
- Continued mucus secretion + inflammatory exudation → intraluminal pressure rises → lymphatic drainage obstructed
- Oedema + mucosal ulceration → bacterial translocation to submucosa
- (Resolution may occur at this point spontaneously or with antibiotics)
- Venous obstruction and ischaemia of appendix wall → bacterial invasion through muscularis propria and submucosa → acute appendicitis
- Ischaemic necrosis → gangrenous appendicitis → free bacterial contamination of peritoneal cavity
- Outcomes: (a) Omentum/small bowel wall off inflammation → phlegmon or paracaecal abscess, OR (b) Frank perforation → peritonitis + systemic sepsis
- Extremes of age - Immunosuppression - Diabetes mellitus - Faecolith obstruction - Pelvic appendix - Previous abdominal surgery
IMAGE 2 - Gross/Laparoscopic Appearance of Acute Appendicitis (Bailey & Love's, Fig. 76.6a)
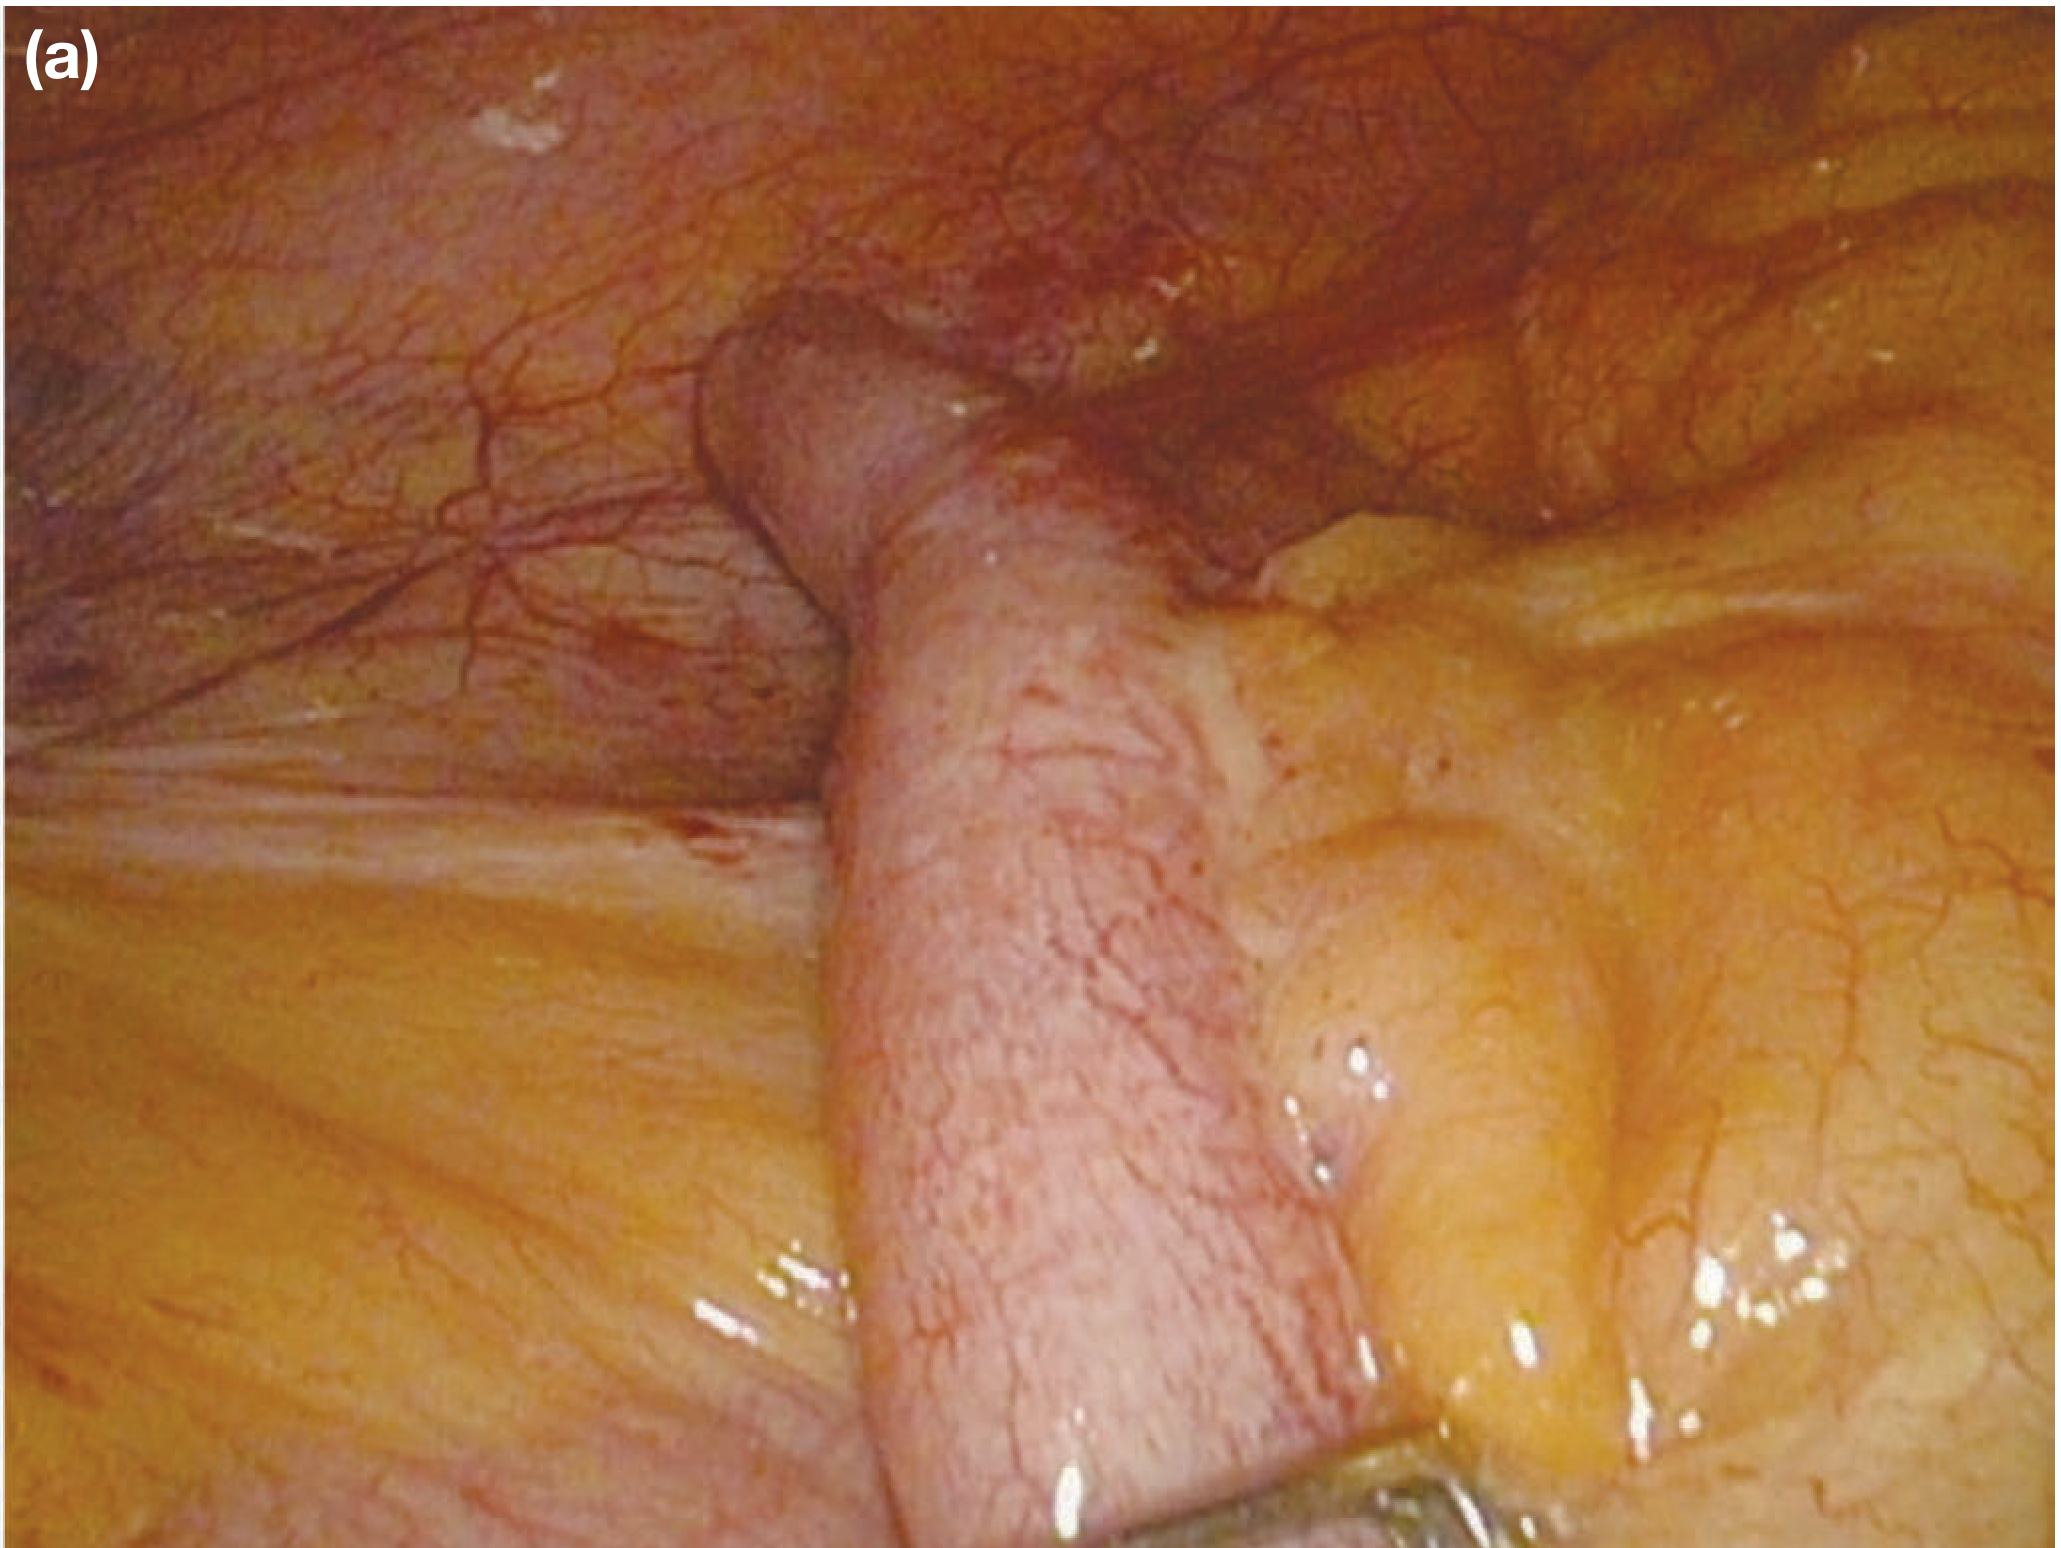
Microscopic (Histological) Features - Robbins Pathologic Basis of Disease (22nd Ed.)
"In early acute appendicitis, subserosal vessels are congested, and there is a modest perivascular neutrophilic infiltrate within all layers of the wall. The inflammatory reaction transforms the normal glistening serosa into a dull, granular, erythematous surface... diagnosis of acute appendicitis requires neutrophilic infiltration of the muscularis propria. In more severe cases a prominent neutrophilic exudate generates a serosal fibrinopurulent reaction. As the process continues, focal abscesses may form within the wall (acute suppurative appendicitis)... Further compromise of appendiceal vessels can result in ischemia, hemorrhagic ulceration, and gangrenous necrosis that extends to the serosa, creating acute gangrenous appendicitis, which can be followed by rupture and suppurative peritonitis."
| Stage | Histological Hallmark |
|---|---|
| Early acute | Neutrophilic infiltrate in muscularis propria; congested subserosal vessels |
| Suppurative (acute) | Focal intramural abscesses; fibrinopurulent serosal exudate |
| Gangrenous | Transmural inflammation; focal mural necrosis; prominent vascular thrombosis |
| Perforated | Breached wall integrity; intraperitoneal spillage; peritonitis |
IMAGE 3 - Ultrasound of Acute Appendicitis (Maingot's, Fig. 31-3)
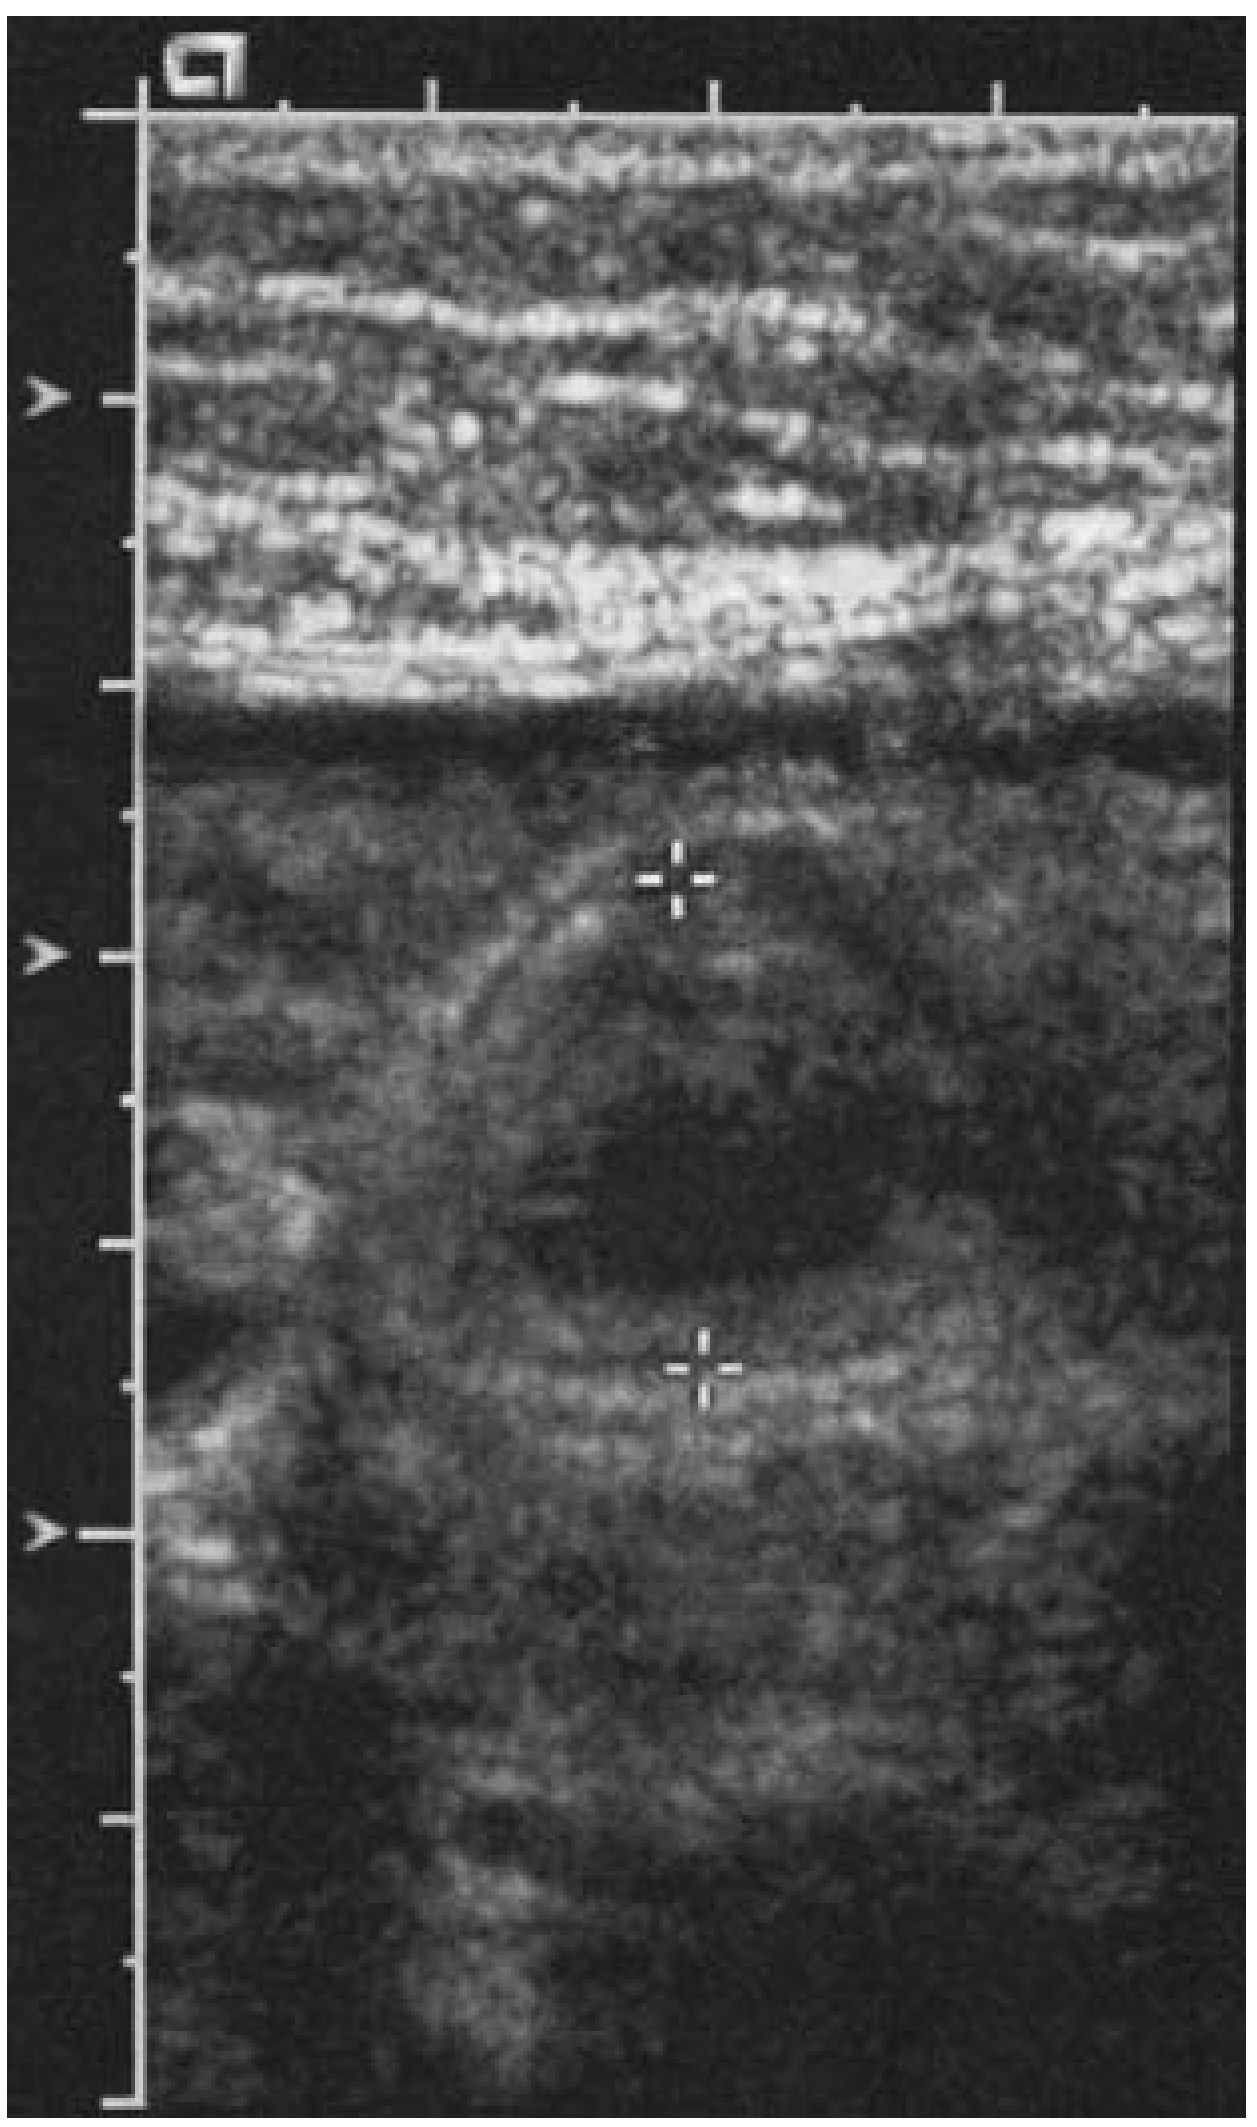
IMAGE 4 - CT of Acute Appendicitis (Maingot's, Fig. 31-4)
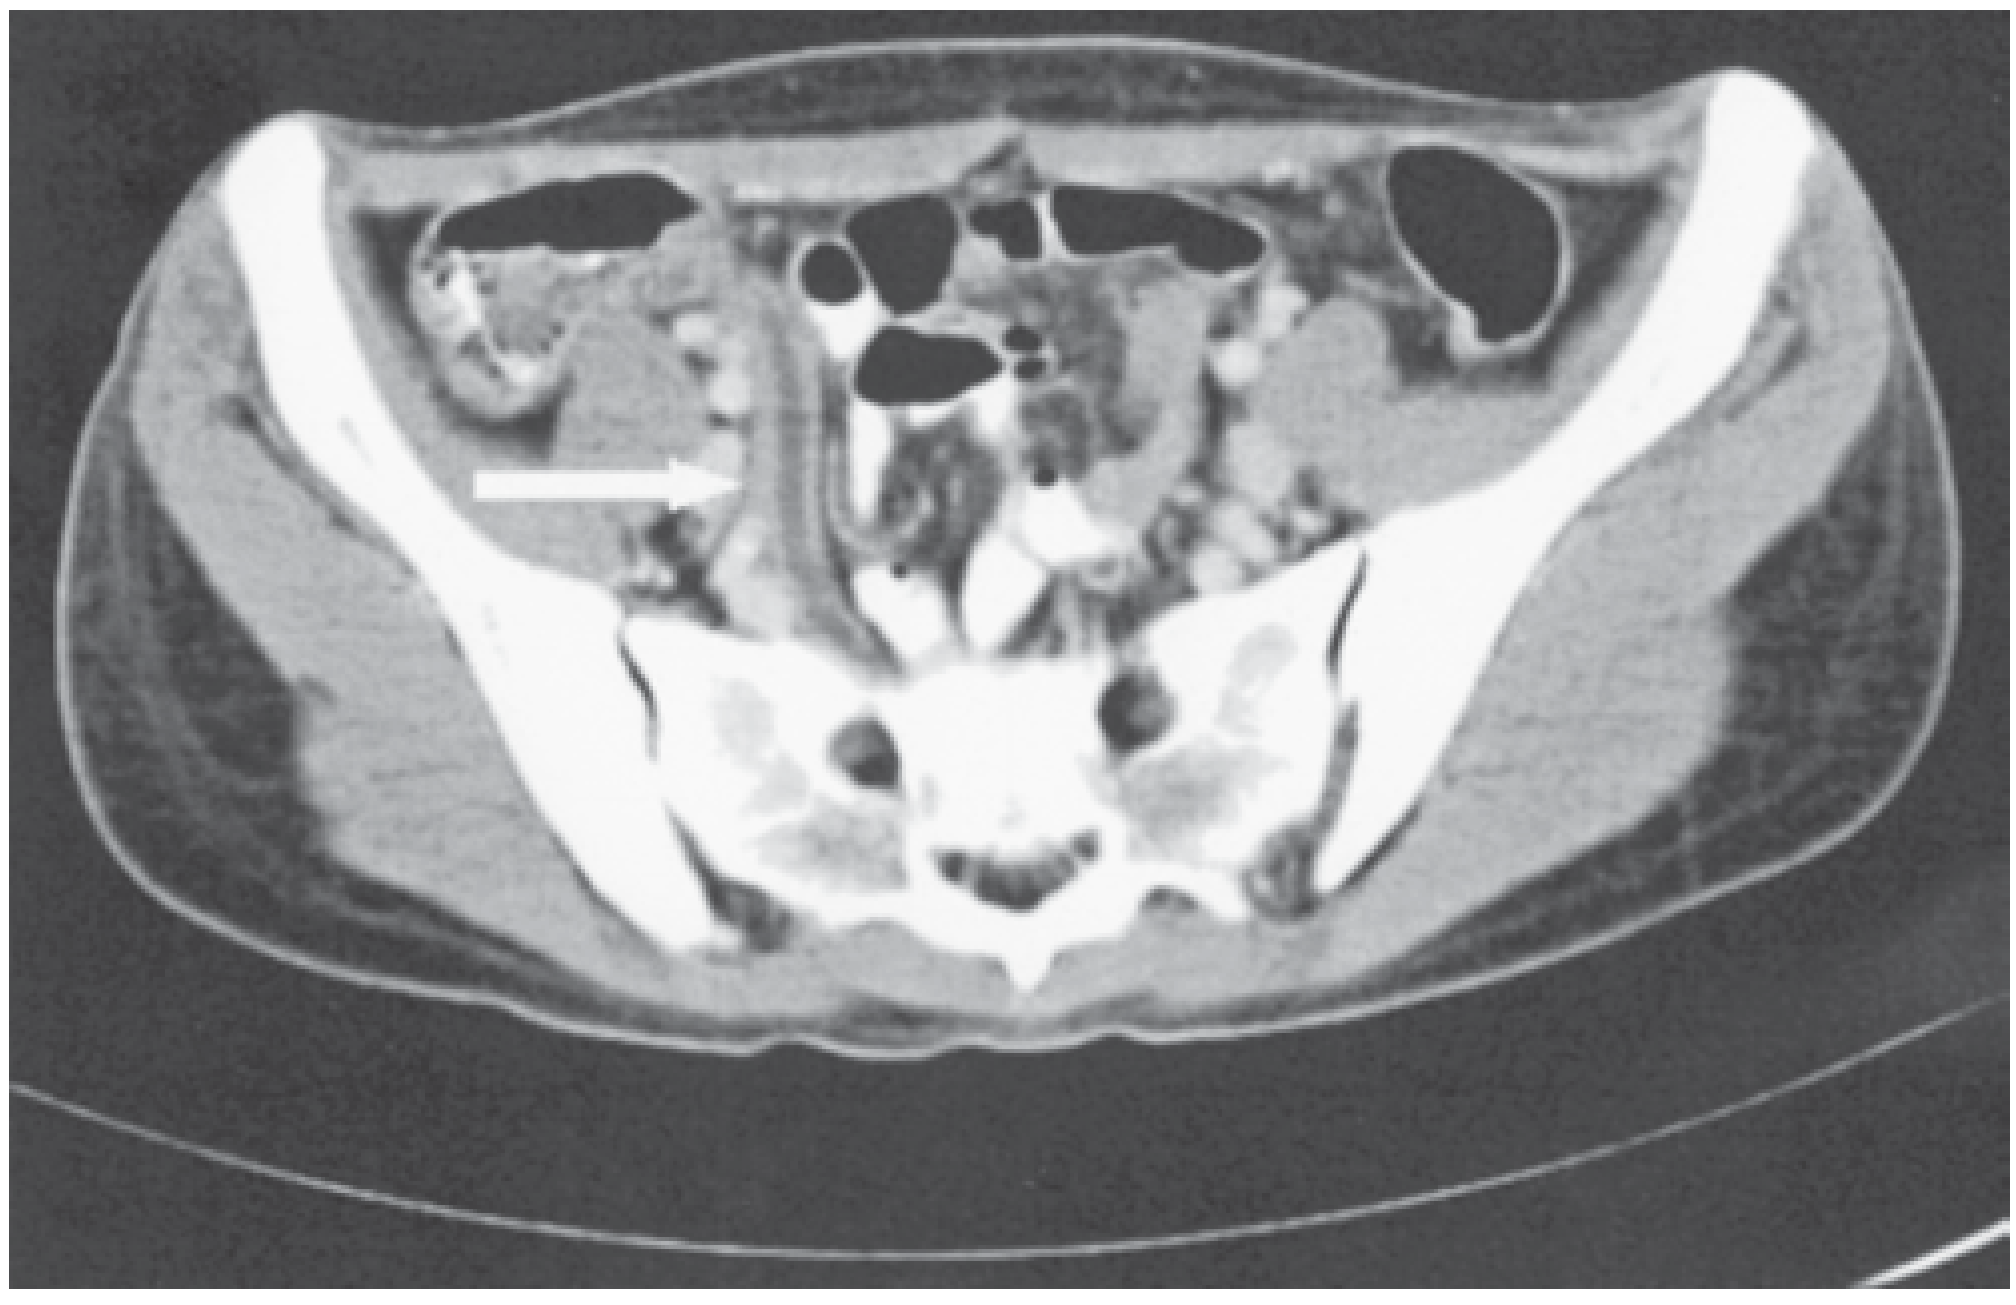
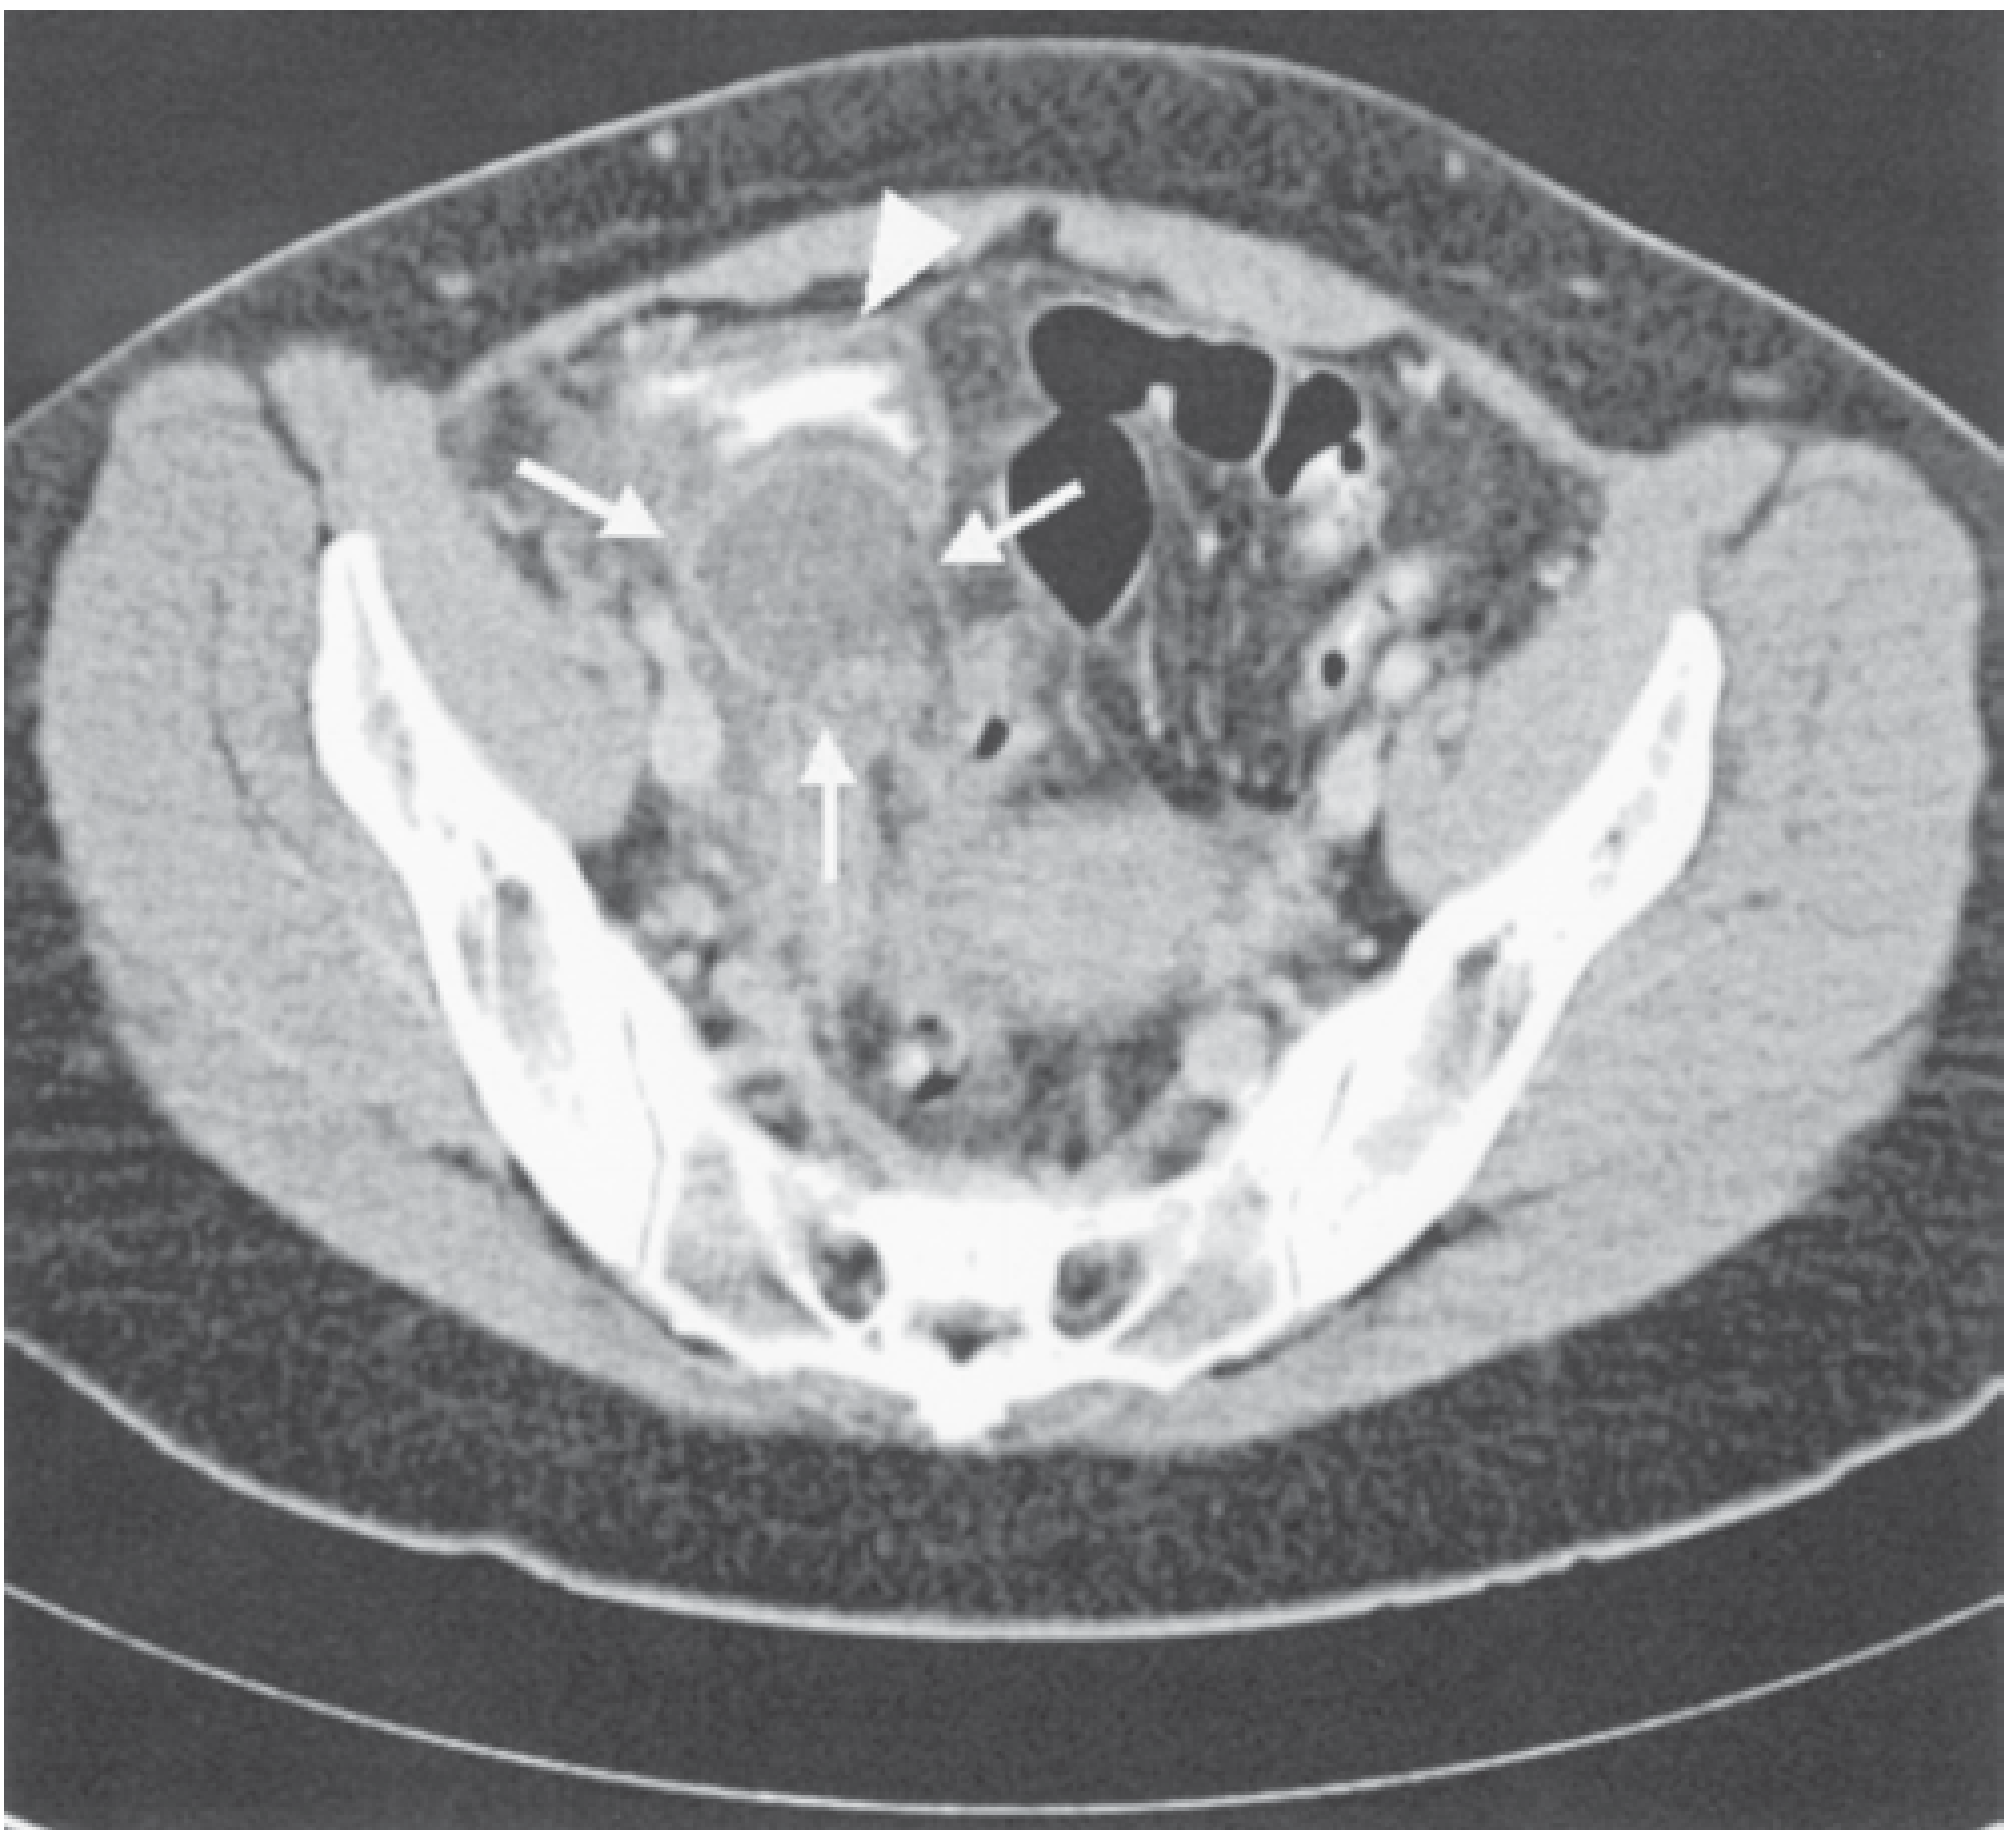
IMAGE 5 - CT of Perforated Appendicitis with Abscess (Maingot's, Fig. 31-5)
Pathophysiology Summary
"Obstruction of the appendiceal lumen causes an increase in the intraluminal pressure. As per the Law of Laplace, this increased pressure leads to an increase in wall tension with a resultant decrease in venous return. This leads to venous and lymphatic outflow obstruction → tissue ischaemia → inflammation → eventual necrosis and perforation. Intraluminal bacteria translocate beyond the mucosa, further potentiating the inflammatory process... The end result is transmural necrosis and perforation which may lead to intraperitoneal spillage, abscess, diffuse peritonitis, and potentially systemic sepsis."