Explain me 10 common heart diseases with ecg changes and ecg images of those diseases
Reading File
Finding Sources
Finding Sources
Reading File
Finding Sources
Finding Sources
Reading File
Finding Sources
Finding Sources
Reading File
Reading File
Finding Sources
Reading File
Finding Sources
Searching Images
ECG electrocardiogram myocardial infarction ST elevation
Searching Images
atrial fibrillation ECG irregularly irregular rhythm no P waves
Searching Images
complete heart block third degree AV block ECG
Searching Images
ventricular tachycardia ECG wide QRS complex
Searching Images
Wolff-Parkinson-White WPW syndrome ECG delta wave short PR interval
Searching Images
left ventricular hypertrophy ECG high voltage Sokolow criteria
Searching Images
hypertrophic cardiomyopathy ECG deep Q waves LVH
Searching Images
pulmonary embolism ECG right heart strain S1Q3T3 pattern
Searching Images
pericarditis ECG saddle-shaped ST elevation PR depression
Searching Images
Brugada syndrome ECG coved ST elevation V1 V2 V3
Here is a comprehensive overview of 10 common heart diseases, their ECG changes, and representative ECG images from the medical literature.
10 Common Heart Diseases: ECG Changes & Images
1. 🫀 ST-Elevation Myocardial Infarction (STEMI)
ECG Changes
- Hyperacute T waves — earliest sign; tall, broad, peaked T waves in ischemic territory
- ST-segment elevation ≥1 mm in ≥2 contiguous leads (≥2 mm in V1–V3); convex ("tombstone") morphology in severe cases
- Reciprocal ST depression in opposing leads (e.g., inferior STEMI → reciprocal changes in aVL)
- Pathological Q waves — develop within hours as necrosis progresses; width >40 ms, depth >25% of R wave
- T-wave inversion in evolving phase
- R-wave loss in anterior STEMI
Lead Localization:
| Territory | Leads with ST Elevation | Culprit Artery |
|---|---|---|
| Anterior | V1–V4 | LAD |
| Inferior | II, III, aVF | RCA |
| Lateral | I, aVL, V5–V6 | LCx |
| Posterior | Reciprocal tall R + ST depression in V1–V3 | RCA/LCx |
Source: Harrison's Principles of Internal Medicine 22E, Fig. 247-13; Tintinalli's Emergency Medicine
2. 🫀 Non-ST-Elevation Myocardial Infarction / Unstable Angina (NSTEMI/UA)
ECG Changes
- ST-segment depression (horizontal or downsloping) ≥0.5–1 mm in ≥2 contiguous leads
- Deep symmetrical T-wave inversions in precordial leads (especially V1–V4 in LAD disease)
- Wellens' T wave sign — deep biphasic or inverted T waves in V2–V3 indicating critical LAD stenosis
- No pathological Q waves (subendocardial pattern)
- ECG may be normal in up to 6% of confirmed NSTEMI cases
- Transient ST elevation may occur in Prinzmetal (vasospastic) angina
Source: Harrison's Principles of Internal Medicine 22E; Tintinalli's Emergency Medicine
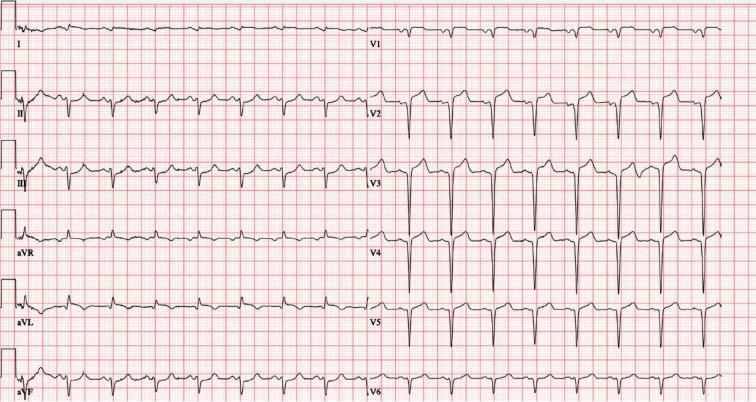
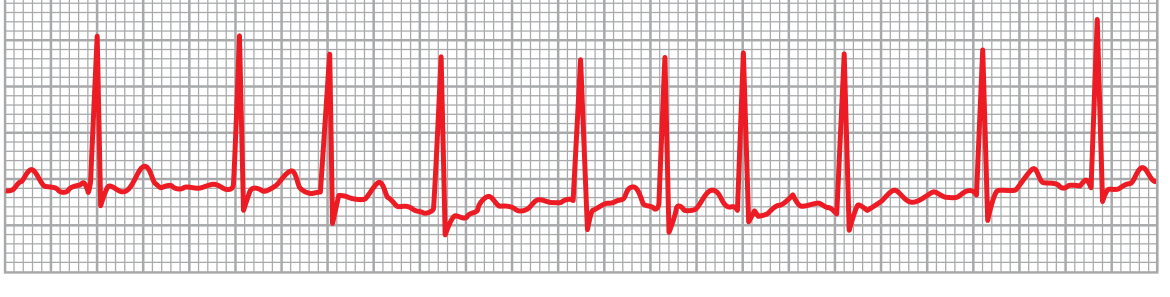
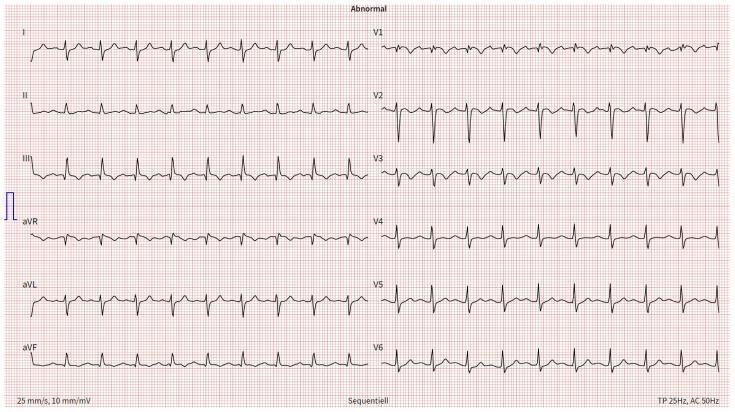
3. 🫀 Atrial Fibrillation (AF)
ECG Changes
- Absent P waves — replaced by continuous, chaotic fibrillatory (f) waves, best seen in V1 and lead II
- Irregularly irregular R-R intervals — the hallmark
- Narrow QRS complexes (unless aberrant conduction or bundle branch block)
- Baseline may show fine (>350/min) or coarse (<350/min) fibrillation
- Heart rate typically 100–180 bpm (uncontrolled)
- Fibrillatory waves most prominent in lead V1
Source: Guyton & Hall Textbook of Medical Physiology; Tintinalli's Emergency Medicine
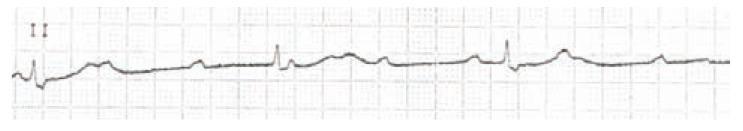
4. 🫀 Complete (Third-Degree) Heart Block
ECG Changes
- Complete AV dissociation — P waves and QRS complexes are totally independent
- P waves march through QRS complexes at their own regular rate (faster atrial rate)
- Ventricular escape rhythm is slow and regular:
- Junctional escape: narrow QRS, rate 40–60 bpm
- Ventricular escape: wide QRS (>120 ms), rate 20–40 bpm
- No fixed PR interval — PRs vary constantly
- Secondary ST-T changes in ventricular leads
- First-degree AV block: PR >200 ms; Second-degree (Mobitz I/II): progressive PR lengthening or dropped beats
Source: Fuster & Hurst's The Heart; Ganong's Review of Medical Physiology
5. 🫀 Ventricular Tachycardia (VT)
ECG Changes
- Wide QRS tachycardia (>120 ms), rate 100–250 bpm
- Regular rhythm (monomorphic VT) or irregular morphology (polymorphic VT)
- AV dissociation — P waves independent of QRS (pathognomonic when seen)
- Fusion beats and capture beats (narrow QRS "interruptions") are diagnostic
- Concordance in precordial leads (all QRS positive or all negative)
- Northwest axis (negative in I and aVF) strongly suggests VT
- Torsades de Pointes (polymorphic VT): twisting QRS axis around isoelectric line, associated with prolonged QT
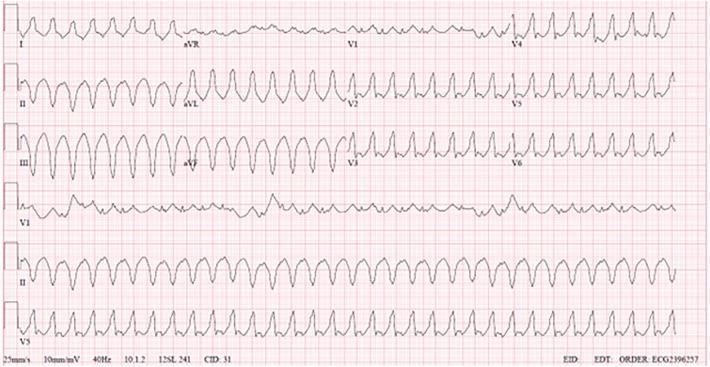
Source: Tintinalli's Emergency Medicine; Goldman-Cecil Medicine
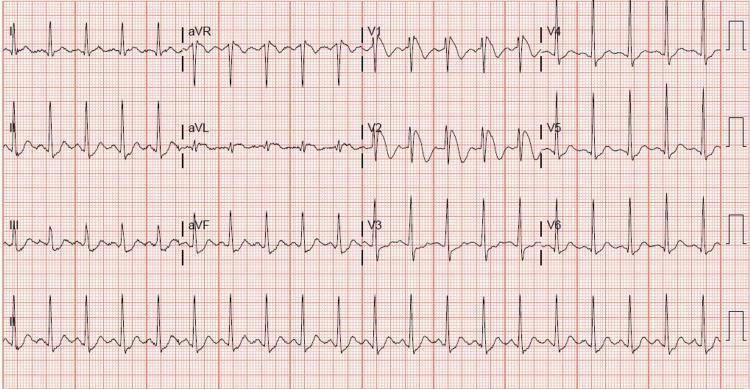
6. 🫀 Wolff-Parkinson-White (WPW) Syndrome
ECG Changes
The ECG triad during sinus rhythm:
- Short PR interval (<120 ms) — accessory pathway bypasses AV node delay
- Delta wave — slurred upstroke at the onset of QRS
- Widened QRS complex (>120 ms) due to pre-excitation
During tachycardia:
- Orthodromic AVRT (65%): narrow QRS, regular, rate 160–220 bpm — resembles SVT
- Antidromic AVRT (5–10%): wide QRS, regular — resembles VT
- AF with WPW (25%): wide irregular QRS with varying morphology, rate >200 bpm; life-threatening
Source: Tintinalli's Emergency Medicine, Tables 18-23 & 18-24; Pfenninger's Procedures for Primary Care
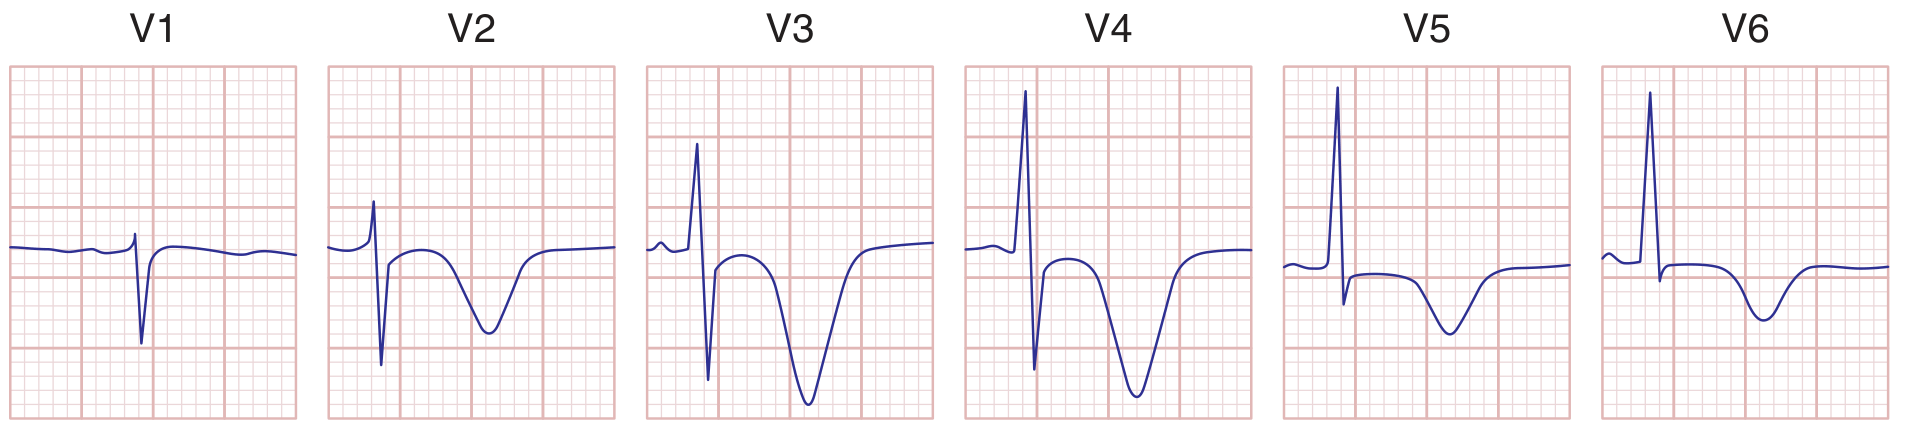
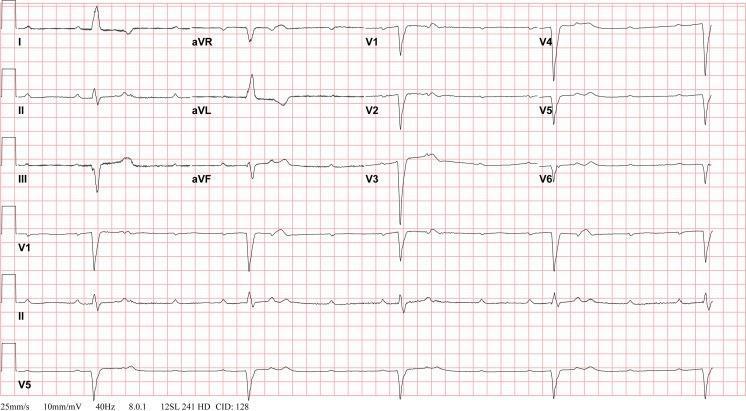
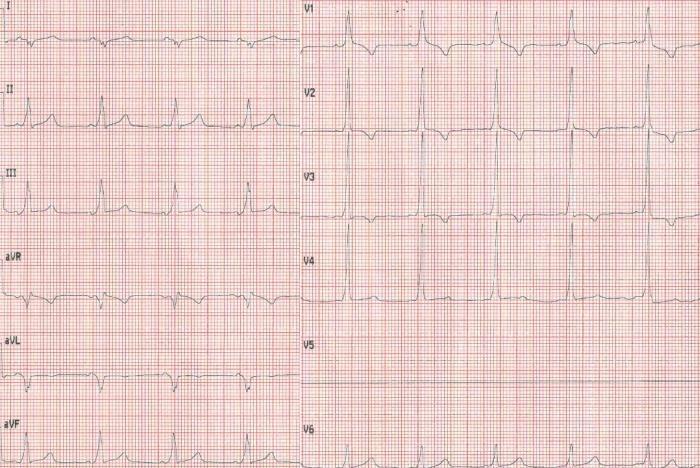
7. 🫀 Hypertrophic Cardiomyopathy (HCM)
ECG Changes
- Left ventricular hypertrophy — high QRS voltage (Sokolow: SV1 + RV5 ≥35 mm)
- Narrow septal Q waves in lateral leads (I, aVL, V5, V6) — due to septal hypertrophy
- T-wave inversions — diffuse or precordial; giant T-wave inversions in apical HCM (Yamaguchi variant)
- Left axis deviation
- ST-segment depression (strain pattern) in lateral leads
- Abnormal P waves if left atrial enlargement is present
- May show atrial flutter or fibrillation
Source: Tintinalli's Emergency Medicine, Fig. 55-1; Miller's Review of Orthopaedics
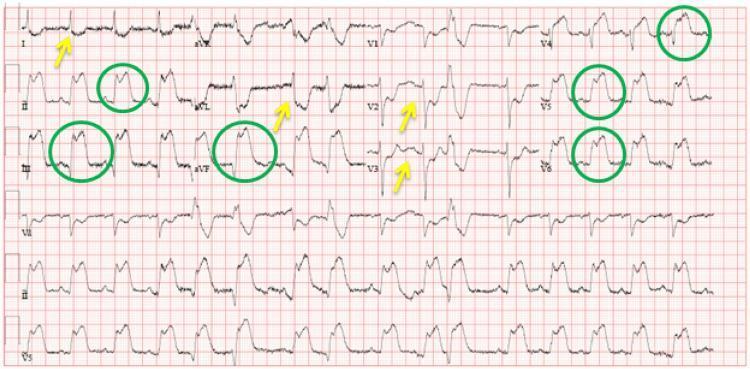
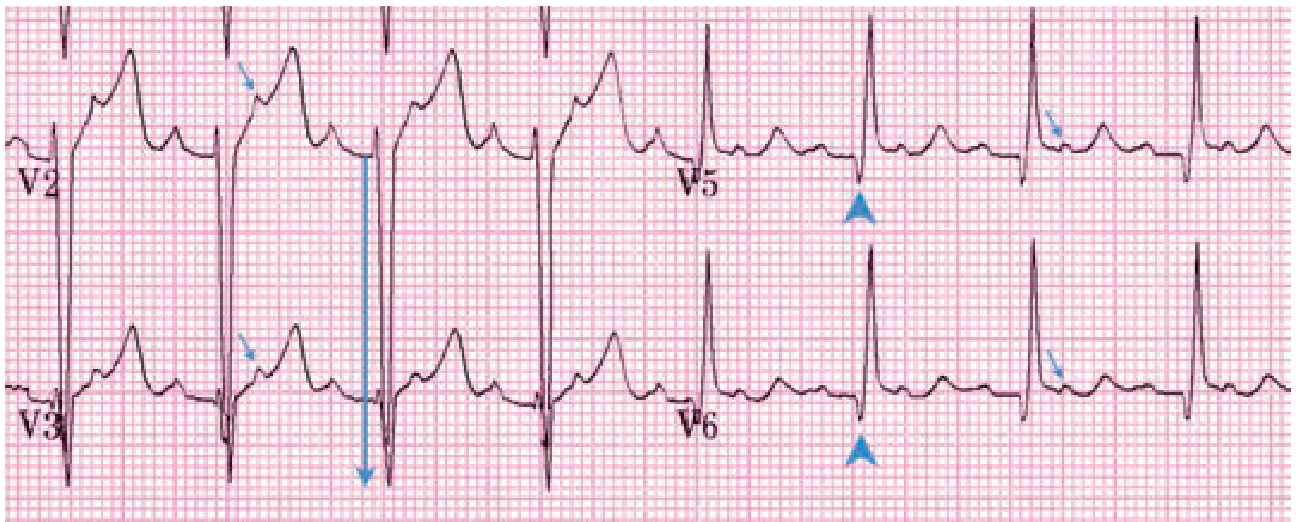
8. 🫀 Acute Pericarditis
ECG Changes (evolve through 4 stages):
- Stage 1 (acute): Diffuse concave ("saddle-shaped") ST elevation in all leads except aVR and V1; PR segment depression (most sensitive sign); Spodick's sign (downsloping TP segment)
- Stage 2: ST normalization, PR depression persists
- Stage 3: T-wave inversions (diffuse)
- Stage 4: ECG normalizes
Key distinguishing features from STEMI:
- ST elevation is diffuse (not in a coronary territory)
- No reciprocal ST depression (except aVR shows PR elevation + ST depression)
- Concave not convex ST morphology
- No Q waves

Source: Harrison's Principles of Internal Medicine 22E; Tintinalli's Emergency Medicine
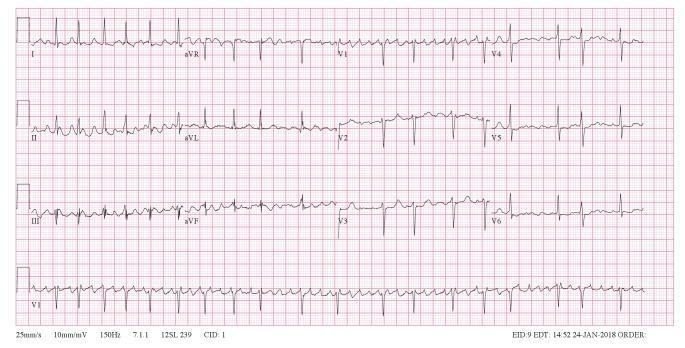
9. 🫀 Pulmonary Embolism (PE)
ECG Changes
- Sinus tachycardia — most common finding (>90% of cases)
- S1Q3T3 pattern (McGinn-White sign): prominent S wave in lead I, Q wave in lead III, T-wave inversion in lead III
- Right bundle branch block (complete or incomplete) — due to right ventricular strain
- Right axis deviation
- T-wave inversions in V1–V4 — right ventricular strain pattern
- P pulmonale — peaked P waves >2.5 mm in lead II
- Normal ECG does not exclude PE
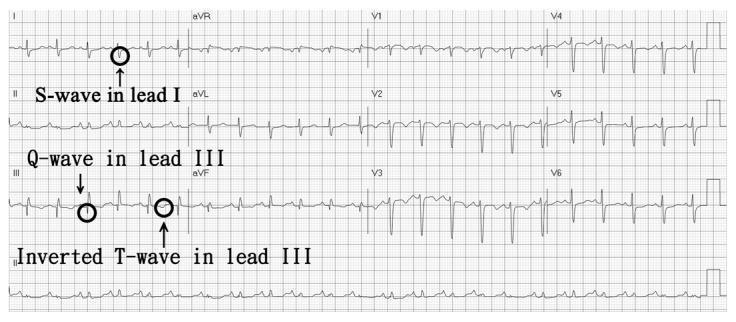
Source: Harrison's Principles of Internal Medicine 22E; Tintinalli's Emergency Medicine
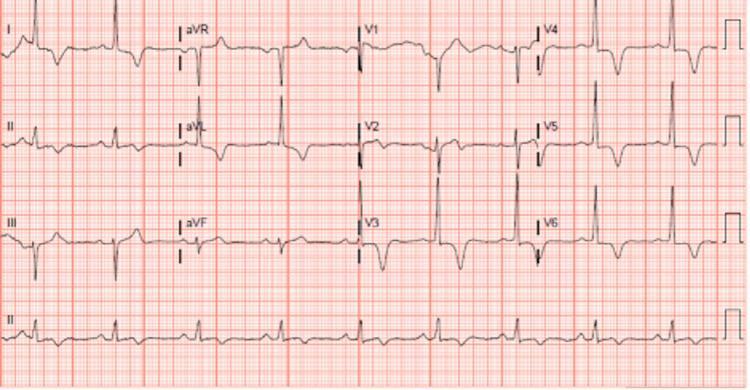
10. 🫀 Brugada Syndrome
ECG Changes
A genetic sodium channelopathy (SCN5A mutation) causing characteristic ECG patterns in V1–V2:
Type 1 (diagnostic / "coved" pattern):
- Coved ST elevation ≥2 mm with J-point elevation in V1–V2 (or V1–V3)
- ST segment descends with a convex morphology into an inverted T wave
- Complete or incomplete right bundle branch block appearance
Type 2 & 3 (saddle-back patterns):
- Less diagnostic; require provocation with sodium channel blockers (flecainide, ajmaline) to unmask Type 1
Clinical significance: Associated with ventricular fibrillation and sudden cardiac death, often in young males at rest or during sleep.
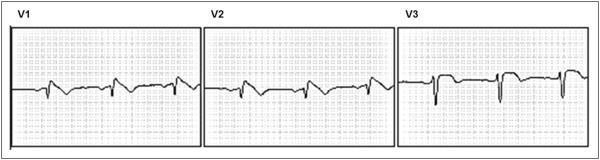
Source: Harrison's Principles of Internal Medicine 22E; Tintinalli's Emergency Medicine
Quick Reference Summary Table
| # | Disease | Key ECG Features |
|---|---|---|
| 1 | STEMI | ST elevation ≥1mm (contiguous leads), Q waves, reciprocal depression |
| 2 | NSTEMI/UA | ST depression, T inversions, Wellens pattern; no Q waves |
| 3 | Atrial Fibrillation | No P waves, irregularly irregular rhythm, fibrillatory baseline |
| 4 | 3rd Degree Heart Block | Complete AV dissociation, slow escape rhythm, P waves "march through" |
| 5 | Ventricular Tachycardia | Wide QRS >120ms, AV dissociation, fusion/capture beats, concordance |
| 6 | WPW Syndrome | Short PR <120ms, delta wave, widened QRS |
| 7 | Hypertrophic CMP | High voltage LVH, narrow septal Q waves, T inversions (giant in apical) |
| 8 | Acute Pericarditis | Diffuse concave ST elevation, PR depression, Spodick's sign |
| 9 | Pulmonary Embolism | Sinus tachycardia, S1Q3T3, RBBB, right axis, T inversions V1–V4 |
| 10 | Brugada Syndrome | Coved ST elevation V1–V2, RBBB morphology, inverted T waves |
Sources: Harrison's Principles of Internal Medicine 22E; Tintinalli's Emergency Medicine; Guyton & Hall Textbook of Medical Physiology; Ganong's Review of Medical Physiology 26E; Tintinalli's Emergency Medicine; ECG images from PMC Clinical VQA literature database.
This is a shared conversation. Sign in to Orris to start your own chat.