
Renal physiology topic details basic to higher level
nephron anatomy diagram renal physiology
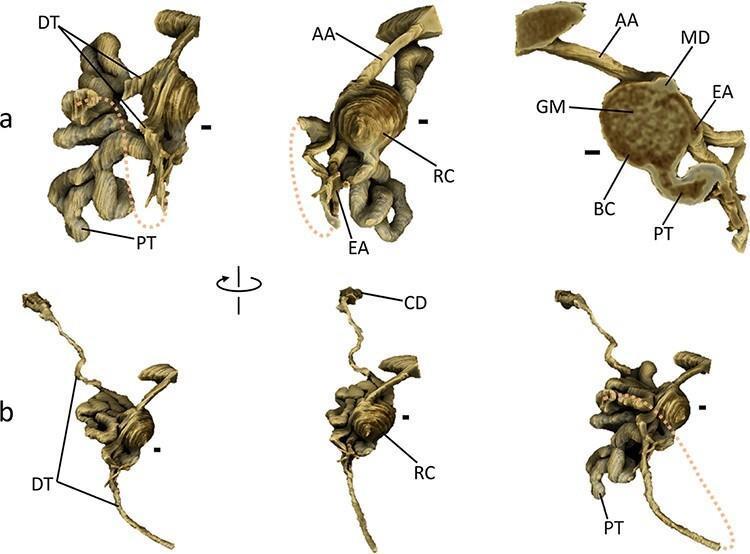
Anatomical diagram featuring high-resolution 3D renderings of a single mouse nephron, highlighting renal microstructure and spatial arrangement. Panel (a) provides detailed views of the renal corpuscle (RC), demonstrating the spherical Bowman's capsule (BC) and internal glomerulus (GM). It clearly illustrates the vascular pole with the afferent arteriole (AA), efferent arteriole (EA), and the macula densa (MD) of the distal tubule (DT) forming a v-shaped contact point. The tubular pole shows the exit of the highly convoluted proximal tubule (PT). Panel (b) illustrates the longitudinal progression from the renal corpuscle through the PT and DT to the collecting duct (CD). The rendering distinguishes between the intensely convoluted segments near the corpuscle and the straighter distal segments of the tubules. Key educational concepts include the juxtaglomerular apparatus anatomy, the morphology of glomerular filtration components, and the physical relationship between various segments of the nephron and their associated vasculature, essential for understanding renal physiology and pathology.
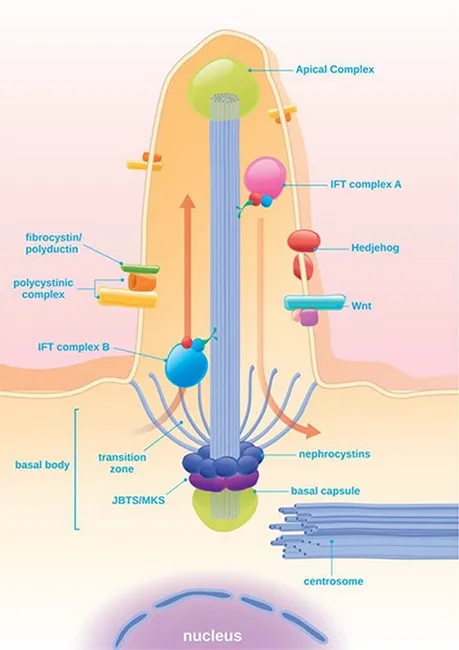
Educational diagram of the renal nephron focusing on the cilia-centrosome complex in tubular epithelium and its role in Autosomal Dominant Polycystic Kidney Disease (ADPKD). The image depicts a non-motile primary cilium projecting into the tubular lumen, housing the polycystin-1 and polycystin-2 heterodimer, and associated IFT (intraflagellar transport) components at the basal body and centriole. In healthy kidneys, the PC1/PC2 complex mediates mechanosensory calcium influx in response to tubular flow, regulating downstream signaling pathways. In PKD, PKD gene mutations abolish or alter this complex, disrupting intracellular Ca2+ homeostasis and shifting balance toward cAMP-driven proliferation and enhanced secretory activity. The diagram notes downstream pathways such as ERK and mTOR, which contribute to cyst initiation and progressive enlargement of cysts from renal tubular epithelium. Additional features illustrate basal body, transition zone, and basal capsule architecture, along with Wnt/Hedgehog signaling crosstalk and ciliary transport (IFT A/B). The educational utility spans medical education, nephrology, genetics, and cell biology; potential applications include teaching ciliary biology, pathophysiology of PKD, and therapeutic targets aimed at mitigating cyst growth. This representation serves as a conceptual reference rather than a diagnostic radiograph, and supports discussions of genotype-phenotype correlations, experimental models, and drug development strategies in ciliopathies.
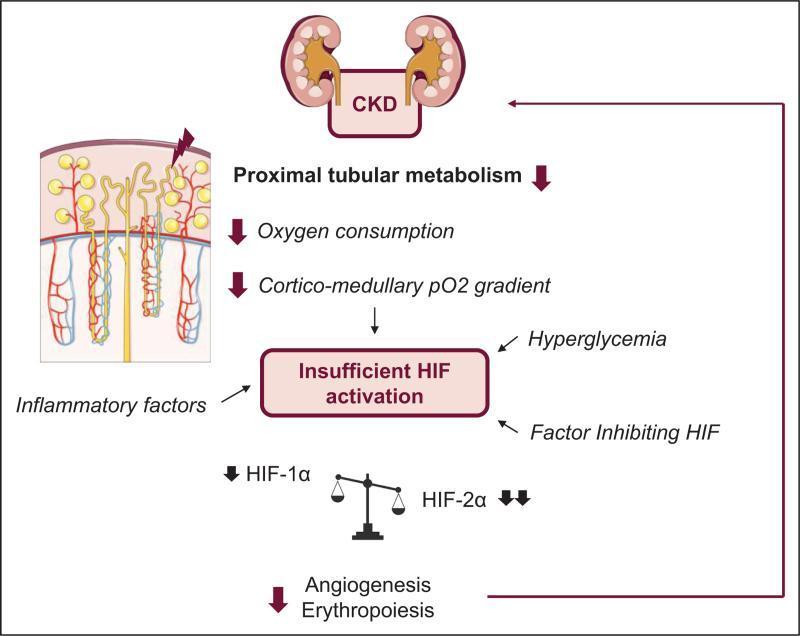
A pathophysiology diagram illustrating the proposed mechanism for insufficient Hypoxia-Inducible Factor (HIF) activation in the context of Chronic Kidney Disease (CKD). At the top, a graphic depicts bilateral kidneys labeled 'CKD'. Below this, a vertical pathway demonstrates how altered renal physiology—specifically decreased proximal tubular metabolism, reduced oxygen consumption, and a diminished cortico-medullary pO2 gradient—leads to the central node of 'Insufficient HIF activation'. This central node is further influenced by external contributors including inflammatory factors (represented by an anatomical nephron cross-section), hyperglycemia, and the presence of 'Factor Inhibiting HIF' (FIH). Beneath the central activation node, a balance scale compares HIF-1α and HIF-2α levels, showing a relative decrease in both subunits, with HIF-2α notably more reduced. The pathway terminates at the bottom, indicating that suppressed HIF signaling results in downregulated angiogenesis and erythropoiesis, contributing to the clinical progression of renal disease.
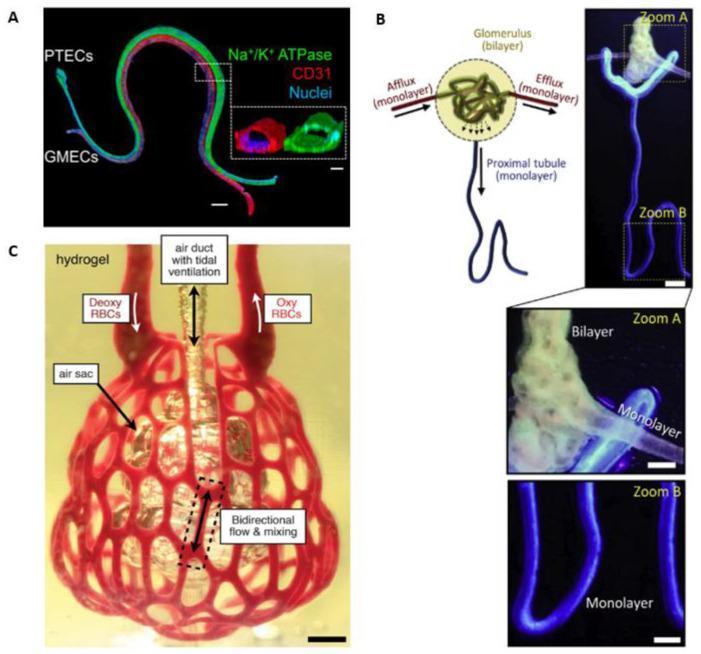
Educational medical visualization of 3D bioprinted organ-on-a-chip models for renal and pulmonary physiology. (A) Immunofluorescence micrograph showing an engineered vascularized proximal tubule. The structure features Na+/K+ ATPase (green) marking proximal tubule epithelial cells (PTECs) and CD31 (red) marking glomerular microvascular endothelial cells (GMECs), with NucBlue (blue) counterstaining nuclei. A cross-sectional inset shows the distinct lumens of the adjacent epithelial and endothelial channels. (B) Diagram and high-resolution microscopy of a 3D cell-printed renal analogue. The model depicts a bilayer glomerular capillary structure connected to a monolayer proximal tubule, illustrating the complex spatial organization of the nephron unit. Zoomed regions highlight the structural differences between bilayer and monolayer bioprinted tissues. (C) Photograph of a biofabricated distal lung unit encased in hydrogel. This pulmonary model simulates gas exchange using an air duct with tidal ventilation connected to spherical air sacs (alveoli). Red-labeled channels depict the surrounding vascular network, illustrating the perfusion of deoxygenated (Deoxy RBCs) and oxygenated red blood cells (Oxy RBCs) through a bidirectional flow system designed for physiological oxygenation studies.
GFR glomerular filtration starling forces kidney
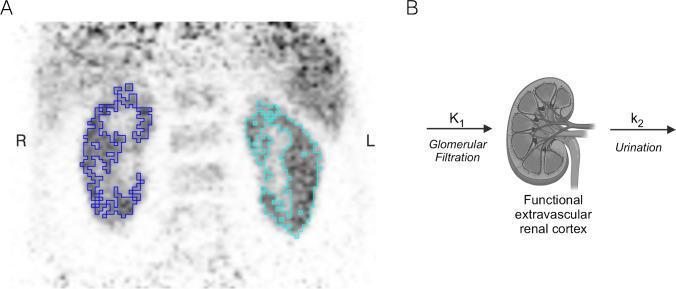
This composite image demonstrates the methodology for assessing Glomerular Filtration Rate (GFR) using dynamic PET imaging. Panel A shows a frontal view of an early-frame PET scan of the kidneys. The functional renal cortex is segmented using 3D auto iso-contouring; the right kidney (labeled 'R') is outlined in dark blue, and the left kidney (labeled 'L') is outlined in cyan. This segmentation is crucial for constructing renal cortical time-activity curves (TACs). Panel B illustrates a schematic representation of a single-compartment tracer kinetic model used for GFR quantification. The model consists of an input rate constant, K1, representing glomerular filtration into the functional extravascular renal cortex (depicted as an anatomical kidney diagram), and an output rate constant, k2, representing tracer elimination via urination. This visual summarizes both the anatomical region of interest (ROI) selection in diagnostic nuclear medicine and the underlying physiological modeling required for renal functional assessment.

This pathophysiology diagram consists of a mathematical graph and its corresponding equations, illustrating the relationship between kinetic Glomerular Filtration Rate (GFRK) and the rate of change in serum creatinine concentration (∂Crt/∂GFRK) during Acute Kidney Injury (AKI). The graph displays two curves, red and blue, positioned entirely in the fourth quadrant (negative y-values). This visualizes the physiological principle that creatinine concentration and GFR move in opposite directions. The x-axis represents GFRK (independent variable), and the y-axis represents the partial derivative ∂Crt/∂GFRK. The red curve reflects standard clinical parameters, while the blue curve represents more extreme clinical scenarios (e.g., higher initial creatinine of 9.0 mg/dL and altered fluid distribution volumes). Both curves demonstrate a steep negative slope at low GFRK values, which gradually flattens and approaches the x-axis as GFRK increases. This illustrates that the sensitivity of creatinine changes is significantly higher at low renal function levels, recapitulating patterns seen in chronic kidney disease within an acute clinical context.
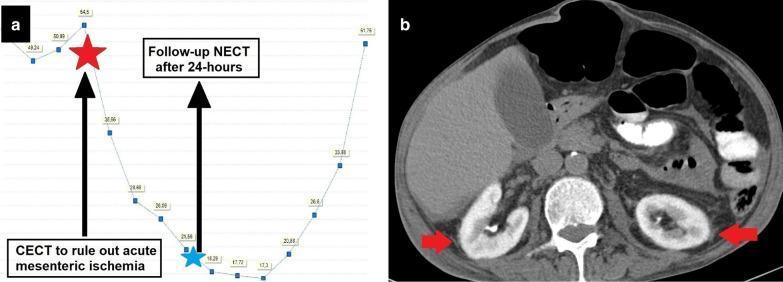
A composite medical visual illustrating the development and monitoring of contrast-induced nephropathy (CIN). Panel (a) features a longitudinal line graph plotting Glomerular Filtration Rate (GFR) values over time. It shows a baseline GFR of 54.5 mL/min/1.73 m², followed by a precipitous decline after a contrast-enhanced computed tomography (CECT) scan (indicated by a red star). The GFR reaches a nadir before beginning a gradual recovery 24 hours later (indicated by a blue star). Panel (b) is an axial non-contrast computed tomography (NCCT) scan of the mid-abdomen. Red arrows indicate bilateral renal parenchymal hyperdensity. This persistent enhancement in a non-contrast study is characteristic of contrast retention within the renal parenchyma, reflecting impaired filtration and excretory function secondary to acute kidney injury. The kidneys appear diffusely high in attenuation compared to surrounding soft tissues. This image serves as a clinical teaching tool for recognizing radiological manifestations of renal dysfunction following intravascular contrast administration in a patient with suspected sepsis and mesenteric ischemia.
countercurrent mechanism loop of Henle urine concentration medullary gradient
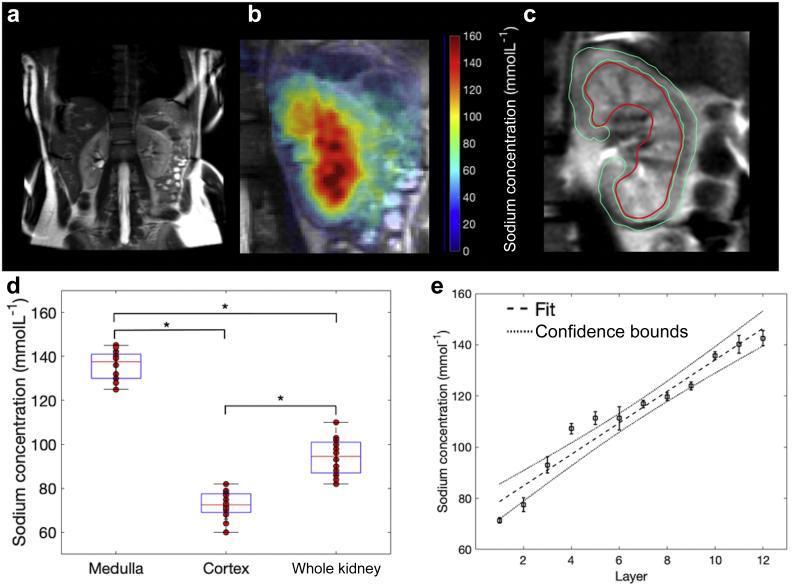
This composite educational graphic illustrates human renal sodium imaging and physiological data. (a) Coronal T2-weighted MRI provides anatomical context, showing both kidneys within the abdominal cavity. (b) A fused 23Na sodium concentration map overlaid on anatomical proton imaging, utilizing a heatmap scale (0–160 mmol/L) where red indicates high medullary concentrations. (c) Digital segmentation of the kidney into regions of interest (ROI), with the renal cortex outlined in green and the medulla in red. (d) A box-and-whisker plot quantitatively compares sodium concentrations, showing the medulla (~140 mmol/L) is significantly higher than the cortex (~70 mmol/L) and whole kidney. (e) A regression analysis plot shows the average corticomedullary sodium gradient, demonstrating a linear increase in sodium concentration across twelve segmented layers from the outer cortex to the inner medulla (R² = 0.94). These panels collectively demonstrate the use of multinuclear magnetic resonance imaging to assess the renal medullary osmotic gradient, a critical component of the kidney's concentrating mechanism.
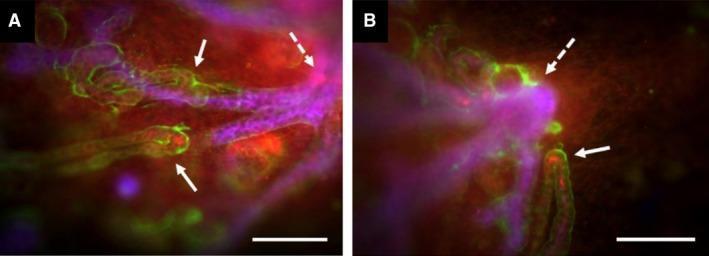
This dual-panel fluorescence microscopy image (A and B) demonstrates the developmental orientation of the loop of Henle in cultured embryonic mouse kidney cortex (E11.5 + 7d). The visual captures two primary tubular systems: the branching collecting duct system, stained purple-blue (CalbindinD28k), and the developing loops of Henle, delineated by green and red signals. The green fluorescence (anti-laminin) marks the basement membranes of the tubules, while the red signal identifies Tamm-Horsfall Protein (THP), a marker for maturing loops of Henle. Solid white arrows highlight the hairpin-like terminal ends or 'tips' of these loops, where red THP expression is most intense. Dotted white arrows point to the primary branch points of the collecting duct network. The images illustrate a clear centripetal growth pattern, where the loops of Henle extend and orient themselves toward the oldest, largest junctions of the collecting duct system. This configuration serves as an educational model for renal morphogenesis and the spatial navigation of nephron segments during kidney development. Scale bars: 200 μm.
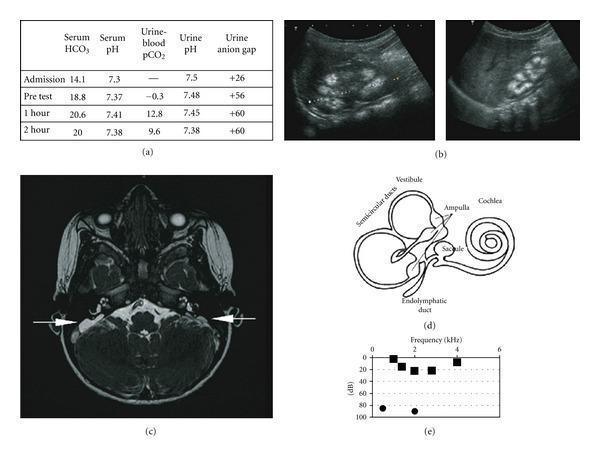
This composite educational image illustrates the clinical and diagnostic features of distal renal tubular acidosis (dRTA) associated with sensorineural hearing loss. (a) Data table showing results of a bicarbonate loading test, characterized by low urine-to-blood pCO2 gradient and positive urinary anion gap. (b) Renal ultrasound images of the left and right kidneys demonstrating medullary nephrocalcinosis, visualized as multiple hyperechoic foci within the renal pyramids. (c) Axial FIESTA (Fast Imaging Employing Steady-state Acquisition) cerebral MRI scan showing bilateral enlargement of the endolymphatic sacs (indicated by white arrows), a common finding in Pendred syndrome or dRTA with hearing loss. (d) Anatomical schematic of the inner ear, labeling the cochlea, vestibule, semicircular ducts, and endolymphatic duct. (e) Audiogram plot showing frequency (kHz) versus decibels (dB), depicting significant hearing impairment. The collection integrates metabolic laboratory data, diagnostic radiology (ultrasound and MRI), and functional audiological testing to present a comprehensive case of a hereditary renal-otological syndrome.
Renal Physiology: Basic to Higher Level
LEVEL 1 - BASIC: Overview and Functional Anatomy
Functions of the Kidney
- Excretion of metabolic waste products (urea, creatinine, uric acid, bilirubin metabolites)
- Regulation of water and electrolyte balance (Na+, K+, Cl-, HCO3-, Ca2+, Mg2+, phosphate)
- Acid-base homeostasis - adjusting urinary H+ and HCO3- excretion
- Blood pressure regulation - via renin-angiotensin-aldosterone system (RAAS) and pressure natriuresis
- Endocrine functions - erythropoietin (EPO) production, vitamin D activation (1-alpha hydroxylase), renin secretion
- Gluconeogenesis during prolonged fasting
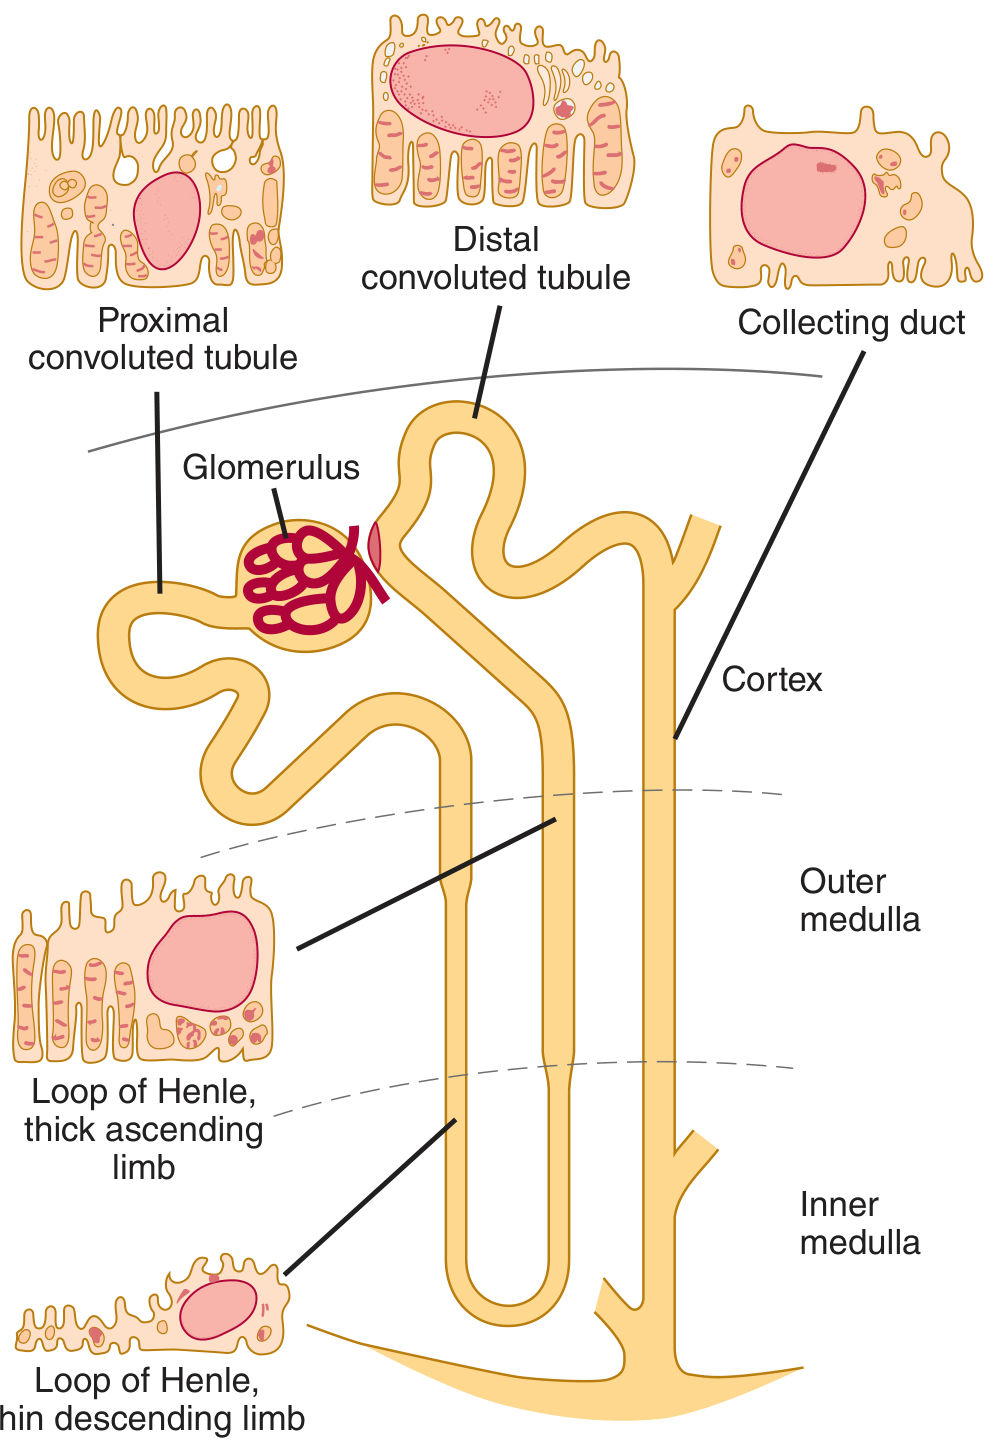
The Nephron - Structural Unit
| Segment | Location | Key Features |
|---|---|---|
| Glomerulus | Cortex | Capillary tuft in Bowman's capsule; ~200 μm diameter |
| Proximal convoluted tubule (PCT) | Cortex | ~15 mm long, 55 μm diameter; brush border (microvilli) |
| Loop of Henle (thin descending) | Medulla | Water permeable, solute impermeable |
| Loop of Henle (thick ascending) | Medulla/cortex | Impermeable to water; active NaCl reabsorption |
| Distal convoluted tubule (DCT) | Cortex | Aldosterone-sensitive; Ca2+ reabsorption |
| Collecting duct | Cortex → medulla | ADH-sensitive; final urine concentration |
- Cortical nephrons (85%) - short loops of Henle that barely enter the medulla
- Juxtamedullary nephrons (15%) - long loops that penetrate deep into the inner medulla; critical for urine concentration
Glomerular Structure (Key Details)
- Fenestrated capillary endothelium - pores 70-90 nm; prevents cells
- Glomerular basement membrane (GBM) - negatively charged; restricts large/anionic proteins
- Podocytes with filtration slits (~25 nm wide) bridged by slit diaphragm proteins (nephrin, podocin)
LEVEL 2 - INTERMEDIATE: Urine Formation
Urinary Excretion = Glomerular Filtration - Tubular Reabsorption + Tubular Secretion
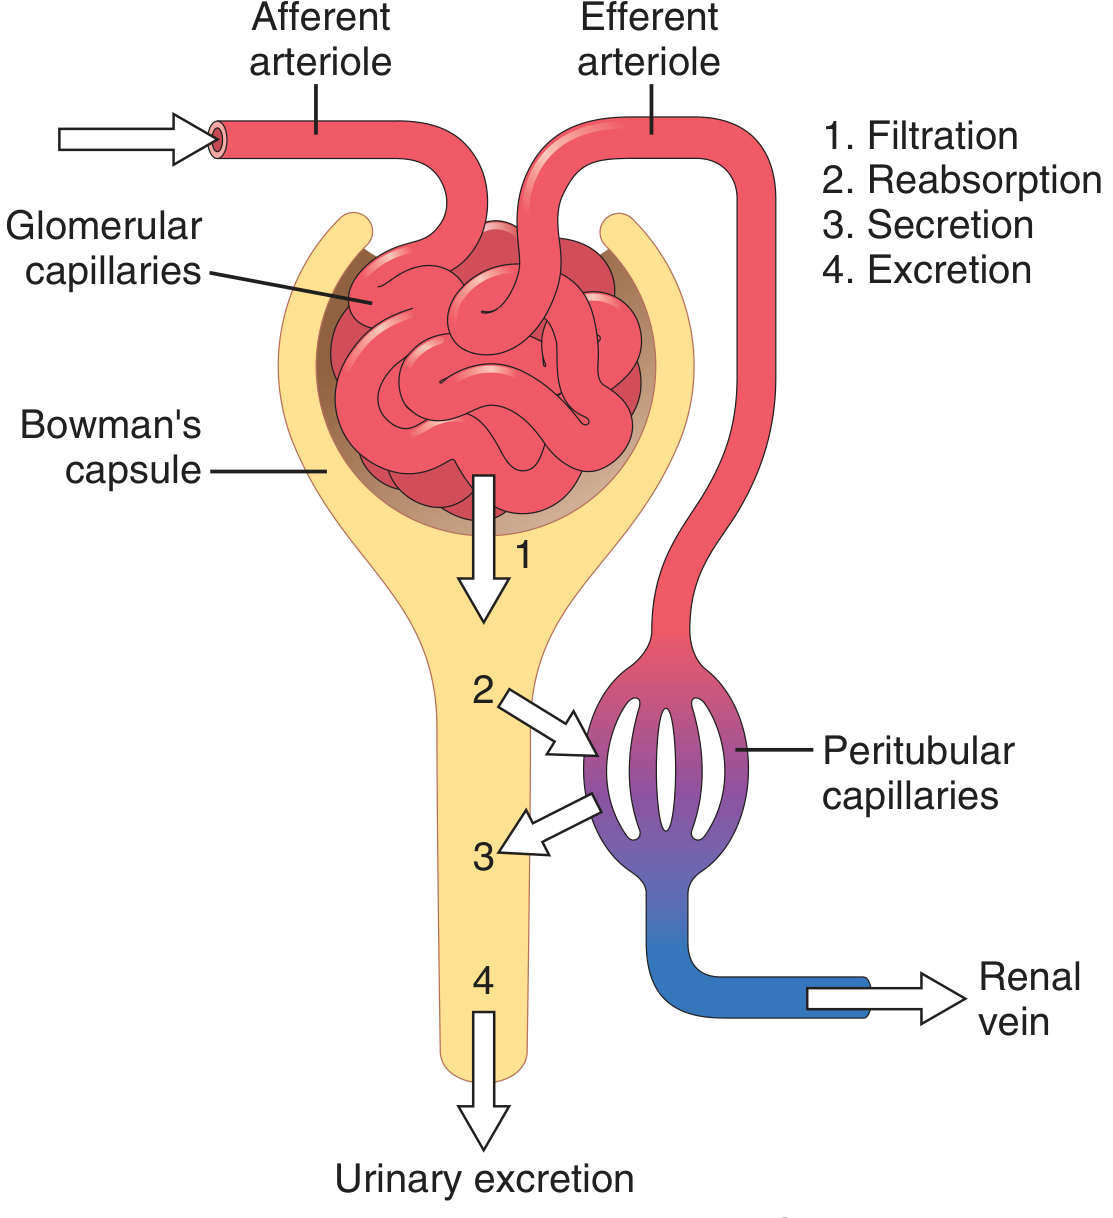
1. Glomerular Filtration
What is GFR?
Starling Forces (Net Filtration Pressure)
| Force | Value (approx.) | Effect |
|---|---|---|
| Glomerular capillary hydrostatic pressure (P_GC) | ~60 mmHg | Favors filtration |
| Bowman's capsule hydrostatic pressure (P_BS) | ~18 mmHg | Opposes filtration |
| Glomerular oncotic pressure (πGC) | ~32 mmHg | Opposes filtration |
| Bowman's capsule oncotic pressure (πBS) | ~0 mmHg | Negligible |
Factors Affecting GFR
- Kf (filtration coefficient): reduced by mesangial cell contraction (Ang II, endothelin) or glomerular disease
- P_GC (glomerular capillary pressure): increased by afferent dilation or efferent constriction; decreased by afferent constriction (NSAIDs) or efferent dilation (ACE inhibitors)
- Oncotic pressure: high plasma protein → ↓GFR; low plasma protein → ↑GFR
- Autoregulation: maintains GFR relatively constant between MAP 80-180 mmHg (via myogenic reflex and tubuloglomerular feedback)
Autoregulation Mechanisms
- Myogenic mechanism - rise in MAP stretches the afferent arteriole wall → reflex vasoconstriction
- Tubuloglomerular feedback (TGF) - the macula densa of the juxtaglomerular apparatus (JGA) senses increased NaCl delivery to the thick ascending limb → releases adenosine/TXA2 → afferent arteriole constriction → ↓GFR
2. Tubular Reabsorption
| Substance | Filtered/day | Excreted/day | % Reabsorbed |
|---|---|---|---|
| Water | 180 L | 1.5 L | 99.2% |
| Na+ | 630 g | 3.2 g | 99.5% |
| Glucose | 180 g | ~0 g | ~100% |
| Urea | 54 g | 30 g | ~45% |
| Creatinine | 1.8 g | 1.8 g | 0% (+ some secretion) |
Proximal Tubule (PCT) - Reabsorbs 65% of filtered Na+ and water
- Na+-coupled cotransport: SGLT2 reabsorbs glucose (2Na+:1 glucose); amino acid cotransporters
- Na+/H+ exchanger (NHE3): primary Na+ entry mechanism; drives HCO3- reabsorption
- Paracellular reabsorption: water follows osmotically; Cl- diffuses passively
- Isosmotic reabsorption: osmolality of tubular fluid unchanged (~300 mOsm/kg throughout PCT)
- Secretes: organic acids (urate), organic bases, creatinine, many drugs
Loop of Henle
- Highly permeable to water, poorly permeable to solutes
- Water exits due to hypertonic medullary interstitium → tubular fluid becomes concentrated (up to ~1200 mOsm at the hairpin turn)
- Impermeable to water (critical for urine concentrating ability)
- Active NaCl reabsorption via NKCC2 cotransporter (2Cl-:1Na+:1K+) - target of loop diuretics (furosemide)
- Reabsorbs ~25% of filtered Na+
- Dilutes tubular fluid (site of "free water generation")
Distal Convoluted Tubule (DCT)
- NCC cotransporter (Na+:Cl-) - target of thiazide diuretics
- Aldosterone-sensitive: inserts ENaC channels and Na+/K+ ATPase
- Active Ca2+ reabsorption (regulated by PTH and vitamin D)
- Reabsorbs ~5-10% filtered Na+
Collecting Duct
- Principal cells: ENaC (Na+ entry) and ROMK (K+ secretion); aldosterone upregulates both
- Alpha intercalated cells: H+-ATPase and H+/K+-ATPase; secrete H+; reabsorb HCO3-
- Beta intercalated cells: secrete HCO3-; reabsorb H+
- ADH (vasopressin): inserts AQP2 water channels → water reabsorption; regulated by plasma osmolality and volume status
3. Tubular Secretion
| Substance | Mechanism | Site |
|---|---|---|
| H+ | Active H+-ATPase | PCT, collecting duct |
| K+ | ROMK channels | Collecting duct |
| NH4+ | Na+/H+ exchanger substitution | PCT (mainly) |
| Creatinine | Organic cation transporter | PCT (small amount) |
| Organic acids (urate, drugs) | OAT transporters | PCT |
| PAH | OAT transporters | PCT (used to measure RPF) |
- Clearance of inulin = GFR (filtered only, not reabsorbed/secreted); ~125 mL/min
- Clearance of PAH ≈ RPF (filtered + secreted); ~625 mL/min
- Filtration fraction (FF) = GFR/RPF = 125/625 = 0.2 (20%)
- If clearance of substance < inulin → net reabsorption occurred
- If clearance of substance > inulin → net secretion occurred
LEVEL 3 - ADVANCED: Specialized Mechanisms
Urine Concentration - The Countercurrent System
- Countercurrent multiplier (loop of Henle) - builds the medullary osmotic gradient
- Countercurrent exchanger (vasa recta) - preserves the gradient
- ADH/vasopressin - controls water permeability of collecting duct
Countercurrent Multiplier Mechanism
- Corticomedullary junction: ~300 mOsm/kg
- Outer medulla: ~600 mOsm/kg
- Inner medulla: ~1200 mOsm/kg
Vasa Recta (Countercurrent Exchange)
ADH (Vasopressin) Action
- Stimulus: increased plasma osmolality (sensed by hypothalamic osmoreceptors; threshold ~280 mOsm/kg) or decreased blood volume/pressure (sensed by baroreceptors; overrides osmotic control)
- Mechanism: V2 receptor on collecting duct principal cells → cAMP → PKA → phosphorylates AQP2 → vesicle fusion with apical membrane → water permeability increases → water reabsorbed
- Diabetes insipidus: central (↓ADH production) or nephrogenic (↓V2 receptor/AQP2 response) → dilute polyuria up to 20 L/day
RAAS - Renin-Angiotensin-Aldosterone System
- ↓ renal perfusion pressure (myogenic, baroreceptor in afferent arteriole)
- ↓ NaCl delivery to macula densa (tubuloglomerular feedback)
- β1-adrenergic stimulation
- ↓ serum Na+
- Potent vasoconstriction (afferent > efferent arteriole)
- Stimulates aldosterone from adrenal zona glomerulosa
- Stimulates ADH release
- Direct proximal tubule Na+ reabsorption (via NHE3)
- Stimulates thirst
- Upregulates ENaC and Na+/K+-ATPase in collecting duct → Na+ reabsorption, K+ secretion, H+ secretion
- ACE inhibitors/ARBs → ↓ Ang II → dilate efferent arteriole → ↓ GFR acutely (dangerous in bilateral renal artery stenosis)
- Spironolactone/eplerenone: aldosterone antagonists
- SGLT2 inhibitors → tubuloglomerular feedback → ↓ GFR hyperfiltration → renoprotective
Potassium Regulation
- PCT: 65-70% reabsorbed paracellularly
- TAL: ~25% reabsorbed (NKCC2)
- Collecting duct principal cells: K+ secretion is the main regulated step
- ↑ Aldosterone → ↑ ENaC + ↑ ROMK → ↑ K+ secretion
- ↑ Plasma [K+] directly stimulates both aldosterone and ROMK
- ↑ Tubular flow rate → dilutes luminal K+ → gradient favors more secretion (explains hypokalemia with diuretics)
Renal Acid-Base Regulation
- H+ secretion - throughout the nephron, mainly PCT and collecting duct
- HCO3- reabsorption - the kidney filters ~4,320 mEq/day of HCO3-; virtually all is reabsorbed (mainly PCT via carbonic anhydrase)
- New HCO3- generation - when H+ is buffered by NH4+ or titratable acids (H2PO4-, citrate), new HCO3- is added to blood
- Titratable acids (phosphate buffer): filtered HPO42- + secreted H+ → H2PO4-
- Ammonia buffer: NH3 diffuses into lumen + H+ → NH4+ (trapped, excreted); main route for chronic acid load adaptation
Renal Handling of Specific Substances
| Substance | Special Notes |
|---|---|
| Glucose | Tm-limited; SGLT2 in early PCT (high capacity), SGLT1 in late PCT; glucosuria when plasma >200 mg/dL |
| Amino acids | Multiple specific cotransporters; defects cause aminoacidurias (e.g., cystinuria) |
| Phosphate | ~80% reabsorbed in PCT by NaPi-IIa/IIc; PTH inhibits → phosphaturia; FGF-23 also inhibits |
| Calcium | ~60% reabsorbed paracellularly in PCT; ~25% in TAL; ~15% in DCT (active, PTH- and calcitriol-regulated) |
| Urate | Complex: filtered → reabsorbed (URAT1) → secreted (OAT4) → re-reabsorbed; net ~90% reabsorbed |
LEVEL 4 - HIGHER/CLINICAL LEVEL: Integration and Clinical Correlates
Pressure Natriuresis
- RAAS activation → curve shifts right (more pressure needed for same natriuresis) → hypertension
- Renal damage → impaired natriuresis curve
Clearance Calculations
C = (U × V) / P
- C = clearance (mL/min)
- U = urine concentration of substance
- V = urine flow rate (mL/min)
- P = plasma concentration
- UNa = 70 mEq/L; PNa = 140 mEq/L; V = 1 mL/min; GFR = 100 mL/min
- Filtered Na+ = 100 × 140 = 14,000 μEq/min
- Excreted Na+ = 70 × 1 = 70 μEq/min
- Reabsorbed Na+ = 13,930 μEq/min
| Substance | Clearance (mL/min) | Interpretation |
|---|---|---|
| Glucose | 0 | Completely reabsorbed |
| Na+ | ~0.9 | Massively reabsorbed |
| K+ | ~12 | Net reabsorption, some secretion |
| Inulin | ~125 | = GFR (gold standard) |
| Creatinine | ~140 | Slightly secreted |
| PAH | ~625 | ≈ RPF (filtered + secreted) |
Neural Control of Renal Function
| Nerve frequency | Effect |
|---|---|
| Low (0.25-0.5 Hz) | ↑ Renin secretion (β1 receptors on JGA) |
| Moderate (1 Hz) | ↑ Na+ reabsorption (α-adrenergic on tubules), ↓ UNa |
| High (2.5 Hz) | Vasoconstriction → ↓ GFR, ↓ RBF |
Renal Physiology in Disease
| Disease | Mechanism | Physiological Result |
|---|---|---|
| Diabetes mellitus | Hyperfiltration (↑ Ang II → afferent dilation initially), then glomerulosclerosis | ↑ GFR early; microalbuminuria; eventual ↓ GFR (CKD) |
| Hypertension | RAAS activation, pressure transmission to glomerulus | Glomerulosclerosis, progressive CKD |
| Nephrotic syndrome | Disrupted podocyte slit diaphragm | Massive proteinuria >3.5 g/day; edema; hypoalbuminemia |
| Nephritic syndrome | Glomerular inflammation | Hematuria, proteinuria <3.5 g/day, hypertension, ↓GFR |
| Type 4 RTA | Hypoaldosteronism or aldosterone resistance | Hyperkalemia, normal AG metabolic acidosis |
| Diabetes insipidus (central) | ↓ADH production | Dilute polyuria; ↑ plasma osmolality |
| SIADH | Excess ADH | Dilute urine inappropriate for low plasma osmolality; hyponatremia |
| Bartter syndrome | NKCC2 mutation (TAL) | Hypokalemic alkalosis; resembles loop diuretic use |
| Gitelman syndrome | NCC mutation (DCT) | Hypokalemic alkalosis; resembles thiazide use |
Quick Reference Summary
BASIC LEVEL
  - Kidney functions: excretion, homeostasis, endocrine
  - Nephron segments: glomerulus → PCT → loop of Henle → DCT → CD
  - ~1 million nephrons per kidney

INTERMEDIATE LEVEL
  - GFR = 125 mL/min; determined by Starling forces across glomerular membrane
  - Urinary excretion = Filtration - Reabsorption + Secretion
  - PCT: 65% Na+/water (isosmotic); Tm for glucose ~375 mg/min
  - TAL: NaCl reabsorption, water impermeable; furosemide target (NKCC2)
  - DCT: thiazide target (NCC); aldosterone effect begins here
  - Collecting duct: final regulation; ADH → AQP2; aldosterone → ENaC/ROMK

ADVANCED LEVEL
  - Countercurrent system: builds 300→1200 mOsm gradient (TAL + urea recycling)
  - RAAS: renin → Ang I → Ang II → vasoconstriction + aldosterone
  - K+ secretion: aldosterone + flow in collecting duct
  - Acid-base: H+ secretion + HCO3- reabsorption + NH4+ buffer
  - FF = GFR/RPF = 0.20; inulin clearance = GFR; PAH clearance ≈ RPF

CLINICAL LEVEL
  - Pressure natriuresis: dominant long-term BP mechanism
  - SGLT2 inhibitors: glycosuria + TGF → renoprotection in diabetic nephropathy
  - ACE inhibitors: ↓ Ang II → efferent dilation → ↓ FF → renoprotective
  - Tubular disease (Bartter/Gitelman): genetic transporter defects mimic diuretics
- Ganong's Review of Medical Physiology 26th Ed., Chapter 37 (Renal Physiology)
- Guyton & Hall Textbook of Medical Physiology 14th Ed., Unit V (Chapters 26-32)
- Brenner & Rector's The Kidney (RAAS, glucose transport, amino acid transport)
- Goodman & Gilman's (Renal Anatomy and Diuretic Drug Action, p. 1410-1460)