
Epileptic syndrome and epilepsy in detail
"epilepsy" AND "classification" AND "syndromes"
epilepsy EEG classification seizure types diagram
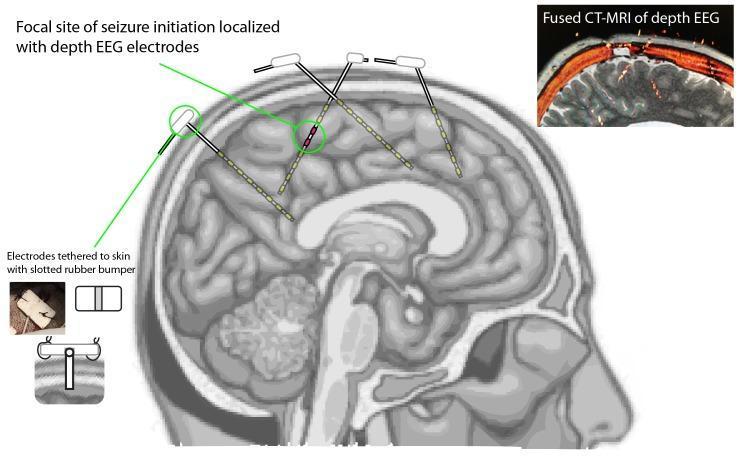
This medical illustration and diagnostic composite demonstrate the use of depth EEG electrodes for localizing a seizure focus in epilepsy management. The primary central image is a sagittal anatomical diagram of the human brain showing four implanted depth electrodes traversing the cortex and subcortical regions. One electrode is highlighted with a green circle, showing red contacts that indicate the focal site of seizure initiation, while non-active contacts on other electrodes are shown in yellow. An upper-right inset displays a 'Fused CT-MRI of depth EEG,' illustrating the radiological correlation of electrode placement within the skull. A lower-left inset provides a technical diagram and clinical photograph detailing the anchoring method, where electrodes are tethered to the scalp using a slotted rubber bumper, staples, and sutures. This visual resource is intended for neurosurgical and neurological education, specifically regarding Phase 2 stereoelectroencephalography (SEEG) and pre-surgical planning for focal epilepsy treatments such as resection or responsive neurostimulation.
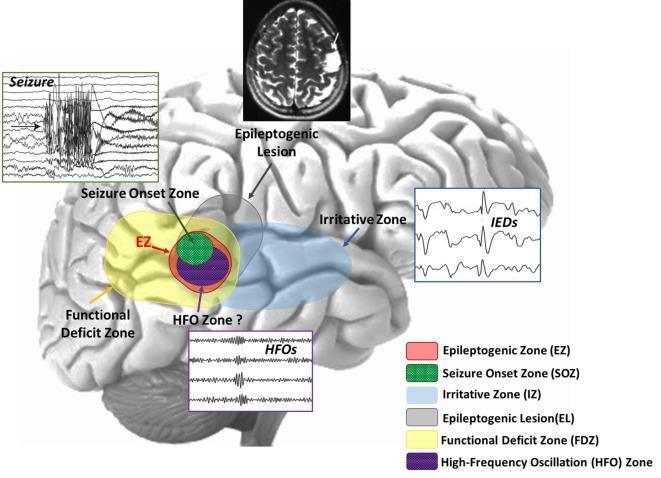
This medical infographic and anatomical diagram illustrates the conceptual and spatial relationships between various cortical zones used in the presurgical evaluation of epilepsy. Set against a lateral view of a human brain, the diagram highlights overlapping regions: the Seizure Onset Zone (SOZ, green), the High-Frequency Oscillation (HFO) zone (purple), and the Epileptogenic Zone (EZ, red outline). These are nested within the broader Functional Deficit Zone (FDZ, yellow) and the Irritative Zone (IZ, blue). The diagram also incorporates multimodal diagnostic data: a cranial MRI at the top showing an 'Epileptogenic Lesion' (EL); a 'Seizure' EEG tracing demonstrating ictal discharge associated with the SOZ; an 'IEDs' (Interictal Epileptiform Discharges) EEG strip corresponding to the IZ; and a localized EEG showing 'HFOs' above 80 Hz. This educational figure demonstrates how epileptologists integrate structural imaging, electrophysiology, and functional mapping to delineate the minimum amount of brain tissue requiring resection for seizure freedom while preserving eloquent cortex. The inclusion of the HFO zone represents modern advances in identifying biomarkers for the EZ.
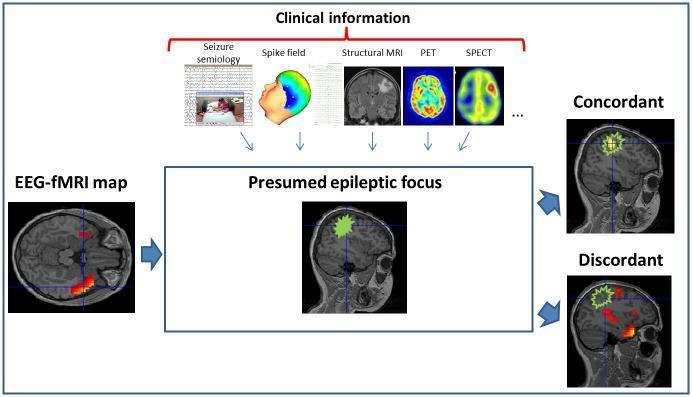
A multimodal diagnostic infographic illustrating the clinical assessment and validation of EEG-fMRI maps in epilepsy. The diagram organizes diverse clinical information used to define a 'Presumed epileptic focus,' including seizure semiology (EEG trace and video), spike field topography, structural MRI (T1-weighted), PET, and SPECT imaging. The central 'Presumed epileptic focus' is represented on a sagittal T1 MRI slice by a green-highlighted region. The infographic demonstrates the methodology for classifying an EEG-fMRI map as 'Concordant' or 'Discordant' based on the spatial overlap between significant BOLD signal changes (indicated by red-to-yellow heat maps) and the clinically defined focus. A concordant map shows BOLD activation within the green-contoured zone, whereas a discordant map displays activation clusters outside this region. This visual highlights the integration of electrophysiological and hemodynamic data for precise neuroanatomical localization of interictal epileptiform discharges (IEDs) in pediatric and adult epilepsy research.
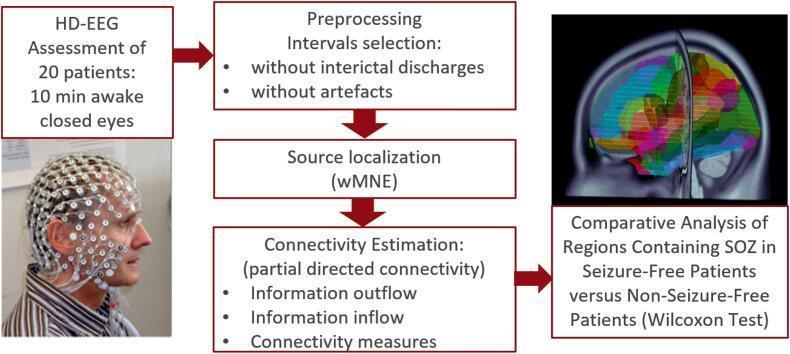
This infographic outlines a neurophysiological analysis strategy for epilepsy research. The flowchart begins with an HD-EEG assessment of 20 patients (10 minutes awake, eyes closed), accompanied by a clinical photograph showing a patient wearing a high-density EEG electrode cap. The process follows a stepwise algorithm: (1) Preprocessing to select intervals without interictal discharges or artifacts; (2) Source localization using weighted Minimum Norm Estimation (wMNE); and (3) Connectivity Estimation focused on partial directed connectivity, specifically information inflow, outflow, and general connectivity measures. The final step is a Comparative Analysis of regions containing the Seizure Onset Zone (SOZ) between seizure-free and non-seizure-free patients using the Wilcoxon Test. This is visually represented by a sagittal diagnostic image of a human brain with a multi-colored cortical segmentation overlay, illustrating anatomical regions of interest. The diagram serves as an educational tool for understanding the diagnostic and analytical pipeline used to predict surgical outcomes based on brain network connectivity in epilepsy patients.
West syndrome infantile spasms hypsarrhythmia EEG
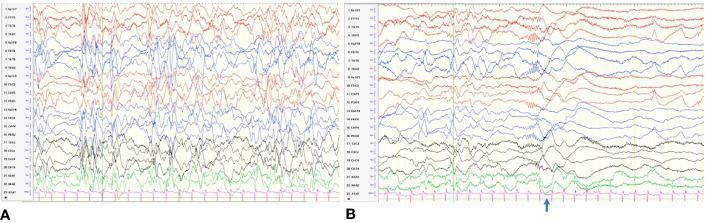
This diagnostic image displays two panels of electroencephalogram (EEG) tracings illustrating classic findings of Infantile Spasms (West syndrome) in a pediatric patient. Panel (A) demonstrates hypsarrhythmia, characterized by a chaotic, high-voltage, and disorganized background. The tracing shows a lack of synchronicity with intermixed irregular slow waves and multifocal independent spikes and sharp waves. Panel (B) illustrates an electrodecremental event, a common ictal feature of infantile spasms. This is visualized as a sudden, brief period of voltage attenuation (flattening of the EEG signal) following a high-amplitude wave. An arrow indicates the onset of the clinical spasm corresponding with this abrupt decrease in amplitude. Both panels utilize a multi-channel bipolar montage, providing a comprehensive view of the cortical electrical dysfunction. These findings are critical diagnostic markers for epileptic encephalopathy and are used to guide urgent treatment with ACTH or high-dose steroids.
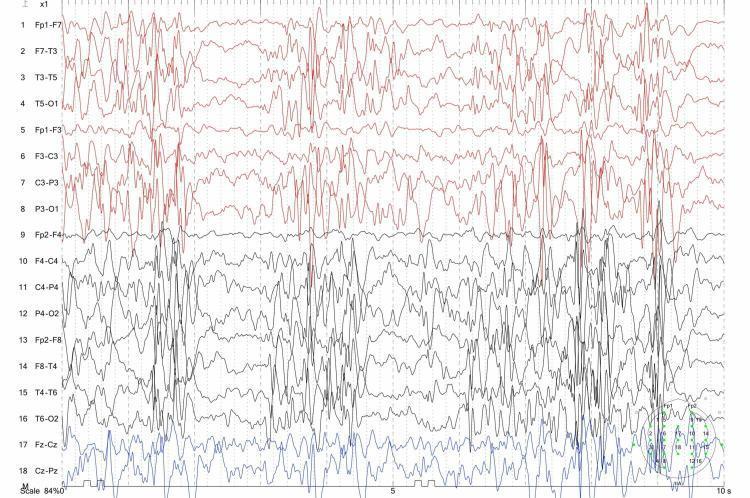
This diagnostic image displays a multi-channel electroencephalogram (EEG) recording demonstrating classic hypsarrhythmia, the hallmark finding of West syndrome (infantile spasms). The EEG trace shows a highly disorganized, chaotic, and non-rhythmic background pattern. Key features include high-amplitude slow waves interspersed with frequent, multifocal, independent spikes and sharp-wave discharges. The recording is divided into 18 channels using a standard montage (e.g., Fp1-F7, Fp2-F4, Fz-Cz). Channels 1 through 16 (colored red and black) exhibit the most pronounced high-voltage, irregular activity and spike-wave complexes. Channels 17 and 18 (blue) represent midline electrodes (Fz-Cz and Cz-Pz), showing a relative difference in amplitude but contributing to the overall pattern of chaotic cortical dysfunction. This pattern represents the interictal state of an infant with spasms before the initiation of treatment, such as ACTH or Vitamin B12, and is essential for the diagnosis of epileptic encephalopathy in the pediatric population.
Epilepsy and Epileptic Syndromes - A Comprehensive Overview
1. Definitions
- At least two unprovoked (or reflex) seizures occurring more than 24 hours apart
- One unprovoked seizure with a probability of further seizures similar to the general recurrence risk (≥60%) after two unprovoked seizures, occurring over the next 10 years
- Diagnosis of an epilepsy syndrome
2. Classification Framework
Level 1: Seizure Type
        ↓
Level 2: Epilepsy Type
        ↓
Level 3: Epilepsy Syndrome + Etiology
3. Classification of Seizure Types (ILAE 2017)
A. Focal Onset Seizures
| Subtype | Features |
|---|---|
| Focal aware (formerly simple partial) | Consciousness preserved; subjective or objective signs |
| Focal impaired awareness (formerly complex partial) | Consciousness impaired at onset or progresses to impairment |
| Focal to bilateral tonic-clonic (formerly secondarily generalized) | Focal onset evolves to involve both hemispheres |
- Motor: clonic, tonic, myoclonic, epileptic spasms, hyperkinetic, automatisms
- Non-motor: sensory (tingling, visual), autonomic (flushing, epigastric rising), cognitive (déjà vu, forced thinking), emotional (fear, laughter), behavior arrest
- Temporal lobe: Rising epigastric aura, fear, déjà vu/jamais vu, oroalimentary automatisms (lip smacking, chewing), postictal aphasia if dominant hemisphere
- Frontal lobe: Often nocturnal, brief, prominent motor features, asymmetric tonic posturing, hyperkinetic movements, minimal postictal confusion
- Parietal lobe: Somatosensory aura (tingling, numbness) with sensory march, distorted body image
- Occipital lobe: Elementary visual hallucinations (flashing colored lights, geometric shapes), forced blinking, nystagmoid eye movements
B. Generalized Onset Seizures
| Type | Key Features |
|---|---|
| Tonic-clonic (grand mal) | Tonic phase (10-20s: cry, cyanosis, apnea) → clonic phase (rhythmic jerks → slowing) → postictal coma/confusion |
| Absence (petit mal) | Abrupt behavioral arrest, staring, unresponsive; 3-Hz spike-wave on EEG; lasts 5-30s; no postictal phase |
| Atypical absence | Slower onset/offset; <2.5 Hz spike-wave; often with tonic or atonic features |
| Myoclonic | Brief, shock-like jerks; bilateral; often morning; 4-6 Hz polyspike-wave |
| Tonic | Sustained muscle contraction; often sleep-related; drop attacks |
| Clonic | Rhythmic jerking; no preceding tonic phase |
| Atonic | Sudden loss of muscle tone; head drops or falls ("drop attacks") |
| Epileptic spasms | Sudden flexion/extension; clusters on awakening; seen in West syndrome |
C. Unknown Onset
- Tonic-clonic (onset unwitnessed)
- Behavior arrest
- Epileptic spasms
4. Distribution of Seizure Types by Age
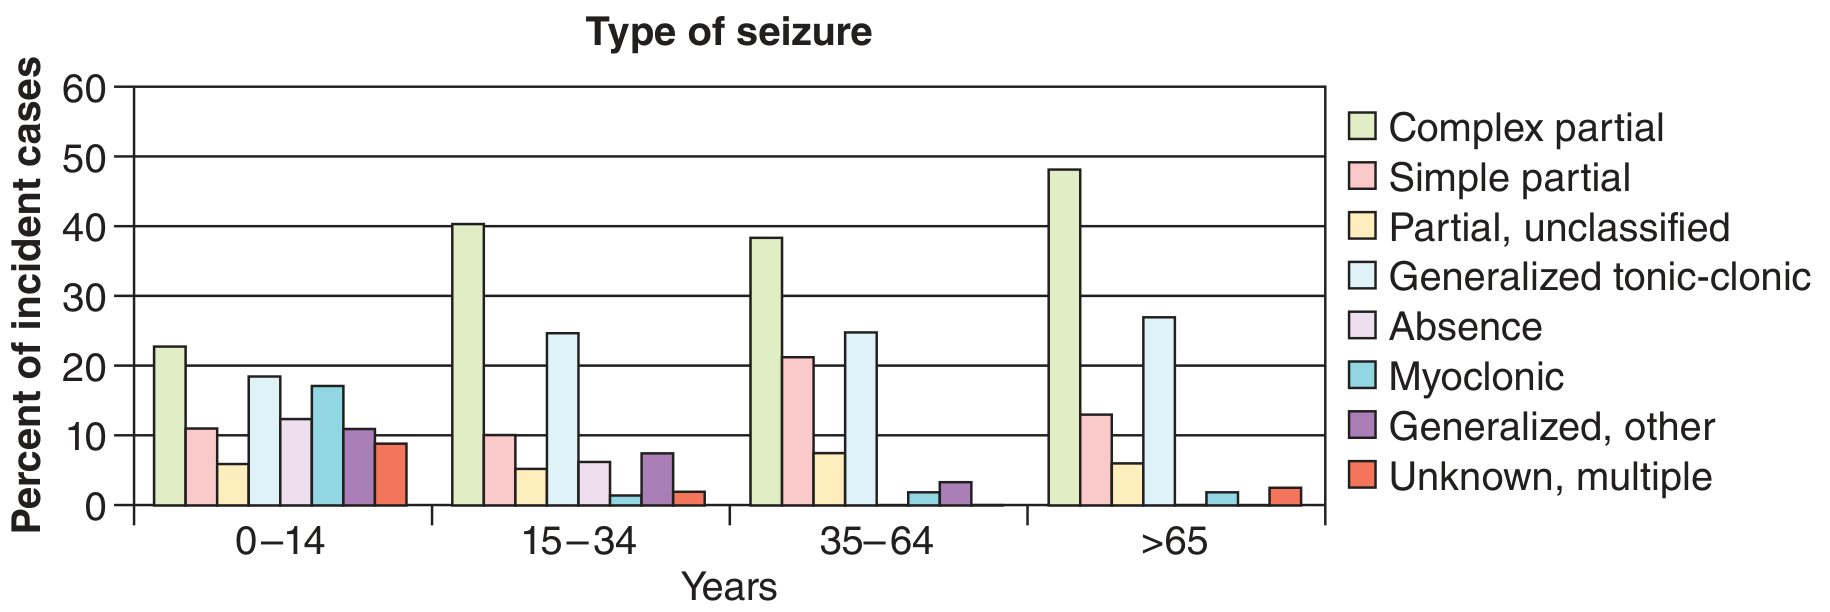
- Absence and myoclonic seizures predominate in childhood/adolescence
- Complex partial (focal with dyscognitive features) seizures peak in older individuals
- Generalized tonic-clonic seizures are prominent in the 15-34 age group
5. Classification of Epilepsies by Type (ILAE 2017)
- Focal epilepsy - seizures arise consistently from one hemisphere
- Generalized epilepsy - bilateral networks involved from the start
- Combined generalized and focal epilepsy - patient has both seizure types
- Unknown epilepsy - type cannot be determined
6. Etiology (ILAE 2017 Framework)
| Category | Examples |
|---|---|
| Structural | Hippocampal sclerosis, cortical dysplasia, tumors, vascular malformations, post-stroke, post-TBI |
| Genetic | Channelopathies (SCN1A in Dravet), SCN2A, KCNQ2; identified by gene sequencing |
| Infectious | Neurocysticercosis, herpes encephalitis, tuberculosis |
| Metabolic | Pyridoxine-dependent epilepsy, glucose transporter deficiency, porphyria |
| Immune | Anti-NMDAR encephalitis, LGI1, CASPR2, anti-GABA-B |
| Unknown | No cause identified after full workup |
7. Major Epileptic Syndromes
Neonatal Period
- Onset: first 3 months of life
- Seizures: tonic spasms in clusters; brief
- EEG: burst-suppression pattern (alternating high-amplitude bursts and electrical silence)
- Etiology: structural brain malformations
- Prognosis: very poor; often evolves to West syndrome
- Self-limited focal clonic or apneic seizures in first week
- KCNQ2/KCNQ3 mutations in familial form
- Prognosis: good; seizures typically remit
Infancy
- Age of onset: 3-12 months (peak 4-6 months)
- Triad: Epileptic spasms + hypsarrhythmia on EEG + developmental regression
- Spasms: brief flexion/extension of trunk and limbs, in clusters on awakening
- EEG - Hypsarrhythmia: chaotic, high-voltage, disorganized background with multifocal spikes
- Treatment: ACTH (first-line), vigabatrin (especially in tuberous sclerosis), high-dose steroids
- Prognosis: ~50% evolve to Lennox-Gastaut syndrome
- Onset: 5-8 months; often febrile, prolonged hemiclonic seizures
- SCN1A mutations (loss-of-function) in ~80%
- Multiple seizure types develop: focal, myoclonic, absence, tonic-clonic
- Sodium channel blockers (carbamazepine, lamotrigine) may WORSEN seizures - CONTRAINDICATED
- Treatment: valproate, clobazam, stiripentol, cannabidiol (Epidiolex)
Childhood
- Age: 4-10 years; female predominance
- Multiple daily absence seizures (20-200/day); 5-20 seconds; no postictal period
- EEG: 3-Hz generalized spike-and-wave activity
- Hyperventilation reliably provokes attacks
- Treatment: ethosuximide (first-line), valproate, lamotrigine
- 60-70% achieve seizure remission by adolescence
- Age: 7-10 years; male slight predominance
- Focal sensorimotor seizures: facial twitching, hypersalivation, speech arrest, hemifacial clonic activity; often nocturnal
- EEG: characteristic high-amplitude centrotemporal sharp waves with sleep activation
- Prognosis: remits by age 16 in virtually all; often no treatment needed
- Age: 3-10 years (peak 3-5 years)
- Triad: Multiple seizure types (tonic, atonic/drop attacks, atypical absences) + slow spike-and-wave (<2.5 Hz) + cognitive dysfunction
- EEG: slow spike-and-wave in waking; bursts of fast paroxysmal activity (~10 Hz) in sleep
- May evolve from West syndrome
- Drug-resistant; treatment: valproate, lamotrigine, rufinamide, clobazam, cannabidiol, felbamate
- Prognosis: poor; chronic course, cognitive deterioration
- Myoclonic jerks immediately followed by atonic component causing falls
- EEG: polyspike-wave and irregular slow spike-wave
- Treatment: valproate, ethosuximide; ketogenic diet highly effective
- Age: mean 7 years; male predominance
- Myoclonic absences: impaired consciousness + very prominent myoclonus of upper extremities, lasting 10-60 seconds; recurring multiple times/day
- EEG: 3-Hz generalized rhythmic spike-and-wave
- Resistant to monotherapy; dual therapy (valproate + ethosuximide) often required
- Cognitive decline associated with continuous spike-and-wave in slow-wave sleep
- Seizures often easily controlled; neuropsychological decline is the main problem
- Onset: 2-8 years (peak 5-7 years)
- Acquired verbal agnosia/aphasia in a child with previously normal language
- EEG: continuous spike-wave during slow sleep, especially over temporal regions
- Related to CSWS; seizures often controlled but language may not recover fully
- Age: 3-6 years
- Prolonged autonomic seizures: vomiting, eye deviation, pallor, loss of consciousness
- EEG: occipital and multifocal spike-waves
- Excellent prognosis; usually self-limited
Adolescence and Adulthood
- Onset: 10-17 years
- Less frequent absences than CAE; often accompanied by GTC seizures
- Responds to valproate and lamotrigine
- Usually persists into adulthood (unlike CAE)
- Onset: 12-18 years
- Classic triad: Morning myoclonic jerks (on awakening) + GTC seizures + sometimes absence seizures
- Triggered by sleep deprivation, alcohol, photostimulation
- EEG: 4-6 Hz polyspike-and-slow-wave discharges
- Treatment: valproate (most effective), levetiracetam, lamotrigine
- Lifelong treatment usually needed (80-90% relapse if medication withdrawn)
- CHRNA4 and CHRNB2 mutations (nicotinic acetylcholine receptor)
- Clusters of brief nocturnal hypermotor/hyperkinetic seizures
- Often misdiagnosed as parasomnias
- Responds well to carbamazepine
- Unverricht-Lundborg disease (cystatin B gene; most common PME)
- Lafora disease (progressive, fatal; polyglucosan bodies in neurons)
- MERRF (mitochondrial; myopathy, ragged-red fibers)
- Neuronal ceroid lipofuscinoses
- Sialidoses
- Most common epilepsy in adults; most common surgically remediable epilepsy
- Rising epigastric aura → fear → déjà vu → automatisms (oroalimentary, manual)
- Substrate: hippocampal sclerosis (most common structural cause)
- MRI: hippocampal atrophy and T2 signal increase
- Treatment: carbamazepine or oxcarbazepine (first-line); surgery highly effective (~70% seizure-free)
- Photosensitive epilepsy (most common: flashing lights)
- Reading epilepsy
- Hot-water epilepsy
- Musicogenic epilepsy
8. Pathophysiology
Cellular and Network Mechanisms
9. Epidemiology
- Prevalence: approximately 1-2% of the population worldwide
- Incidence: 40-70 per 100,000 per year; bimodal (peaks in infancy/childhood and >65 years)
- Lifetime risk of at least one seizure: ~10%; lifetime risk of epilepsy: ~3%
- Drug-resistant epilepsy (failure of ≥2 appropriate ASMs): affects ~30% of patients
- Prior CNS infection (meningitis/encephalitis)
- Head trauma (especially penetrating; Vietnam Head Injury Study showed 53% post-traumatic epilepsy at 15 years)
- Stroke and cerebrovascular disease (leading cause in elderly)
- Febrile seizures complicated (prolonged, focal, or multiple)
- Family history
- Cortical malformations
10. Diagnostic Evaluation
History (Most Important)
- Detailed ictal semiology from patient AND witness
- Age of onset, seizure frequency, duration, postictal features
- Precipitants, sleep relationship, diurnal pattern
- Birth history, developmental milestones, family history
EEG
- Standard interictal EEG: sensitivity ~50% for a single routine study; increases to ~90% after three studies
- Activation procedures: hyperventilation (provokes absence), photic stimulation, sleep deprivation
- Prolonged video-EEG monitoring: gold standard for ictal characterization and surgical planning
- Interictal epileptiform discharges (IEDs): spikes, sharp waves, spike-and-wave complexes
Neuroimaging
- MRI is the imaging of choice: high-resolution 3T with epilepsy protocol (thin cuts, coronal hippocampal T2/FLAIR, T1 volumetrics)
- CT: used acutely to rule out hemorrhage, tumors, calcifications (neurocysticercosis)
- PET (FDG): interictal hypometabolism at seizure focus; used pre-surgically
- SPECT (ictal/interictal subtraction = SISCOM): identifies ictal hyperperfusion zone
Laboratory
- Glucose, electrolytes (Na, Ca, Mg), renal/hepatic function, CBC
- Specific: lactate/pyruvate (mitochondrial disease), amino acids, CSF analysis
- Genetic testing: gene panels for suspected genetic epilepsies
11. Differential Diagnosis
| Condition | Key Distinguishing Features |
|---|---|
| Syncope | Prodrome (lightheadedness, diaphoresis), situational triggers, brief tonic activity post-anoxic, rapid recovery |
| PNES (Psychogenic Non-Epileptic Seizures) | Prolonged, asynchronous thrashing, eyes closed during event, no postictal EEG changes, video-EEG is diagnostic |
| Migraine | Aura duration (minutes vs. seconds), positive/spreading visual symptoms, headache follows |
| Transient ischemic attack (TIA) | Negative symptoms (weakness, numbness), no convulsion, older patients |
| Parasomnias | Sleepwalking/terrors: behavioral, non-ictal EEG, family history |
| Hypoglycemia | Low glucose, corrects with glucose administration |
| Breath-holding spells | Toddlers, provoked by pain/frustration, cyanosis, tonic posturing |
12. Treatment
Principles
- First-line: antiseizure medication (ASM) monotherapy
- Treat underlying cause if identified
- Avoid precipitants: sleep deprivation, alcohol, fever, specific triggers
- Goal: seizure freedom without unacceptable side effects
When to Start ASMs
- After two unprovoked seizures
- After one unprovoked seizure if recurrence risk ≥60% (structural lesion, epileptiform EEG, nocturnal seizure, Todd's palsy)
Antiseizure Medications by Seizure/Syndrome Type
| Seizure/Syndrome | First-Line | Second-Line / Adjuncts |
|---|---|---|
| Focal epilepsy | Carbamazepine, oxcarbazepine, lacosamide | Levetiracetam, lamotrigine, eslicarbazepine |
| Generalized tonic-clonic | Valproate, levetiracetam, lamotrigine | Topiramate, zonisamide |
| Childhood absence | Ethosuximide, valproate | Lamotrigine |
| JME | Valproate, levetiracetam | Lamotrigine, topiramate |
| LGS | Valproate, lamotrigine, rufinamide | Clobazam, cannabidiol, felbamate, topiramate |
| West syndrome | ACTH, vigabatrin, high-dose steroids | Valproate, pyridoxine |
| Dravet syndrome | Valproate, clobazam, stiripentol | Cannabidiol (Epidiolex), fenfluramine |
- Dravet syndrome (SCN1A loss-of-function)
- Lennox-Gastaut syndrome (may worsen absence/atonic seizures)
- Generalized epilepsies with absence (carbamazepine, vigabatrin)
Drug-Resistant Epilepsy
- Epilepsy surgery (most effective for drug-resistant focal epilepsy: ~70% seizure-free after temporal lobectomy)
- Vagus nerve stimulation (VNS): reduces seizure frequency by 50% in ~50% of patients
- Responsive neurostimulation (RNS): closed-loop brain stimulation at seizure onset zone
- Deep brain stimulation (DBS): anterior nucleus of thalamus
- Ketogenic diet: high-fat, low-carbohydrate diet; especially effective in children; mechanism involves KATP channel activation and reduced glutamate synthesis
- Radiosurgery (Gamma Knife): for mesial TLE, hypothalamic hamartoma
13. Special Situations
Status Epilepticus (SE)
- Convulsive SE: Continuous seizure >5 minutes or repeated seizures without recovery
- Initial management: benzodiazepines (IV lorazepam 0.1 mg/kg, or IM midazolam)
- Second-line if refractory: IV levetiracetam, valproate, fosphenytoin
- Refractory SE (RSE): anesthetic agents (propofol, midazolam infusion, barbiturate coma)
- Non-convulsive SE (NCSE): altered consciousness + seizure activity on EEG; requires EEG monitoring for diagnosis
Women with Epilepsy
- Catamenial epilepsy: seizure exacerbation perimenstrually (progesterone withdrawal)
- Valproate is teratogenic (neural tube defects, cognitive effects in offspring); avoid in women of childbearing age unless no alternatives
- Enzyme-inducing ASMs (carbamazepine, phenytoin) reduce contraceptive efficacy
- Folic acid supplementation pre-conception (5 mg/day) for all women on ASMs
Febrile Seizures
- Affect 2-5% of children aged 6 months-5 years
- Simple: <15 min, generalized, single in 24h - excellent prognosis
- Complex: >15 min, or focal, or recurs within 24h - increased epilepsy risk
- Febrile Seizures Plus (FS+): febrile seizures extending beyond usual age; may evolve to GEFS+
14. Comorbidities
- Depression: prevalence ~36% (vs. 11% in healthy controls); bidirectional relationship with epilepsy
- Anxiety: elevated risk; especially temporal lobe epilepsy
- ADHD: more than twice as prevalent
- Cognitive impairment: particularly in early-onset or drug-resistant epilepsy
- Migraine: risk ratio 2.4x compared to controls
- Sleep disorders: excessive daytime sleepiness common
- Sudden Unexpected Death in Epilepsy (SUDEP): occurs in ~1/1000 person-years in epilepsy; risk factors include nocturnal GTC seizures, frequent seizures, prone sleeping position
Summary: Key Epileptic Syndromes at a Glance
| Syndrome | Age of Onset | Key Seizure | EEG Hallmark | Prognosis |
|---|---|---|---|---|
| Ohtahara | < 3 months | Tonic spasms | Burst-suppression | Very poor |
| West | 4-12 months | Epileptic spasms | Hypsarrhythmia | Variable |
| Dravet | 5-8 months | Febrile prolonged | Multifocal | Poor |
| LGS | 3-10 years | Tonic/atonic/atypical absence | Slow SW (<2.5 Hz) | Poor |
| CAE | 4-10 years | Absence | 3-Hz SW | Good (60-70% remit) |
| BECTS | 7-10 years | Focal centrotemporal | Centrotemporal spikes | Excellent |
| Panayiotopoulos | 3-6 years | Autonomic | Occipital spikes | Excellent |
| JAE | 10-17 years | Absence + GTC | 3-4 Hz SW | Persists to adulthood |
| JME | 12-18 years | Morning myoclonus | 4-6 Hz polyspike-SW | Lifelong (good with Rx) |
| PMEs | Variable | Myoclonus + GTC | Polyspike-wave | Progressive deterioration |