
PSVT ECG changes management
PSVT paroxysmal supraventricular tachycardia ECG
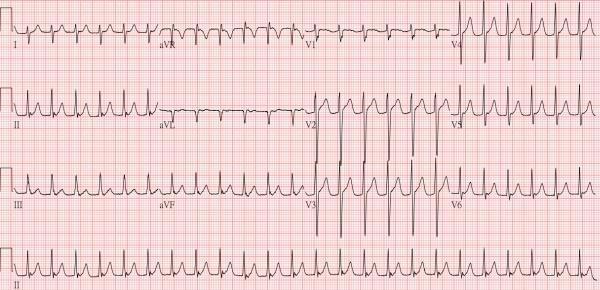
This diagnostic image is a standard 12-lead electrocardiogram (ECG) displayed on a pink grid, illustrating paroxysmal supraventricular tachycardia (PSVT). The tracing reveals a regular, narrow-complex tachycardia with a rapid ventricular rate. Key features include the absence of clearly discernible P waves preceding each QRS complex, suggesting they are buried within the QRS or T waves, which is characteristic of atrioventricular nodal reentrant tachycardia (AVNRT) or atrioventricular reentrant tachycardia (AVRT). The QRS complexes are of normal duration (narrow), indicating a supraventricular origin. In the precordial leads, there is poor R-wave progression in V1 through V3, with predominantly negative deflections, transitioning to larger R-waves in V4 through V6. The ST segments appear largely isoelectric across the leads. This ECG serves as a clinical teaching tool for identifying narrow-complex tachyarrhythmias and is relevant for cardiology students and practitioners managing electrophysiology and arrhythmia ablation cases.
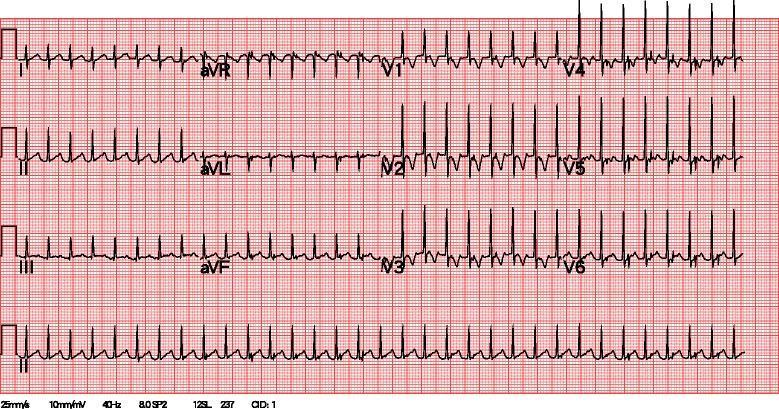
A standard 12-lead electrocardiogram (ECG) printed on grid paper, displaying a narrow-complex tachycardia consistent with paroxysmal supraventricular tachycardia (PSVT). The tracing shows a rapid ventricular rate exceeding 200 beats per minute with highly regular R-R intervals. P waves are not clearly discernible, as they are likely buried within or superimposed upon the preceding T waves due to the extreme tachycardia. The QRS complexes remain narrow (<120ms), indicating a supraventricular origin of the rhythm. In the precordial leads (V1-V6), there is a normal, progressive R-wave progression from V1 through V6. No significant ST-segment elevation, depression, or pathological Q waves are immediately evident at this rate. This diagnostic image illustrates the classic presentation of a tachyarrhythmia where the high heart rate obscures normal atrial activity, requiring clinical correlation and potentially vagal maneuvers or pharmacological intervention (e.g., adenosine) for definitive rhythm identification and termination.
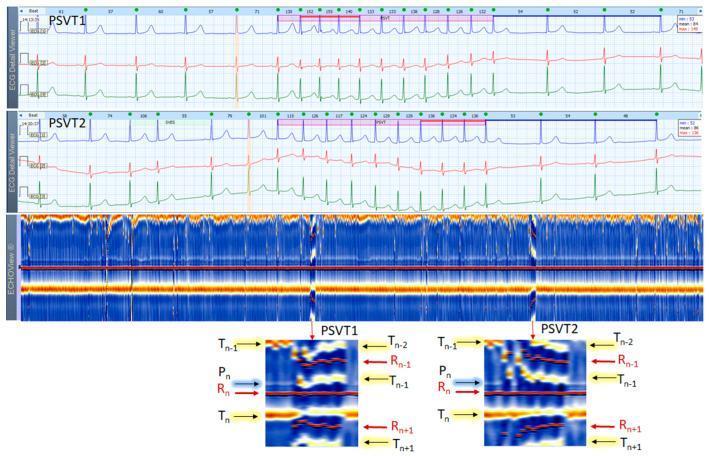
This composite medical image displays two 3-lead Holter ECG strips and a corresponding ECHOView color map from a 37-year-old female patient, illustrating paroxysmal supraventricular tachycardia (PSVT). The top panels show traditional ECG traces highlighting two PSVT episodes (PSVT1 and PSVT2) boxed in pink, characterized by rapid, narrow QRS complexes and heart rates between 115-155 bpm. The middle panel presents the ECHOView color map, which transforms ECG amplitudes into a color-coded visualization. A central horizontal red line represents the R-peaks (ventricular depolarization) used for beat alignment. Orange-white horizontal bands indicate T-waves (ventricular repolarization), while blue-white traces represent P-waves (atrial depolarization). The bottom zoomed sections specifically detail the PSVT episodes, showing the interruption of the normal P-wave band and the embedding of the P-wave (Pn) into the preceding T-wave (Tn-1). This visual evidence aids in differentiating between supraventricular tachycardia subtypes, such as atrioventricular reentrant tachycardia (AVRT) versus atrioventricular nodal reentrant tachycardia (AVNRT).
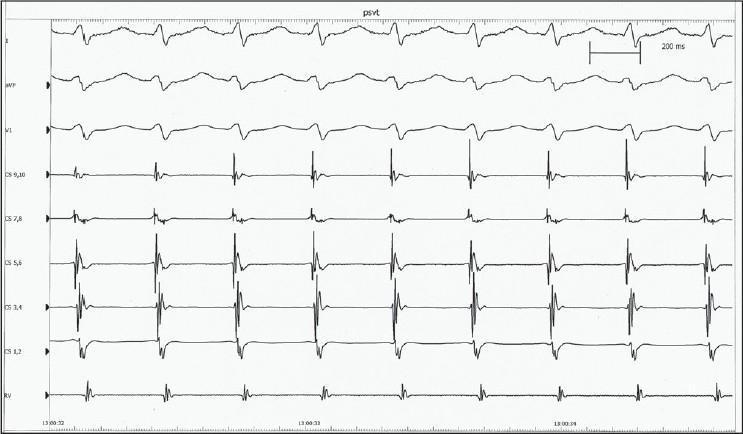
This diagnostic image displays an intracardiac electrogram (EGM) recorded during an electrophysiology (EP) study, demonstrating paroxysmal supraventricular tachycardia (PSVT), specifically atrioventricular nodal reentrant tachycardia (AVNRT). The tracing includes surface ECG leads (I, aVF, V1) and multiple intracardiac channels: distal to proximal coronary sinus electrograms (CS 9-10, CS 7-8, CS 5-6, CS 3-4, CS 1-2) and a right ventricular (RV) lead. The surface ECG shows a narrow QRS complex tachycardia with a regular rhythm. Within the coronary sinus leads, the atrial (A) and ventricular (V) electrograms are interfused or nearly simultaneous, characterized by a very short ventriculoatrial (VA) interval. This near-simultaneity of atrial and ventricular activation is a hallmark of typical (slow-fast) AVNRT, where retrograde atrial activation occurs almost concurrently with ventricular depolarization. The image includes a 200 ms scale bar for timing analysis. This material is used to teach medical students and cardiology fellows how to identify re-entrant tachycardia circuits using catheter-based spatial and temporal activation patterns.
"supraventricular tachycardia" management
PSVT (Paroxysmal Supraventricular Tachycardia)
What is PSVT?
ECG Features of PSVT
| Feature | Finding |
|---|---|
| Rate | Usually 170-180 bpm; range 130-300 bpm |
| Rhythm | Regular, narrow-complex tachycardia |
| QRS duration | Narrow, usually <100 ms |
| P waves | Absent or "buried" within QRS (~70% of cases) |
| Retrograde P waves | Present in ~30% - inverted, immediately adjacent to QRS (before, during, or after), no measurable PR interval |
| Onset/offset | Abrupt (paroxysmal) |

P-wave location helps identify the mechanism:
| Subtype | P-wave position | RP interval |
|---|---|---|
| Typical AVNRT (slow-fast) | Buried in QRS or pseudo-R' in V1, pseudo-S in II/III/aVF | Very short RP (<70 ms); near-simultaneous A and V activation |
| AVRT (orthodromic) | After QRS, in ST segment | RP shorter than PR; P follows QRS |
| Atrial Tachycardia (AT) | Before QRS with abnormal morphology | Long RP > PR |
Mechanisms
- AVNRT: Dual AV nodal pathways (fast and slow). The reentry circuit is within the AV node itself. P waves are simultaneous with or buried in the QRS because atrial and ventricular activation are near-simultaneous.
- AVRT (orthodromic): An accessory pathway (AP) conducts retrograde; antegrade conduction is over the normal AV node/His-Purkinje system. QRS is narrow unless a bundle branch block exists.
- AVRT (antidromic / preexcited): Antegrade conduction down the AP produces a wide QRS, often indistinguishable from VT.
Management
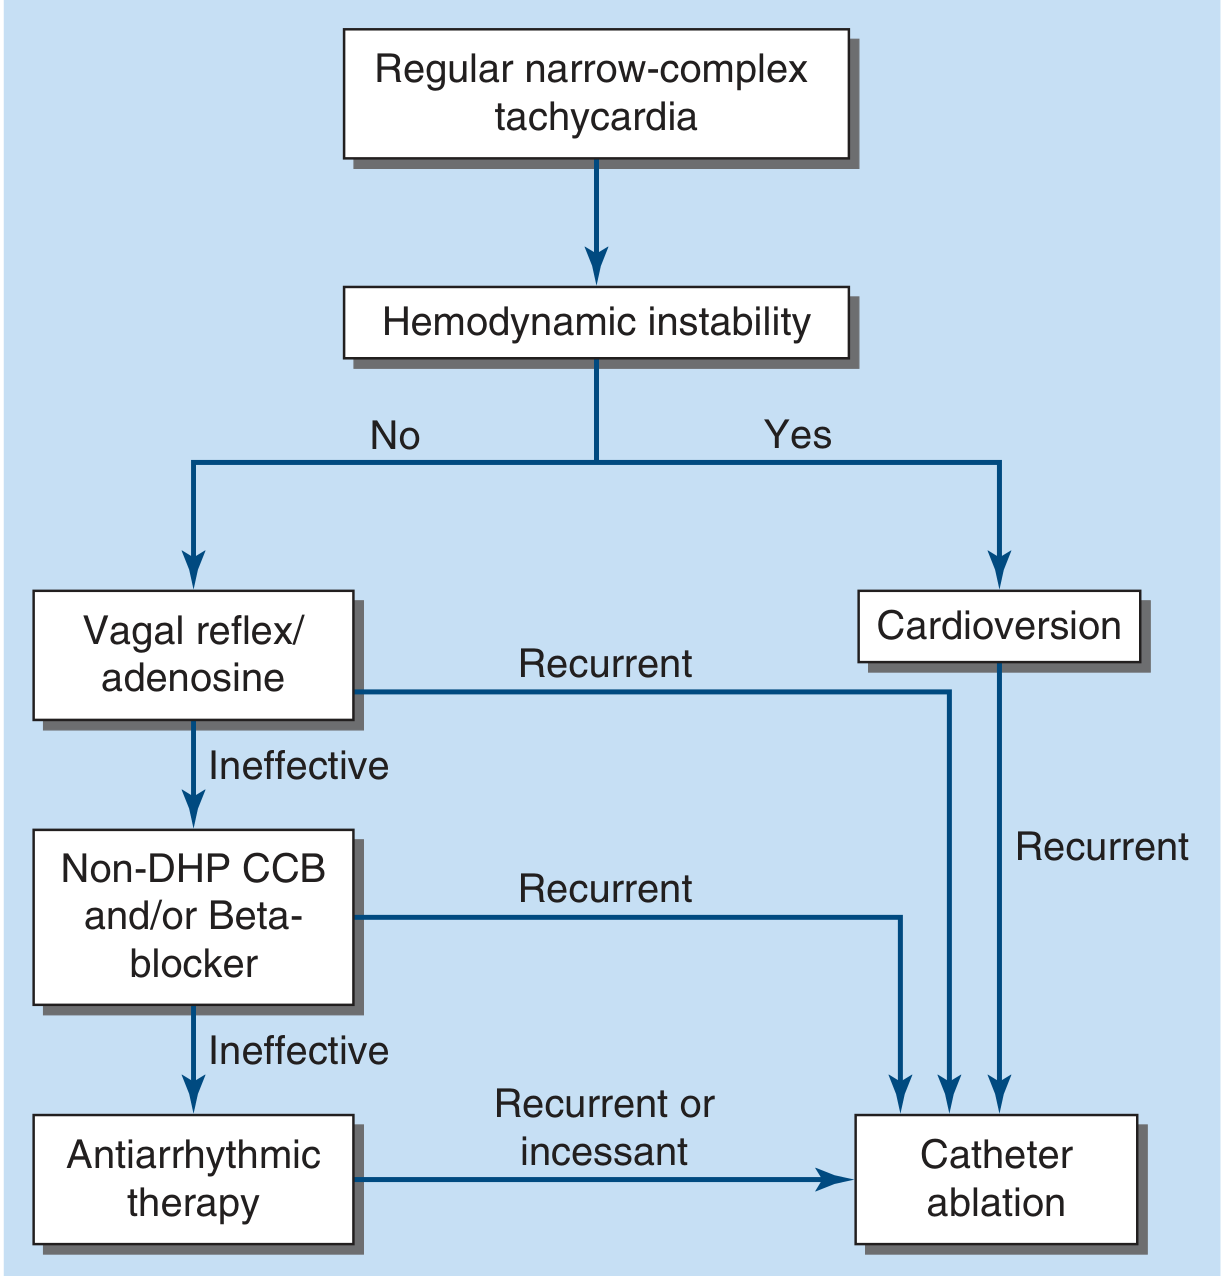
Step 1 - Assess Hemodynamic Stability
Hemodynamically unstable (hypotension with unconsciousness, respiratory distress): Proceed directly to synchronised DC cardioversion.
Hemodynamically stable: Follow the stepwise algorithm below.
Step 2 - Vagal Maneuvers (first-line in stable patients)
- Valsalva maneuver - most effective; teach the patient for self-use at home
- Carotid sinus massage - reasonable if no carotid bruits or history of stroke (risk of carotid vascular disease must be excluded)
- Modified Valsalva (semi-recumbent position, strain, then supine with passive leg raise) increases effectiveness
- Mechanism: increases vagal tone → slows/blocks AV nodal conduction → breaks the reentry circuit
Step 3 - IV Adenosine (if vagal maneuvers fail or are not possible)
- Drug of choice for acute termination of PSVT
- Mechanism: transiently blocks AV nodal conduction
- Dose: 6 mg IV rapid bolus (peripheral large-bore IV, followed by saline flush); if ineffective after 1-2 min, give 12 mg (may repeat once)
- Works in the vast majority of PSVT episodes
- Side effects: transient chest pain, dyspnea, flushing, anxiety (short-lived due to <10-second half-life)
- Contraindications/Cautions:
- Cardiac transplant recipients (hypersensitivity due to denervation - avoid)
- Can theoretically aggravate bronchospasm
- Precipitates AF in up to 15% of patients - use cautiously in WPW (preexcited AF can cause hemodynamic instability)
- Diagnostic value: if AV block occurs but tachycardia continues, it reveals ongoing P waves - indicating atrial tachycardia or flutter as the mechanism
Step 4 - IV Beta-blockers or Non-DHP Calcium Channel Blockers (if adenosine fails)
- Verapamil or diltiazem IV - effective but slower onset, risk of hypotension
- Metoprolol or other beta-blockers IV
- Caution: may cause hypotension before and after arrhythmia termination; longer duration of action than adenosine
- These can also be given orally on an as-needed (pill-in-pocket) basis for recurrent episodes, combined with Valsalva
Wide-Complex Tachycardia Consideration
- If rhythm is regular and patient is stable: a trial of adenosine IV is reasonable
- Very irregular wide-complex tachycardia → likely preexcited AF/flutter (WPW) → manage with cardioversion, IV procainamide, or ibutilide (do NOT use AV nodal blocking agents like verapamil/diltiazem - may accelerate conduction down the AP and cause VF)
Treatment Algorithm (Harrison's Principles of Internal Medicine, 22E)
Long-Term / Definitive Management
| Option | Details |
|---|---|
| Catheter ablation | Preferred for most patients with recurrent episodes; >95% cure rate for AVNRT; first-line for symptomatic WPW |
| Oral beta-blockers or non-DHP CCBs | Reasonable for rate/frequency control in patients who decline ablation |
| Class IC antiarrhythmics (flecainide, propafenone) | For AVRT not suitable for ablation; avoid in structural heart disease |
| Pill-in-pocket (oral diltiazem + beta-blocker) | Patient self-administers at onset of tachycardia |
- Harrison's Principles of Internal Medicine 22E, p. 1986
- Tintinalli's Emergency Medicine, p. 152-153
Special Situations
| Situation | Consideration |
|---|---|
| WPW with PSVT | Adenosine OK for orthodromic AVRT; avoid for preexcited (wide complex) AF - risk of VF |
| Pregnancy | Adenosine is safe; DC cardioversion if unstable |
| Pediatrics | Rate >220 bpm in infants or >180 bpm in children suggests SVT vs. sinus tachycardia; treat similarly |
| Post-cardiac transplant | Avoid adenosine (exaggerated effect due to denervation) |
| Recurrent/incessant | Refer for electrophysiology study and catheter ablation |
Key Teaching Points
- Narrow, regular, rapid tachycardia with absent or retrograde P waves = PSVT until proven otherwise
- Vagal first, then adenosine - this works in the vast majority
- Continuous ECG monitoring during treatment - the response may reveal the mechanism (e.g., AT/flutter unmasked by AV block)
- Never use verapamil/diltiazem in wide-complex irregular tachycardia with suspected WPW - can be fatal
- Catheter ablation is the definitive cure for recurrent symptomatic PSVT