attachment
attachment

Give me final conclusion and how to overcome this problem

Reading File
analyse_media
Finding Sources
Finding Sources
Finding Sources
Finding Sources
Finding Sources
Finding Sources
Finding Sources
Reading File
Reading File
I now have comprehensive information. Here is the full analysis:

Lab Report Analysis - Samarth V J (22Y/Male)

Lab Values Summary

TestResultReference RangeStatus
Serum Iron159.59 µg/dLMale: 65-175 µg/dL✅ Normal (upper range)
TIBC275.7 µg/dLMale: 225-535 µg/dL✅ Normal
% Transferrin Saturation57.89%13-45%⚠️ HIGH
UIBC116.1 µg/dL162-368 µg/dL⚠️ LOW

Final Conclusion

The pattern here is clear and clinically significant:
  • Serum iron is normal to high-normal (159.59 µg/dL - near the upper limit)
  • TIBC is normal but on the lower end (275.7 µg/dL)
  • Transferrin saturation is elevated at 57.89% - well above the upper limit of 45%. In males, values >50% are considered abnormal and a red flag for iron overload
  • UIBC is low at 116.1 µg/dL - this means very little iron-binding capacity remains unused, confirming that transferrin is largely saturated with iron
Together, this pattern - high transferrin saturation + low UIBC + normal-to-high serum iron - is the classic screening pattern for iron overload / hereditary hemochromatosis (HH).
According to Henry's Clinical Diagnosis and Management by Laboratory Methods, transferrin saturation >50% in men is the key screening threshold for hemochromatosis, and should be confirmed with a fasting repeat test and serum ferritin level. The triad of signs in untreated disease includes bronze skin pigmentation, cirrhosis, and diabetes.
However, this is a partial iron panel - serum ferritin is missing from this report. The report is labeled "AAROGYAM C PRO WITH UTSH," which may include more parameters on other pages.

What to Do Next - Step by Step

Immediate (Confirm the Finding)

  1. Repeat transferrin saturation fasting - a fasting sample gives the most accurate result; a non-fasting sample can falsely elevate saturation
  2. Check serum ferritin - if ferritin is also elevated (>300 ng/mL in men), combined with TS >45%, this strongly supports iron overload
  3. Full blood count (CBC) - to look for hemolytic or other anemia that can cause secondary iron overload

If Both TS and Ferritin Are Elevated

  1. HFE gene mutation testing - test for C282Y and H63D mutations, which account for >80% of hereditary hemochromatosis cases
  2. Liver function tests (LFTs) - iron overload preferentially damages the liver
  3. MRI liver - non-invasive quantification of liver iron content
  4. Liver biopsy - considered if ferritin >1000 ng/mL, age >40, or clinical liver disease

Management (If Hemochromatosis Confirmed)

The primary treatment is therapeutic phlebotomy (venesection):
  • Removing 450-500 mL of blood weekly or every 2 weeks
  • Each session removes approximately 200-250 mg of iron
  • Continue until ferritin drops to 50-100 µg/L and TS normalizes to <30-45%
  • Then maintenance phlebotomy every 2-4 months lifelong
Dietary and lifestyle measures:
  • Avoid vitamin C supplements - vitamin C enhances iron absorption and can worsen iron overload
  • Avoid raw seafood (especially shellfish) - risk of Vibrio vulnificus infection is dramatically increased with iron overload
  • Reduce red meat and organ meats (liver, kidney) - high heme iron sources
  • Limit alcohol - alcohol accelerates liver damage already promoted by iron
  • Avoid iron-containing multivitamins or iron supplements
  • Tea with meals can mildly reduce non-heme iron absorption (tannins bind iron)
If phlebotomy is not tolerated (e.g., anemia):
  • Iron chelation therapy with deferasirox or deferoxamine is the alternative
Family screening:
  • First-degree relatives (parents, siblings) should be screened with iron studies and HFE genotyping, as 1 in 4 siblings may be affected

Important Caveat

This report shows the hallmark pattern of iron overload, but a diagnosis cannot be made on this panel alone. At 22 years old, a young male with high transferrin saturation should be taken seriously - juvenile hereditary hemochromatosis (caused by hemojuvelin or hepcidin gene mutations) can present in this age group with rapid iron accumulation and early cardiac and endocrine involvement. The treating physician (Dr. Deepti Ravishankar) should be consulted promptly for the next diagnostic steps.
  • Andrews' Diseases of the Skin, p. 999
  • Henry's Clinical Diagnosis and Management by Laboratory Methods, p. 3284-3286

Search for images of hemochromatosis complications (liver, skin, cardiac)

Searching Images

hemochromatosis liver cirrhosis iron deposition pathology
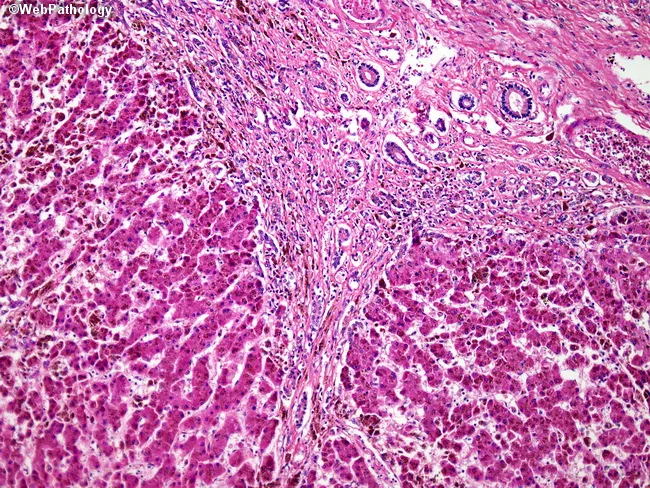
Light microscopy of a liver biopsy from a patient with beta-thalassemia–related secondary iron overload. Hematoxylin and eosin stained tissue demonstrates widespread iron deposition within hepatocytes and Kupffer cells (siderosis), evidenced by coarse brown pigments concentrated in the cytoplasm. The hepatic architecture shows portal tracts with mild-to-moderate portal fibrosis and the development of fibrous septa bridging portal regions. Within these septa, ductular proliferation is evident, indicating a ductular reaction to chronic injury. Iron deposition begins in Kupffer cells and progressively involves hepatocytes, a pattern characteristic of secondary hemochromatosis due to transfusional iron overload rather than primary hereditary iron overload. The parenchyma retains overall lobular organization but shows increasing fibrogenesis and periportal architectural remodeling. These histologic features correlate with systemic iron loading, risk of progressive fibrosis, portal hypertension, and potential progression to cirrhosis if iron chelation therapy is not optimized. Clinically, this pattern helps distinguish from primary hemochromatosis, where hepatocytes are involved earlier and Kupffer cell iron deposition is less prominent in early stages. In beta-thalassemia, management focuses on iron chelation, monitoring liver iron concentration, ferritin, and liver function, with ongoing assessment of fibrosis progression via repeat biopsy or noninvasive imaging. This image is educational for hematology–liver pathology and transplant hepatology.
Light microscopy of a liver biopsy from a patient with beta-thalassemia–related secondary iron overload. Hematoxylin and eosin stained tissue demonstrates widespread iron deposition within hepatocytes and Kupffer cells (siderosis), evidenced by coarse brown pigments concentrated in the cytoplasm. The hepatic architecture shows portal tracts with mild-to-moderate portal fibrosis and the development of fibrous septa bridging portal regions. Within these septa, ductular proliferation is evident, indicating a ductular reaction to chronic injury. Iron deposition begins in Kupffer cells and progressively involves hepatocytes, a pattern characteristic of secondary hemochromatosis due to transfusional iron overload rather than primary hereditary iron overload. The parenchyma retains overall lobular organization but shows increasing fibrogenesis and periportal architectural remodeling. These histologic features correlate with systemic iron loading, risk of progressive fibrosis, portal hypertension, and potential progression to cirrhosis if iron chelation therapy is not optimized. Clinically, this pattern helps distinguish from primary hemochromatosis, where hepatocytes are involved earlier and Kupffer cell iron deposition is less prominent in early stages. In beta-thalassemia, management focuses on iron chelation, monitoring liver iron concentration, ferritin, and liver function, with ongoing assessment of fibrosis progression via repeat biopsy or noninvasive imaging. This image is educational for hematology–liver pathology and transplant hepatology.

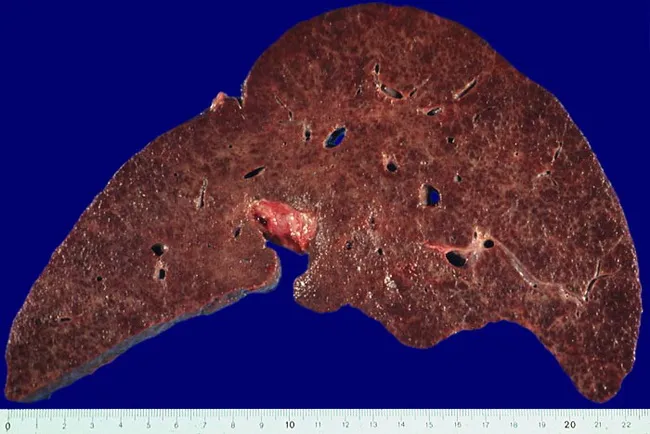
Imaging modality: Gross pathology photography of an excised liver. Specimen: whole liver with transection showing nodular surface. Anatomical location: hepatic parenchyma within the right and left lobes of the liver. The specimen demonstrates micronodular cirrhosis, a classic morphologic consequence of long-standing hereditary hemochromatosis (HFE-related), characterized by numerous small regenerative nodules that disrupt normal architecture. The color is variably brown to reddish-brown, reflecting iron deposition (siderosis) in hepatocytes and Kupffer cells; over time, periportal ferritin accumulates and parenchymal fibrosis progresses to cirrhosis with architectural remodeling and potential hepatocellular hyperplasia. The nodularity is coarse, with a nodular surface evident on gross inspection; the cut surface may show fibrous septa and regions of regenerative nodules. In hereditary hemochromatosis, iron overload begins in periportal hepatocytes and spreads to hepatocytes and bile ducts, correlating with disease stage. The clinical significance includes risk of progressive fibrosis, portal hypertension, cirrhosis, hepatocellular carcinoma, and liver failure if untreated. This image is valuable for education about genotype–phenotype correlations (classic HFE-related HH in susceptible populations), macroscopic liver pathology in iron overload, and gross-pathology correlation with histologic iron deposition. Potential clinical use cases: pathology teaching, radiologic-pathologic correlation, and comparative studies of cirrhotic nodularity.
Imaging modality: Gross pathology photography of an excised liver. Specimen: whole liver with transection showing nodular surface. Anatomical location: hepatic parenchyma within the right and left lobes of the liver. The specimen demonstrates micronodular cirrhosis, a classic morphologic consequence of long-standing hereditary hemochromatosis (HFE-related), characterized by numerous small regenerative nodules that disrupt normal architecture. The color is variably brown to reddish-brown, reflecting iron deposition (siderosis) in hepatocytes and Kupffer cells; over time, periportal ferritin accumulates and parenchymal fibrosis progresses to cirrhosis with architectural remodeling and potential hepatocellular hyperplasia. The nodularity is coarse, with a nodular surface evident on gross inspection; the cut surface may show fibrous septa and regions of regenerative nodules. In hereditary hemochromatosis, iron overload begins in periportal hepatocytes and spreads to hepatocytes and bile ducts, correlating with disease stage. The clinical significance includes risk of progressive fibrosis, portal hypertension, cirrhosis, hepatocellular carcinoma, and liver failure if untreated. This image is valuable for education about genotype–phenotype correlations (classic HFE-related HH in susceptible populations), macroscopic liver pathology in iron overload, and gross-pathology correlation with histologic iron deposition. Potential clinical use cases: pathology teaching, radiologic-pathologic correlation, and comparative studies of cirrhotic nodularity.

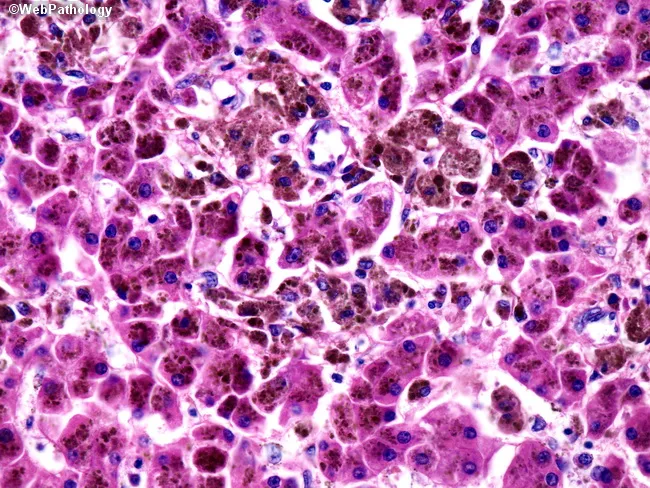
Imaging modality: light microscopy of hematoxylin and eosin stained liver biopsy section (parenchyma). The liver tissue demonstrates secondary iron overload with heavy iron deposition (siderosis) primarily within Kupffer cells and extending into adjacent hepatocytes. At high magnification, dark brown to black granular and clumped pigment is evident within the cytoplasm of macrophages and hepatocytes; the pigment corresponds to hemosiderin and appears as coarse intracellular aggregates. The overall hepatic architecture is preserved with intact lobular arrangement; eventual expansion of sinusoids may be seen in iron overload. In this specimen, the distribution begins in the reticuloendothelial system (Kupffer cells) and progressively involves parenchymal hepatocytes, consistent with secondary hemochromatosis due to exogenous iron load from chronic transfusions, hemolysis, or dialysis. The pigment is best highlighted by iron-specific staining (Prussian blue) though not shown here; ferritin and transferrin saturation may be altered clinically. Pathologic implications include potential progression to fibrosis and cirrhosis if iron deposition is sustained. Clinically, this pattern helps distinguish secondary iron overload from hereditary hemochromatosis, where hepatocyte involvement can precede Kupffer cell iron loading. The image provides educational value for hepatology, pathology, and medical training in iron metabolism, siderosis, and iron-chelation decision-making. This feature underscores the need for chelation therapy assessment.
Imaging modality: light microscopy of hematoxylin and eosin stained liver biopsy section (parenchyma). The liver tissue demonstrates secondary iron overload with heavy iron deposition (siderosis) primarily within Kupffer cells and extending into adjacent hepatocytes. At high magnification, dark brown to black granular and clumped pigment is evident within the cytoplasm of macrophages and hepatocytes; the pigment corresponds to hemosiderin and appears as coarse intracellular aggregates. The overall hepatic architecture is preserved with intact lobular arrangement; eventual expansion of sinusoids may be seen in iron overload. In this specimen, the distribution begins in the reticuloendothelial system (Kupffer cells) and progressively involves parenchymal hepatocytes, consistent with secondary hemochromatosis due to exogenous iron load from chronic transfusions, hemolysis, or dialysis. The pigment is best highlighted by iron-specific staining (Prussian blue) though not shown here; ferritin and transferrin saturation may be altered clinically. Pathologic implications include potential progression to fibrosis and cirrhosis if iron deposition is sustained. Clinically, this pattern helps distinguish secondary iron overload from hereditary hemochromatosis, where hepatocyte involvement can precede Kupffer cell iron loading. The image provides educational value for hepatology, pathology, and medical training in iron metabolism, siderosis, and iron-chelation decision-making. This feature underscores the need for chelation therapy assessment.

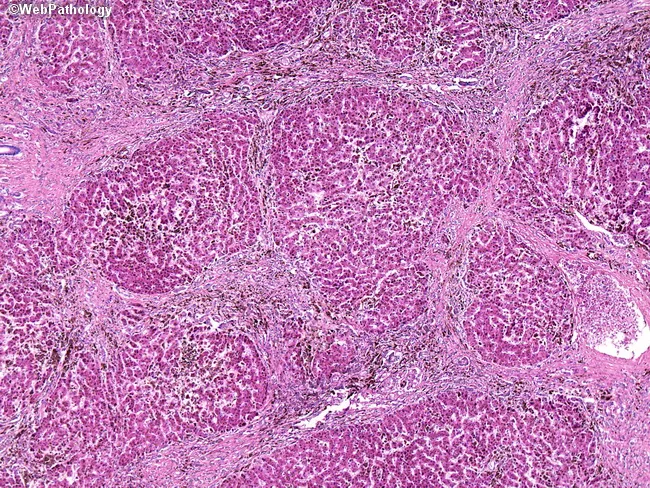
This is a liver biopsy histology image prepared with Hematoxylin and Eosin staining, viewed under brightfield microscopy at moderate to high magnification. The liver architecture shows preserved lobular arrangement but with evident iron deposition characteristic of secondary iron overload due to beta-thalassemia requiring chronic transfusions. Iron deposition is evident in both Kupffer cells (reticuloendothelial system) and hepatocytes (hepatocytic siderosis), creating conspicuously dense, variably aggregates of granular, coarse ferritin/hemosiderin pigment within cytoplasm. The portal tracts display early portal fibrosis with formation of septa bridging across lobules, consistent with progressing siderotic liver disease. Sinusoidal congestion may be present; there is no overt steatosis or ballooning change described. The staining highlights iron presence; if Prussian blue were performed, iron deposits would appear blue and confirm hemosiderosis. The observed pattern—Kupffer cell predominance early, with later hepatocytic involvement—aligns with secondary iron overload from transfusion-dependent anemia (beta-thalassemia) rather than primary hereditary hemochromatosis. Clinically, this correlates with chronic transfusion therapy and risk of fibrosis, cirrhosis, and liver dysfunction. These features underscore the diagnostic significance of hepatic iron quantification and histopathologic scoring to guide chelation therapy and monitor hepatic injury. Correlation with ferritin trends and liver function tests is essential for treatment planning.

This is a liver biopsy histology image prepared with Hematoxylin and Eosin staining, viewed under brightfield microscopy at moderate to high magnification. The liver architecture shows preserved lobular arrangement but with evident iron deposition characteristic of secondary iron overload due to beta-thalassemia requiring chronic transfusions. Iron deposition is evident in both Kupffer cells (reticuloendothelial system) and hepatocytes (hepatocytic siderosis), creating conspicuously dense, variably aggregates of granular, coarse ferritin/hemosiderin pigment within cytoplasm. The portal tracts display early portal fibrosis with formation of septa bridging across lobules, consistent with progressing siderotic liver disease. Sinusoidal congestion may be present; there is no overt steatosis or ballooning change described. The staining highlights iron presence; if Prussian blue were performed, iron deposits would appear blue and confirm hemosiderosis. The observed pattern—Kupffer cell predominance early, with later hepatocytic involvement—aligns with secondary iron overload from transfusion-dependent anemia (beta-thalassemia) rather than primary hereditary hemochromatosis. Clinically, this correlates with chronic transfusion therapy and risk of fibrosis, cirrhosis, and liver dysfunction. These features underscore the diagnostic significance of hepatic iron quantification and histopathologic scoring to guide chelation therapy and monitor hepatic injury. Correlation with ferritin trends and liver function tests is essential for treatment planning.

Searching Images

hemochromatosis skin bronze pigmentation hyperpigmentation
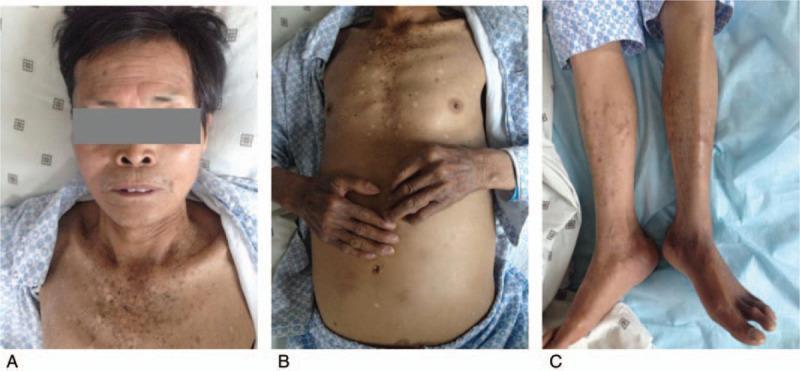
Clinical photographs of a 65-year-old male demonstrating systemic skin hyperpigmentation, a characteristic finding in hereditary hemochromatosis (bronze diabetes). Panel A shows the face and upper chest with a speckled, mottled pattern consisting of numerous small dark macules and patches. Panel B displays the trunk and dorsal surfaces of the hands; the torso exhibits generalized tanning with uneven pigment distribution, and the hands show prominent hyperpigmentation relative to the forearms. Panel C illustrates the lower extremities, where the hyperpigmentation is most pronounced on the distal aspects of the feet and toes, appearing as a dark brownish-purple hue. The legs show a scattered, mottled pigmentary pattern. These visual signs, combined with the patient's history of liver cirrhosis and diabetes, represent the classic 'bronzing' of the skin due to systemic iron overload and increased melanin production. The presentation is medically significant for the diagnosis of secondary or hereditary hemochromatosis involving iron deposition in various organs.
Clinical photographs of a 65-year-old male demonstrating systemic skin hyperpigmentation, a characteristic finding in hereditary hemochromatosis (bronze diabetes). Panel A shows the face and upper chest with a speckled, mottled pattern consisting of numerous small dark macules and patches. Panel B displays the trunk and dorsal surfaces of the hands; the torso exhibits generalized tanning with uneven pigment distribution, and the hands show prominent hyperpigmentation relative to the forearms. Panel C illustrates the lower extremities, where the hyperpigmentation is most pronounced on the distal aspects of the feet and toes, appearing as a dark brownish-purple hue. The legs show a scattered, mottled pigmentary pattern. These visual signs, combined with the patient's history of liver cirrhosis and diabetes, represent the classic 'bronzing' of the skin due to systemic iron overload and increased melanin production. The presentation is medically significant for the diagnosis of secondary or hereditary hemochromatosis involving iron deposition in various organs.

This composite educational image illustrates clinical and pathological features of hereditary hemochromatosis. 

Image A is a clinical photograph of a male patient demonstrating generalized skin hyperpigmentation, often referred to as 'bronze' coloration. A side-by-side comparison with the patient’s own hand highlights the marked contrast between the tanned, metallic hue of the facial skin and a more typical Caucasian skin tone. The sclerae also appear to show slight icteric or pigmented changes. 

Image B is a gross pathology photograph showing a dissected organ, the pancreas, which exhibits a characteristic dark, black-greyish discoloration. This color change is a result of extensive parenchymal iron deposition (hemosiderosis) common in advanced iron overload syndromes. The tissue appears rigid and shows signs of inflammatory disruption, surrounded by vascular congestion and fluid. 

Together, these images illustrate 'bronze diabetes,' the classic triad of hyperpigmentation, diabetes mellitus (via pancreatic damage), and cirrhosis associated with chronic iron overload in hereditary hemochromatosis.
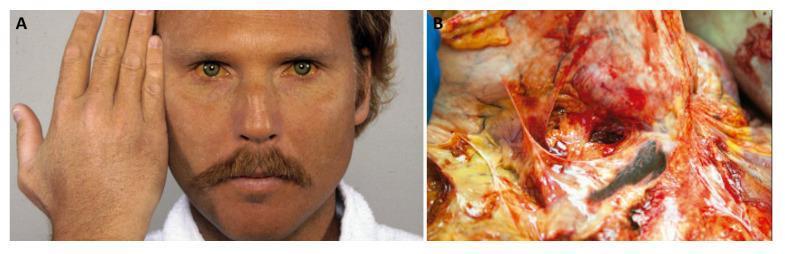
This composite educational image illustrates clinical and pathological features of hereditary hemochromatosis. Image A is a clinical photograph of a male patient demonstrating generalized skin hyperpigmentation, often referred to as 'bronze' coloration. A side-by-side comparison with the patient’s own hand highlights the marked contrast between the tanned, metallic hue of the facial skin and a more typical Caucasian skin tone. The sclerae also appear to show slight icteric or pigmented changes. Image B is a gross pathology photograph showing a dissected organ, the pancreas, which exhibits a characteristic dark, black-greyish discoloration. This color change is a result of extensive parenchymal iron deposition (hemosiderosis) common in advanced iron overload syndromes. The tissue appears rigid and shows signs of inflammatory disruption, surrounded by vascular congestion and fluid. Together, these images illustrate 'bronze diabetes,' the classic triad of hyperpigmentation, diabetes mellitus (via pancreatic damage), and cirrhosis associated with chronic iron overload in hereditary hemochromatosis.

A multi-panel figure illustrating the clinical and radiological manifestations of juvenile hereditary hemochromatosis. Panels (a) and (b) are clinical photographs showing focal skin hyperpigmentation: (a) demonstrates speckled, slight pigmentation on the anterior tibia of the lower limbs, while (b) shows more diffuse, uniform dark pigmentation on the left hand compared to the right. Panels (c) through (f) display MRI diagnostic images highlighting systemic iron overload. In (c) and (f), axial abdominal MRI scans reveal significantly reduced T2 signal intensity in the liver and spleen (indicated by white arrows), appearing as 'black matter lesions' characteristic of excessive iron deposition. Panel (d) shows an axial cardiac MRI with low myocardial signal (arrow), indicating cardiac iron involvement. Panel (e) is a sagittal cranial MRI demonstrating decreased signal intensity within the pituitary gland (arrow). These visual findings collectively teach the multi-organ impact of iron overload, affecting the skin, liver, heart, and endocrine system in a clinical syndrome associated with HAMP gene mutations.
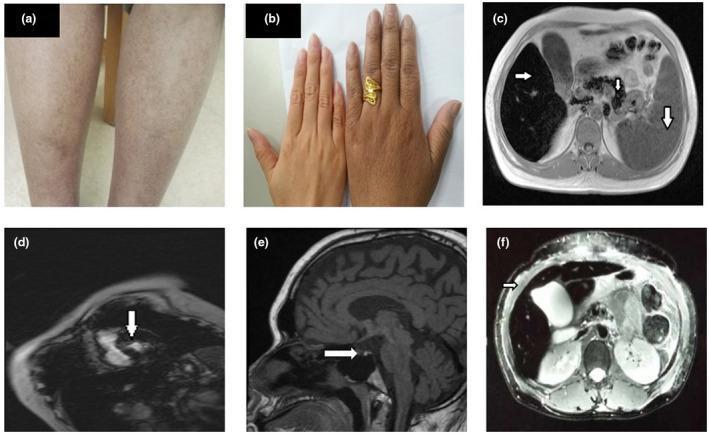
A multi-panel figure illustrating the clinical and radiological manifestations of juvenile hereditary hemochromatosis. Panels (a) and (b) are clinical photographs showing focal skin hyperpigmentation: (a) demonstrates speckled, slight pigmentation on the anterior tibia of the lower limbs, while (b) shows more diffuse, uniform dark pigmentation on the left hand compared to the right. Panels (c) through (f) display MRI diagnostic images highlighting systemic iron overload. In (c) and (f), axial abdominal MRI scans reveal significantly reduced T2 signal intensity in the liver and spleen (indicated by white arrows), appearing as 'black matter lesions' characteristic of excessive iron deposition. Panel (d) shows an axial cardiac MRI with low myocardial signal (arrow), indicating cardiac iron involvement. Panel (e) is a sagittal cranial MRI demonstrating decreased signal intensity within the pituitary gland (arrow). These visual findings collectively teach the multi-organ impact of iron overload, affecting the skin, liver, heart, and endocrine system in a clinical syndrome associated with HAMP gene mutations.

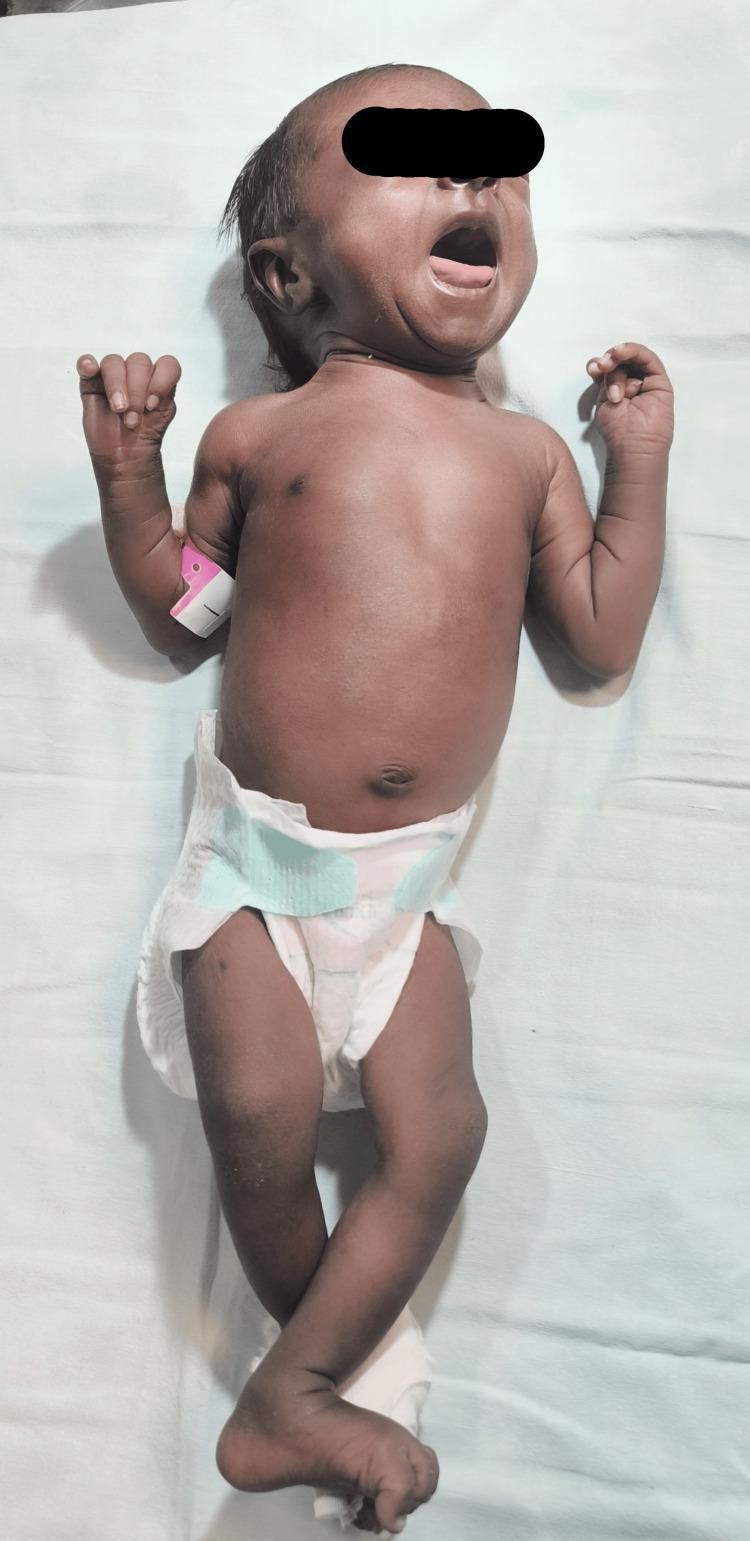
This clinical photograph displays a female neonate in a supine position, illustrating generalized hyperpigmentation of the skin. The pigmentation is diffuse and relatively uniform across the face, torso, and extremities, presenting as a deep bronze or dark brown hue. The skin texture appears smooth without visible primary lesions, rashes, or mottling. Key clinical features include the absence of visible jaundice or cyanosis, although the intense pigmentation can mask subtle vascular changes. An identification band is visible on the upper left arm, and a diaper is in place. In a neonatal context, such progressive, generalized hyperpigmentation is a significant clinical sign often associated with endocrine disorders, specifically primary adrenal insufficiency (such as Congenital Adrenal Hyperplasia), where elevated levels of adrenocorticotropic hormone (ACTH) lead to increased melanocyte stimulation. This image serves as an educational tool for recognizing systemic manifestations of metabolic and endocrine pathologies in pediatrics.

This clinical photograph displays a female neonate in a supine position, illustrating generalized hyperpigmentation of the skin. The pigmentation is diffuse and relatively uniform across the face, torso, and extremities, presenting as a deep bronze or dark brown hue. The skin texture appears smooth without visible primary lesions, rashes, or mottling. Key clinical features include the absence of visible jaundice or cyanosis, although the intense pigmentation can mask subtle vascular changes. An identification band is visible on the upper left arm, and a diaper is in place. In a neonatal context, such progressive, generalized hyperpigmentation is a significant clinical sign often associated with endocrine disorders, specifically primary adrenal insufficiency (such as Congenital Adrenal Hyperplasia), where elevated levels of adrenocorticotropic hormone (ACTH) lead to increased melanocyte stimulation. This image serves as an educational tool for recognizing systemic manifestations of metabolic and endocrine pathologies in pediatrics.

Searching Images

hemochromatosis cardiac cardiomyopathy iron overload heart
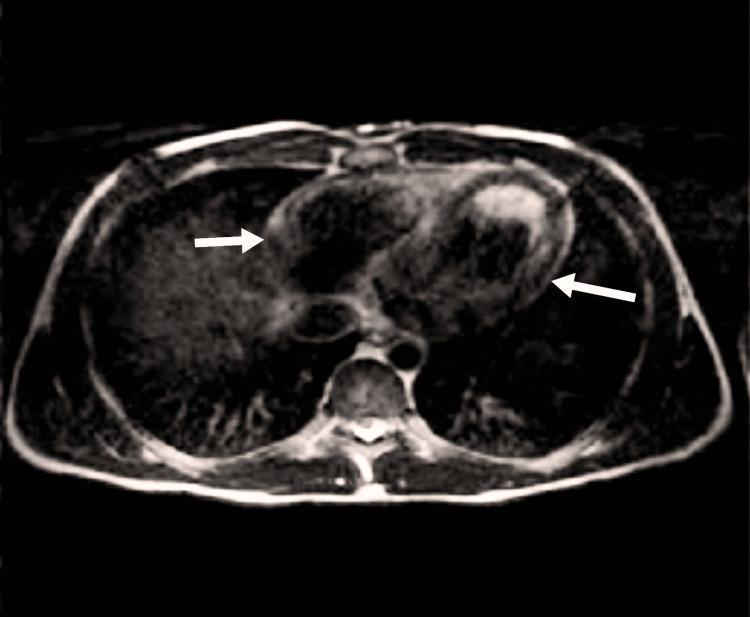
This diagnostic image is an axial T2* magnetic resonance imaging (MRI) scan of the thorax, specifically focusing on the cardiac region. The image demonstrates the heart in a cross-sectional view, surrounded by the lungs and posterior vertebral structures. Two white arrows indicate localized areas of significant low signal intensity (hypointensity) within the myocardial wall. These dark regions are characteristic of iron overload or hemosiderosis, as iron deposits cause rapid T2* relaxation and subsequent signal loss. The clinical significance of this finding relates to the assessment of cardiac iron deposition in patients with secondary hemochromatosis or chronic transfusion requirements. The lungs appear dark due to low proton density and air content, while the chest wall and subcutaneous fat provide a brighter peripheral signal. This modality is the gold standard for non-invasive quantification of myocardial iron, aiding in the diagnosis of iron-overload cardiomyopathy.
This diagnostic image is an axial T2* magnetic resonance imaging (MRI) scan of the thorax, specifically focusing on the cardiac region. The image demonstrates the heart in a cross-sectional view, surrounded by the lungs and posterior vertebral structures. Two white arrows indicate localized areas of significant low signal intensity (hypointensity) within the myocardial wall. These dark regions are characteristic of iron overload or hemosiderosis, as iron deposits cause rapid T2* relaxation and subsequent signal loss. The clinical significance of this finding relates to the assessment of cardiac iron deposition in patients with secondary hemochromatosis or chronic transfusion requirements. The lungs appear dark due to low proton density and air content, while the chest wall and subcutaneous fat provide a brighter peripheral signal. This modality is the gold standard for non-invasive quantification of myocardial iron, aiding in the diagnosis of iron-overload cardiomyopathy.

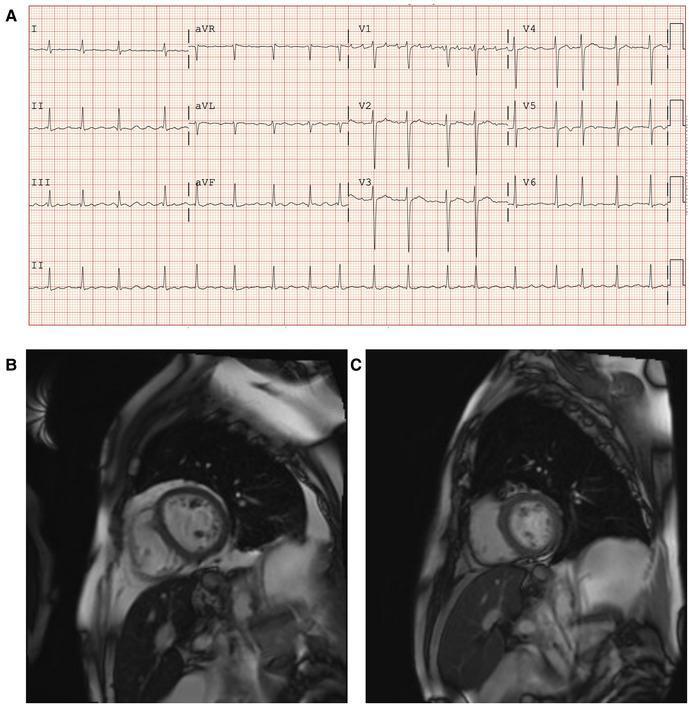
This composite educational graphic illustrates the diagnosis and treatment response of Iron Overload Cardiomyopathy (IOC) in a patient with primary hemochromatosis. Panel A presents a standard twelve-lead electrocardiogram (ECG) showing atrial flutter with a ventricular rate of approximately 105 beats per minute and non-specific T-wave inversions in the lateral leads (V4-V6), indicative of conduction abnormalities. Panels B and C show Cardiac Magnetic Resonance (CMR) short-axis views with T2* mapping for myocardial iron quantification. Panel B (baseline) demonstrates darkened myocardial signal intensity, particularly in the left ventricle, corresponding to moderate iron loading (T2* value of 12–13 ms) and significant hepatic iron overload. Panel C (12-month follow-up) shows the same anatomical view after iron chelation therapy with adjunctive amlodipine. The improved signal intensity in the myocardium (T2* of 26 ms) indicates a successful reduction in iron deposition and restoration of near-normal myocardial tissue characteristics, correlating with improved systolic and diastolic function.
This composite educational graphic illustrates the diagnosis and treatment response of Iron Overload Cardiomyopathy (IOC) in a patient with primary hemochromatosis. Panel A presents a standard twelve-lead electrocardiogram (ECG) showing atrial flutter with a ventricular rate of approximately 105 beats per minute and non-specific T-wave inversions in the lateral leads (V4-V6), indicative of conduction abnormalities. Panels B and C show Cardiac Magnetic Resonance (CMR) short-axis views with T2* mapping for myocardial iron quantification. Panel B (baseline) demonstrates darkened myocardial signal intensity, particularly in the left ventricle, corresponding to moderate iron loading (T2* value of 12–13 ms) and significant hepatic iron overload. Panel C (12-month follow-up) shows the same anatomical view after iron chelation therapy with adjunctive amlodipine. The improved signal intensity in the myocardium (T2* of 26 ms) indicates a successful reduction in iron deposition and restoration of near-normal myocardial tissue characteristics, correlating with improved systolic and diastolic function.

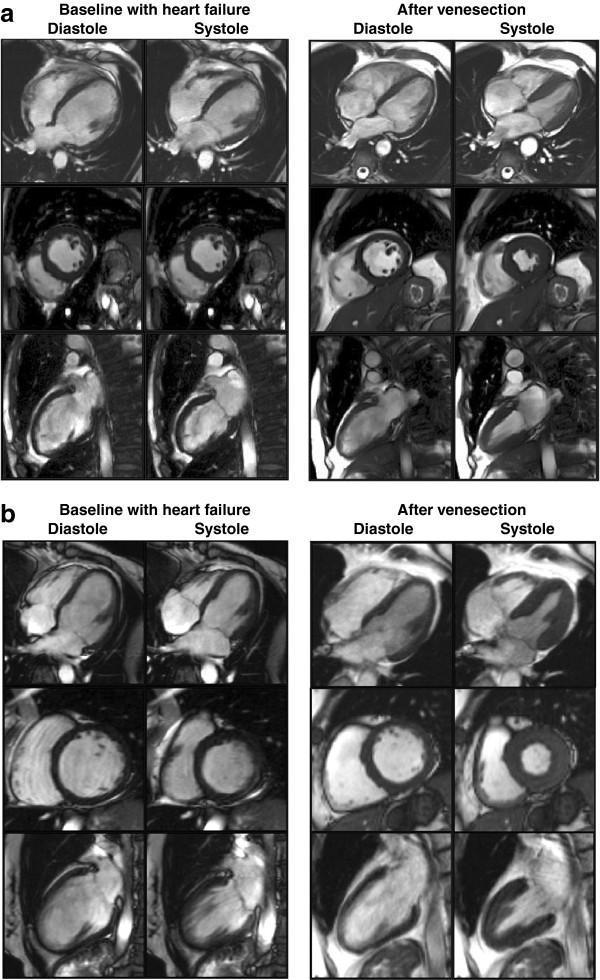
This diagnostic image display consists of two panels (a and b) showing Cardiac Magnetic Resonance (CMR) scans of two different patients with C282Y homozygous hereditary hemochromatosis. Each panel provides a comparison between 'Baseline with heart failure' and 'After venesection' states, captured during both end-diastole and end-systole. The CMR views include the horizontal long axis (top row), mid-ventricular short axis (middle row), and vertical long axis (bottom row). 

At baseline, the images demonstrate features of dilated cardiomyopathy: a globally enlarged, more spherical left ventricle (LV) with thinned myocardial walls and significantly reduced systolic wall thickening, correlating with a low Left Ventricular Ejection Fraction (LVEF). Post-venesection images show marked clinical improvement, characterized by a reduction in LV chamber size, more conical ventricular morphology, and increased myocardial wall thickening during systole, indicating recovered LVEF. The scans illustrate the reversibility of iron-overload induced cardiac dysfunction through iron removal therapy (venesection), providing a visual representation of improved myocardial T2* values and ventricular remodeling.

This diagnostic image display consists of two panels (a and b) showing Cardiac Magnetic Resonance (CMR) scans of two different patients with C282Y homozygous hereditary hemochromatosis. Each panel provides a comparison between 'Baseline with heart failure' and 'After venesection' states, captured during both end-diastole and end-systole. The CMR views include the horizontal long axis (top row), mid-ventricular short axis (middle row), and vertical long axis (bottom row). At baseline, the images demonstrate features of dilated cardiomyopathy: a globally enlarged, more spherical left ventricle (LV) with thinned myocardial walls and significantly reduced systolic wall thickening, correlating with a low Left Ventricular Ejection Fraction (LVEF). Post-venesection images show marked clinical improvement, characterized by a reduction in LV chamber size, more conical ventricular morphology, and increased myocardial wall thickening during systole, indicating recovered LVEF. The scans illustrate the reversibility of iron-overload induced cardiac dysfunction through iron removal therapy (venesection), providing a visual representation of improved myocardial T2* values and ventricular remodeling.

Here are the medical images for hemochromatosis complications across all three organ systems:

Hemochromatosis Complications - Medical Images


🟫 Skin - Bronze Pigmentation

Systemic bronze hyperpigmentation (classic presentation)
Hemochromatosis bronze skin pigmentation - face and hands showing classic bronze/metallic discoloration
65-year-old male with hereditary hemochromatosis showing the classic "bronzing" - speckled hyperpigmentation on the face, trunk, and lower extremities. This is caused by a combination of iron deposition in the dermis AND increased epidermal melanin production.

"Bronze Diabetes" - skin + pancreatic iron overload
Hemochromatosis bronze diabetes - skin pigmentation and pancreatic iron deposition
Composite image: (A) facial bronzing with metallic hue compared to normal skin tone; (B) gross pathology of the pancreas showing characteristic black-grey discoloration from massive iron deposition - the mechanism of "bronze diabetes."

Juvenile hemochromatosis - multi-organ MRI + skin changes
Juvenile hemochromatosis MRI showing liver, heart, pituitary iron overload with skin hyperpigmentation
Young patient with HAMP gene mutation: (a-b) focal hyperpigmentation on shin and hand; (c-f) MRI showing dramatically reduced T2 signal (black = iron) in liver, spleen, heart, and pituitary - demonstrating why juvenile hemochromatosis is so dangerous. This pattern is relevant for Samarth given his age of 22.

🔴 Liver - Iron Overload Pathology

Gross pathology - micronodular cirrhosis from hereditary hemochromatosis
Hemochromatosis liver gross pathology - micronodular cirrhosis with iron deposition
Excised liver showing micronodular cirrhosis - the classic end-stage liver complication of HH. The reddish-brown color reflects iron (siderosis). Untreated iron overload progresses: periportal fibrosis → bridging fibrosis → cirrhosis → hepatocellular carcinoma (risk ×200 vs. normal).

Liver biopsy histology - hepatocyte iron deposition (H&E)
Liver biopsy histology showing iron deposition in hepatocytes and Kupffer cells - hemochromatosis
Light microscopy showing dark brown hemosiderin granules packed into hepatocytes and Kupffer cells. In primary hereditary hemochromatosis, hepatocyte involvement comes first (periportal distribution). Portal fibrosis and bridging septa are visible, indicating progression.

❤️ Cardiac - Iron Overload Cardiomyopathy

Cardiac MRI T2 showing myocardial iron deposition*
Cardiac MRI T2* showing hypointense signal in myocardium due to iron deposition - hemochromatosis
Axial T2 MRI - the gold standard for quantifying cardiac iron. White arrows point to areas of marked hypointensity (black) within the myocardial wall - iron deposits cause rapid T2* signal loss. T2* <20 ms = significant cardiac iron loading requiring urgent chelation.*

ECG + CMR - Before and After Iron Chelation Treatment
ECG showing atrial flutter and CMR showing myocardial iron improvement after chelation therapy
Panel A: ECG showing atrial flutter and T-wave inversions from iron-overload cardiomyopathy. Panels B vs C: CMR T2 maps showing dark myocardium before chelation (T2*=12ms, abnormal) vs. improved signal after treatment (T2*=26ms, near-normal) - demonstrating that cardiac iron overload IS reversible with early treatment.*

Dilated cardiomyopathy - reversal after venesection (phlebotomy)
Cardiac MRI showing dilated cardiomyopathy from hemochromatosis reversed after venesection
C282Y homozygous patients at baseline showing dilated, spherical left ventricle with thin walls and low ejection fraction (heart failure). After venesection (phlebotomy), the ventricle contracts to normal size and systolic function recovers - a powerful illustration of why early diagnosis and treatment matters.

Key Takeaway for Samarth's Case

These images illustrate exactly why the high transferrin saturation (57.89%) in Samarth's report needs to be followed up promptly. The progression goes: elevated TS → iron deposition → organ damage → irreversible cirrhosis/cardiomyopathy/diabetes. The good news shown by the last cardiac image: when caught early, these complications are largely reversible with phlebotomy.

I have been facing hair thinning and hair fall problem,,I have been prescribed trocosilk hair growth serum and trilast minoxidil and fenestiride serum and keratoboost tablets,,is this ok for my hair problem

Reading File
Searching the Web

trocosilk hair growth serum trilast minoxidil keratoboost tablets ingredients

Finding Sources
Reading Web Page

https://www.1mg.com/drugs/tricosilk-pro-hair-solution-779501

Finding Sources
Finding Sources
Reading File
Finding Sources
I now have comprehensive information. Here is the full breakdown:

Your Hair Loss Prescription - Full Review

First, let me decode the exact products prescribed to you:
Product NameWhat It Actually Contains
Trocosilk / Tricosilk Pro Hair SolutionMinoxidil 5% + Finasteride 0.1% (topical serum)
Trilast Minoxidil serumMinoxidil 5% (topical, possibly with added ingredients like biotin/peptides)
Fenestiride serumFinasteride (topical) - "fenestiride" is likely a brand name
Keratoboost tabletsOral supplement (typically contains biotin, keratin amino acids, zinc, vitamins)

Is This Regimen Appropriate? ✅ YES - with one important note

This is a well-recognized, evidence-backed treatment approach for androgenetic alopecia (male-pattern hair loss/thinning), which is the most common cause of hair thinning in young men. Here's why each component makes sense:

1. Minoxidil (in Tricosilk + Trilast) - ✅ First-line, FDA Approved

Minoxidil was the first drug approved by the FDA for male pattern baldness. It works by:
  • Opening potassium channels in hair follicle cells
  • Increasing blood flow and nutrient delivery to follicles
  • Enlarging miniaturized follicles and prolonging the anagen (growth) phase
The 5% concentration is the standard for men and has been shown in studies to work better than 2%. Clinical studies show 84% of men see positive results after 1 year of use.
Important: You may experience increased shedding in the first 4-6 weeks - this is normal and expected. It means the drug is working, pushing old telogen hairs out so new anagen hairs can grow. Do not stop because of this.
  • Cummings Otolaryngology, p. 445

2. Finasteride (in Tricosilk + Fenestiride serum) - ✅ Second first-line agent

Finasteride is a 5-alpha reductase inhibitor. It blocks the conversion of testosterone into DHT (dihydrotestosterone) - the hormone responsible for shrinking hair follicles in genetically susceptible people.
  • Tricosilk contains topical finasteride 0.1% - this is the newer topical formulation that acts locally on the scalp with far less systemic absorption than the oral 1mg pill
  • Topical finasteride significantly reduces the risk of sexual side effects compared to oral finasteride
The combination of minoxidil + finasteride is considered the most effective non-surgical treatment for androgenetic alopecia. A 2022 JAMA Dermatology network meta-analysis confirmed combination therapy outperforms either drug alone.
  • Goldman-Cecil Medicine, Treatment section

3. Keratoboost Tablets - ✅ Supportive role

Keratoboost typically contains:
  • Biotin (Vitamin B7) - supports keratin structure
  • Zinc - deficiency is associated with hair loss
  • Amino acids (cysteine, methionine) - building blocks of keratin
  • Vitamins (B complex, D, E)
These are not standalone treatments for pattern hair loss, but they support hair shaft strength and correct any nutritional deficiencies that could be worsening the problem. Given your iron study results from earlier, nutritional support is especially relevant for you.

⚠️ One Important Concern: Possible Duplication

Tricosilk already contains BOTH Minoxidil 5% + Finasteride 0.1%. If you're also applying separate Trilast Minoxidil serum and Fenestiride serum on top of this, you may be getting a double dose of both actives.
Confirm with your prescribing doctor (Dr. Deepti Ravishankar):
  • Should Tricosilk + separate minoxidil + separate finasteride all be used together, or is one of them redundant?
  • Are they meant to be used at different times of day (e.g., Tricosilk in the morning, minoxidil at night)?
This is important because excess topical finasteride can still be absorbed systemically, and doubling minoxidil doses does not improve results but increases side effect risk (scalp irritation, dryness).

How to Use This Regimen Correctly

StepInstructions
TimingApply topical serums once or twice daily to a clean, dry scalp
AmountUse as directed - usually 1 mL per application to affected areas
Do not wash for at least 4 hours after application
Keratoboost tabletsTake with food, once daily
ConsistencyResults take 3-6 months minimum - do NOT stop early
MaintenanceThese treatments must be continued - hair loss returns within months of stopping

Side Effects to Watch For

DrugPossible Side Effects
Minoxidil (topical)Scalp itching, dryness, flaking, initial shedding (weeks 4-6), rarely: facial hair growth if product runs down face
Finasteride (topical)Minimal at 0.1% topical dose; oral finasteride can cause decreased libido, erectile dysfunction ("post-finasteride syndrome") - much rarer with topical
KeratoboostGenerally safe; excess biotin can interfere with some thyroid and troponin lab tests

Connection to Your Earlier Iron Studies

Note: your iron report showed high transferrin saturation - iron overload can occasionally contribute to hair thinning through endocrine disruption (hypogonadism from iron deposition in the pituitary). Once your iron status is properly worked up and managed, it may also help your hair. Make sure your dermatologist and the doctor following up your iron studies are aware of each other's findings.

Bottom line: The regimen is clinically sound and appropriate for male androgenetic alopecia. Just clarify with your doctor whether all three topical products should be used simultaneously or if one is meant to replace another, to avoid unintended double-dosing.
This is a shared conversation. Sign in to Orris to start your own chat.