
Explain me Optical coherence tomography and how different structure retina veiw in Oct any how we diagnose
optical coherence tomography OCT retina layers normal
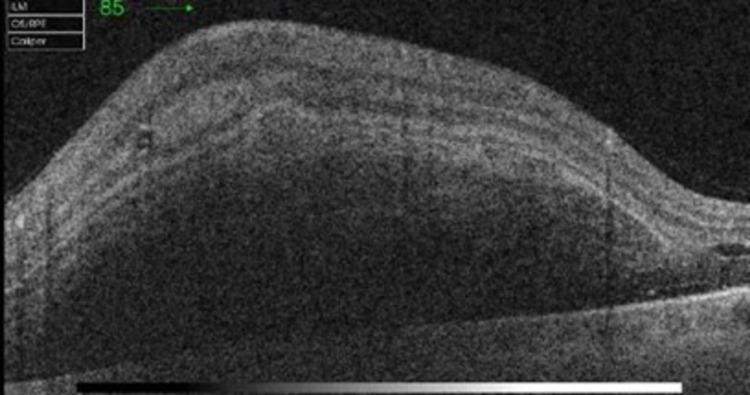
An optical coherence tomography (OCT) cross-sectional scan of the retina showing significant pathological structural alterations. The image demonstrates a massive, convex elevation of the retinal layers caused by a large accumulation of material. Key findings include dense, diffuse hyper-reflectivity localized within the inner retinal layers and the sub-retinal space, consistent with multi-layered (intra-retinal and sub-retinal) hemorrhage. This hyper-reflective material causes significant posterior shadowing, which obscures the underlying details of the outer retina, retinal pigment epithelium (RPE), and choroid. Adjacent to the primary mass, a sub-foveal area of hypo-reflectivity is visible, indicating the presence of sub-retinal serohematic fluid. The normal foveal contour and layered retinal architecture are severely disrupted. This diagnostic image is characteristic of acute macular hemorrhage, often associated with vascular conditions like retinal artery macroaneurysm (RAM) or wet age-related macular degeneration (AMD).
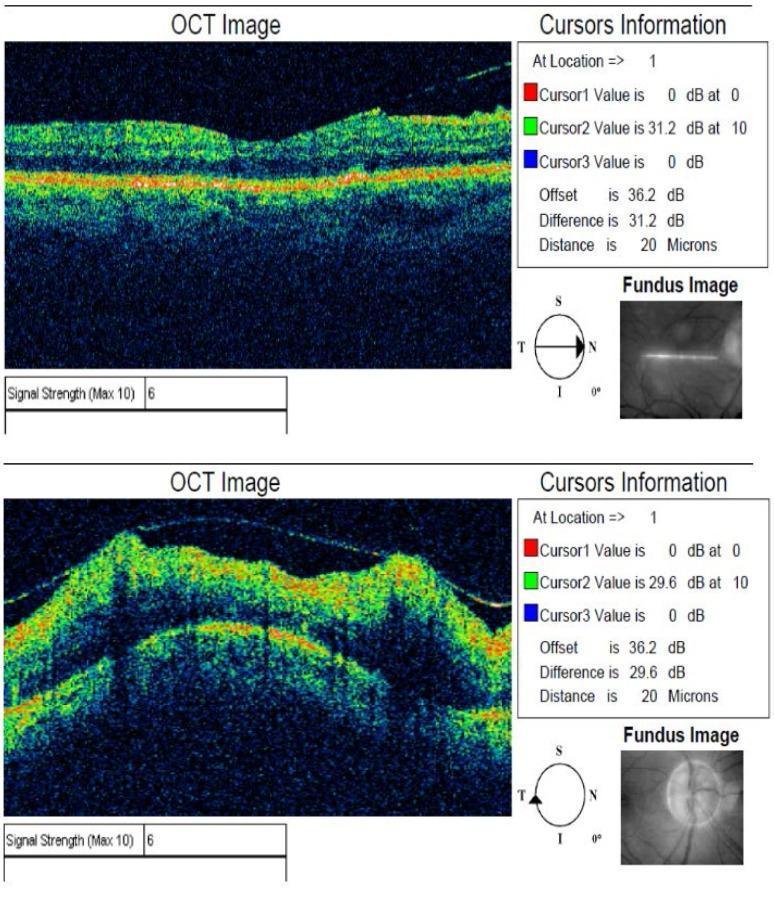
Two high-resolution Optical Coherence Tomography (OCT) cross-sectional images of the retina from a right eye (OD). The top panel displays a relatively normal macular profile with distinct hyperreflective bands representing the Retinal Pigment Epithelium (RPE) and Bruch's membrane, and lower reflectivity in the inner retinal layers. The bottom panel demonstrates significant pathological alterations, including a highly irregular and elevated retinal surface consistent with macular edema or tractional changes. Each OCT scan is accompanied by 'Cursors Information' quantifying signal intensity (dB) and distances (20 microns), and a small 'Fundus Image' showing the scan orientation—a horizontal line through the macula in the first and a circular scan around the optic disc in the second. Both scans report a Signal Strength of 6/10. These images illustrate diagnostic imaging used in ophthalmology for monitoring retinal diseases, comparing baseline structural integrity against active pathology such as macular distortion or thickening.
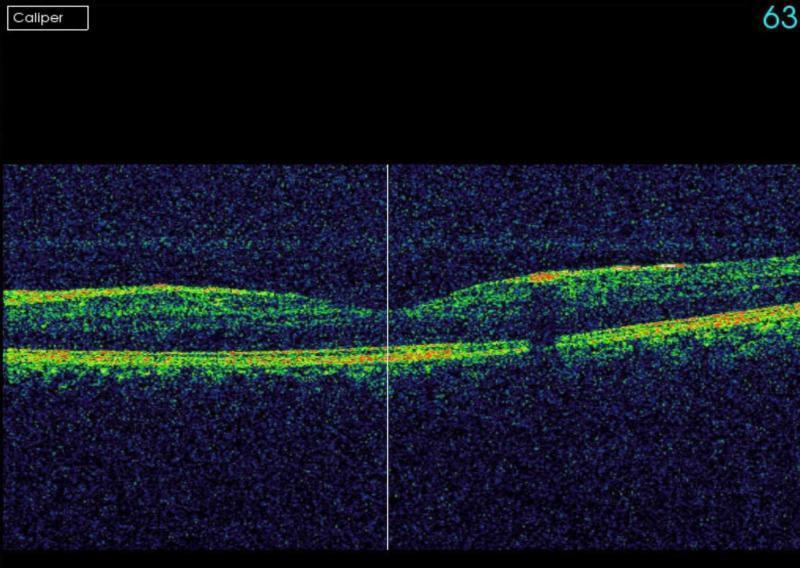
This diagnostic image is an Optical Coherence Tomography (OCT) cross-sectional scan of the human retina, specifically of the macula in the left eye. The scan demonstrates normal retinal architecture with clearly defined, continuous anatomical layers. Key visible features include a distinct, hyperreflective band representing the inner limiting membrane (ILM) and a parallel, highly hyperreflective layer corresponding to the retinal pigment epithelium (RPE) and Bruch's membrane complex. Between these layers, the neurosensory retinal layers exhibit expected variations in reflectivity and thickness. There is no evidence of intraretinal edema, subretinal fluid, retinal thickening, or structural disruptions such as drusen or membrane detachments. The foveal contour appears unremarkable, confirming a normal physiological state in this clinical view. This image serves as a reference for healthy retinal morphology in ophthalmology and optometry education.
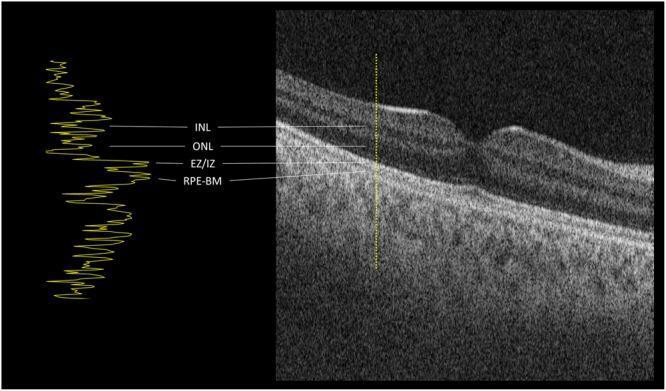
This diagnostic image features a cross-sectional Optical Coherence Tomography (OCT) brightness scan (B-scan) of a normal human macula, paired with an amplitude-scan (A-scan) reflectivity profile. The B-scan illustrates the characteristic anatomical layers of the retina, including the distinct foveal depression. Key labeled structures include the inner nuclear layer (INL), the hypo-reflective outer nuclear layer (ONL), the hyper-reflective ellipsoid zone/interdigitation zone (EZ/IZ), and the highly reflective retinal pigment epithelium-Bruch's membrane complex (RPE-BM). To the left, a corresponding A-scan reflectivity graph plots signal intensity against depth, indicated by a vertical dotted line on the B-scan. The graph's peaks (high reflectivity) and valleys (low reflectivity) correlate precisely with the laminar transitions and internal density of the retinal layers. This visual serves as an educational reference for normal ocular anatomy and the interpretation of OCT signal profiles in ophthalmology, providing a baseline for identifying pathologies like retinal detachment or macular edema.
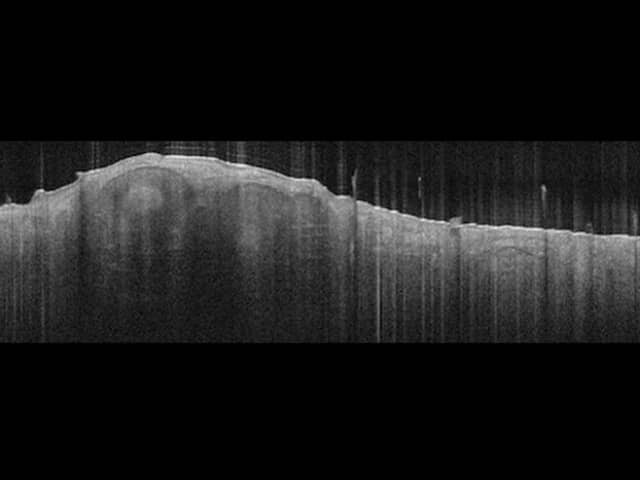
Optical coherence tomography (OCT), spectral-domain, cross-sectional B-scan through the macula. The image depicts the posterior pole retina with a convex, dome-shaped elevation of the neurosensory retina at the foveal/macular region. Retinal layers are present with the inner limiting membrane, nerve fiber layer, outer plexiform/inner nuclear layers, and photoreceptor bands; these strata appear discernible though mildly altered by the contour. The central macula shows mild thickening and a smooth transition between layers, with no prominent subretinal fluid or full-thickness defect evident. Some vertical scan artifacts and speckle noise are visible along the scan lines. Overall, this pattern suggests macular deformation rather than a discrete retinal hole or allows a diagnosis of edema depending on thickness maps. Diagnostic significance centers on objective macular thickness measurement, detection of cystoid spaces, subretinal fluid, or tractional changes at the vitreomacular interface, and monitoring treatment response. Potential clinical use cases include diabetic macular edema, age-related macular degeneration with edema or traction, central serous chorioretinopathy, and evaluation after intraocular surgery. This noninvasive in-vivo retinal imaging enables longitudinal follow-up, correlation with visual acuity, and integration with multimodal imaging such as fluorescein angiography and autofluorescence. Interpretations should be correlated with clinical history and fixed or dynamic visual testing results.
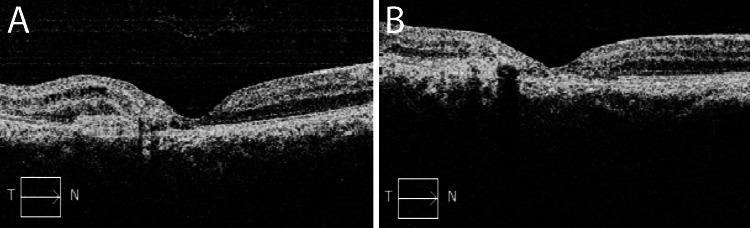
Spectral-domain optical coherence tomography (SD-OCT) cross-sectional images of the retina showing macular progression and treatment response. Image A (baseline) demonstrates a loss of the normal foveal contour with central macular thickening. Key features include intraretinal hyporeflective cystic spaces and subretinal fluid, accompanied by a prominent area of subretinal hyperreflective material (SHRM) suggesting a neovascular membrane. Image B (post-therapy) shows a marked longitudinal improvement after two years. There is a restoration of the foveal depression and a significant reduction in both intraretinal and subretinal fluid. The retinal layers appear more organized and homogeneous, although some residual thinning or architectural changes remain. This comparison illustrates the clinical management of macular telangiectasia type 2 (MT2) complicated by choroidal neovascularization, emphasizing the role of OCT in monitoring exudative changes and therapeutic efficacy of anti-VEGF treatment.
OCT retinal layers diagram ILM NFL GCL IPL INL OPL ONL ellipsoid zone RPE
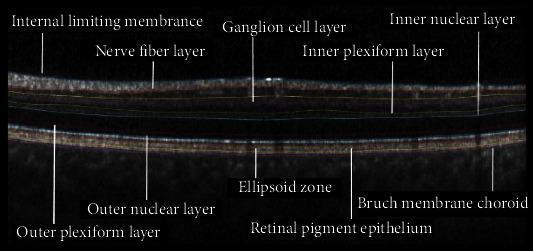
This diagnostic image is an Optical Coherence Tomography (OCT) cross-section of the human retina, illustrating a high-resolution view of the interretinal layers. The image features comprehensive labeling of the retinal anatomy from the inner to the outer layers. Key structures identified include the Internal Limiting Membrane (ILM), Nerve Fiber Layer (NFL), Ganglion Cell Layer (GCL), Inner Plexiform Layer (IPL), and Inner Nuclear Layer (INL) in the inner retina. The outer retinal structures are clearly delineated, including the Outer Plexiform Layer (OPL), Outer Nuclear Layer (ONL), Ellipsoid Zone (EZ), Retinal Pigment Epithelium (RPE), and the Bruch Membrane Choroid complex. The EZ and RPE appear as distinct hyperreflective (bright) bands, while layers like the ONL appear hyporeflective (dark). This clinical imaging modality is essential in ophthalmology for diagnosing and monitoring conditions such as Multiple Sclerosis (MS)-related optic neuritis, macular degeneration, and diabetic retinopathy by assessing layer thickness and integrity.
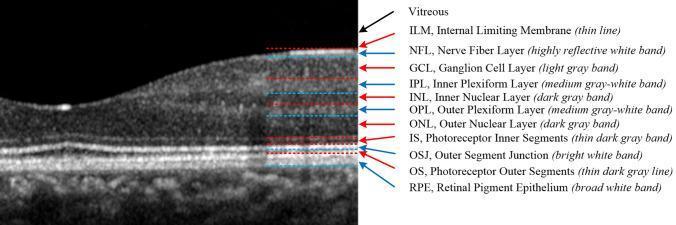
This diagnostic image is a cross-sectional optical coherence tomography (OCT) scan of a healthy human retina centered at the macula. The image provides a high-resolution visualization of the retinal microarchitecture, organized into eleven distinct anatomical layers. From the vitreous interface (top) to the choroid (bottom), the layers are labeled with their full names, abbreviations, and characteristic optical properties (reflectivity). The internal limiting membrane (ILM) and nerve fiber layer (NFL) appear highly reflective, followed by alternating bands of varying gray-white and dark-gray intensities representing the ganglion cell layer (GCL), inner/outer plexiform layers (IPL, OPL), and inner/outer nuclear layers (INL, ONL). The photoreceptor components, including inner segments (IS), outer segment junction (OSJ), and outer segments (OS), are clearly demarcated above the broad, hyper-reflective band of the retinal pigment epithelium (RPE). Red and blue arrows indicate signal intensity transitions: red for dark-to-bright boundaries (e.g., ILM, o-GCL) and blue for bright-to-dark boundaries (e.g., o-NFL, o-IPL). This pedagogical diagram is essential for teaching retinal anatomy and the interpretation of ophthalmic imaging in clinical diagnostics.
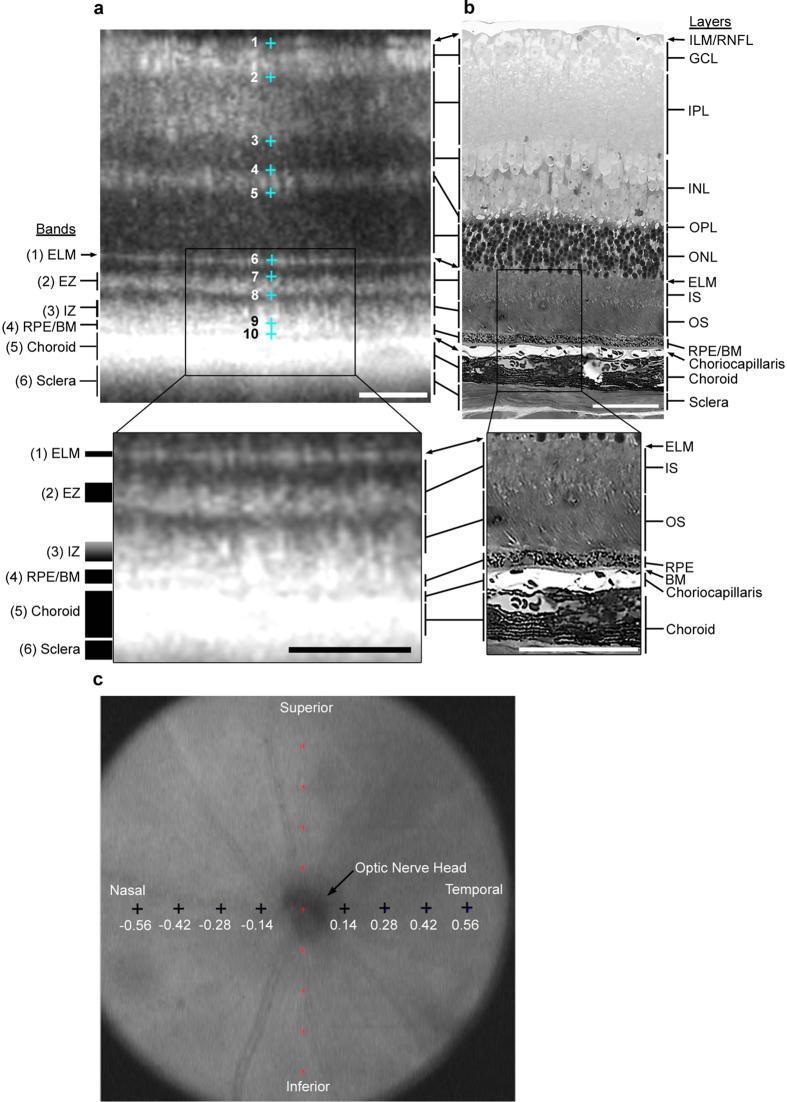
This medical educational composite illustrates the correlation between Spectral-Domain Optical Coherence Tomography (OCT) and light histology of the retina, specifically within a wild-type murine model. Panel A presents a B-scan OCT image with numbered markers indicating retinal layers based on reflectivity: (1-2) hyperreflective ILM/RNFL and GCL; (2-3) moderately hyperreflective IPL; (3-4) hyporeflective INL; (4-5) hyperreflective OPL; and (5-6) hyporeflective ONL. The outer retina is further segmented into six bands: (1) External Limiting Membrane (ELM), (2) Ellipsoid Zone (EZ)/Inner Segments (IS), (3) Interdigitation Zone (IZ)/Outer Segments (OS), (4) Retinal Pigment Epithelium (RPE)/Bruch’s Membrane (BM) complex, (5) Choroid, and (6) Sclera. Panel B shows the corresponding histological cross-section, with arrows and brackets aligning cellular structures to the OCT bands shown in Panel A. Panel C provides a fundus-view en face image showing the optic nerve head and the nasal/temporal eccentricities where measurements were taken. This comparison is essential for validating OCT-based diagnostic nomenclature and quantifying retinal layer thinning in ophthalmic research.
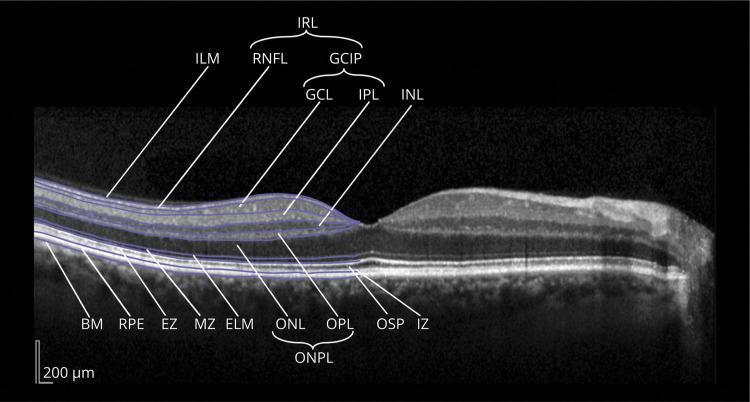
This diagnostic image is a central horizontal spectral-domain optical coherence tomography (SD-OCT) scan of the human retina, specifically centered on the fovea. It serves as a pedagogical tool for consensus nomenclature of retinal layers. The scan displays a cross-sectional view with labeled individual layers from inner to outer: Inner Limiting Membrane (ILM), Retinal Nerve Fiber Layer (RNFL), Ganglion Cell Layer (GCL), Inner Plexiform Layer (IPL), Inner Nuclear Layer (INL), Outer Plexiform Layer (OPL), Outer Nuclear Layer (ONL), External Limiting Membrane (ELM), Myoid Zone (MZ), Ellipsoid Zone (EZ), Outer Segment of Photoreceptors (OSP), Interdigitation Zone (IZ), Retinal Pigment Epithelium (RPE), and Bruch Membrane (BM). Labeled compound layers include the Inner Retinal Layers (IRL), Ganglion Cell and Inner Plexiform layer (GCIP), and Outer Nuclear and Plexiform Layer (ONPL). The foveal depression is clearly visible, showing characteristic thinning of the IRL and GCIP. This visual is intended for ophthalmology and neuro-ophthalmology education to define standard anatomical landmarks and boundaries in retinal imaging.
OCT macular hole epiretinal membrane diabetic macular edema AMD drusen diagnosis