
Epidemological appoeroches
Epidemiology uses several core approaches to study disease patterns, causes, and control in populations. The main ones are:
- Descriptive epidemiology - describes who gets disease (person), where (place), and when (time)
- Analytical epidemiology - tests hypotheses about causes using case-control or cohort studies
- Experimental epidemiology - uses randomized controlled trials or field trials
- Cross-sectional studies - snapshot of disease prevalence at a point in time
- Ecological studies - compares disease rates across populations
Searching sources...
Reading File
Finding Sources
Finding Sources
Finding Sources
Reading File
Reading File
Finding Sources
Park's Textbook of Preventive and Social Medicine is the key source. Let me read it in depth.
Reading File
Reading File
Now let me get the detailed sections on descriptive, analytical, and experimental studies from Park's textbook.
Finding Sources
Finding Sources
Finding Sources
Finding Sources
Reading File
Reading File
I now have excellent material from both Park's Textbook and Creasy & Resnik's. Let me fetch the study design classification image that appeared and compile the full answer.
Loading Image
Reading File
I now have comprehensive information. Let me compile the full structured answer.
Epidemiological Approaches
Epidemiology has three main classes of study approaches, as defined by the International Epidemiological Association (IEA): descriptive studies, analytical studies, and experimental (intervention) studies. Each serves a distinct purpose in understanding disease in populations.
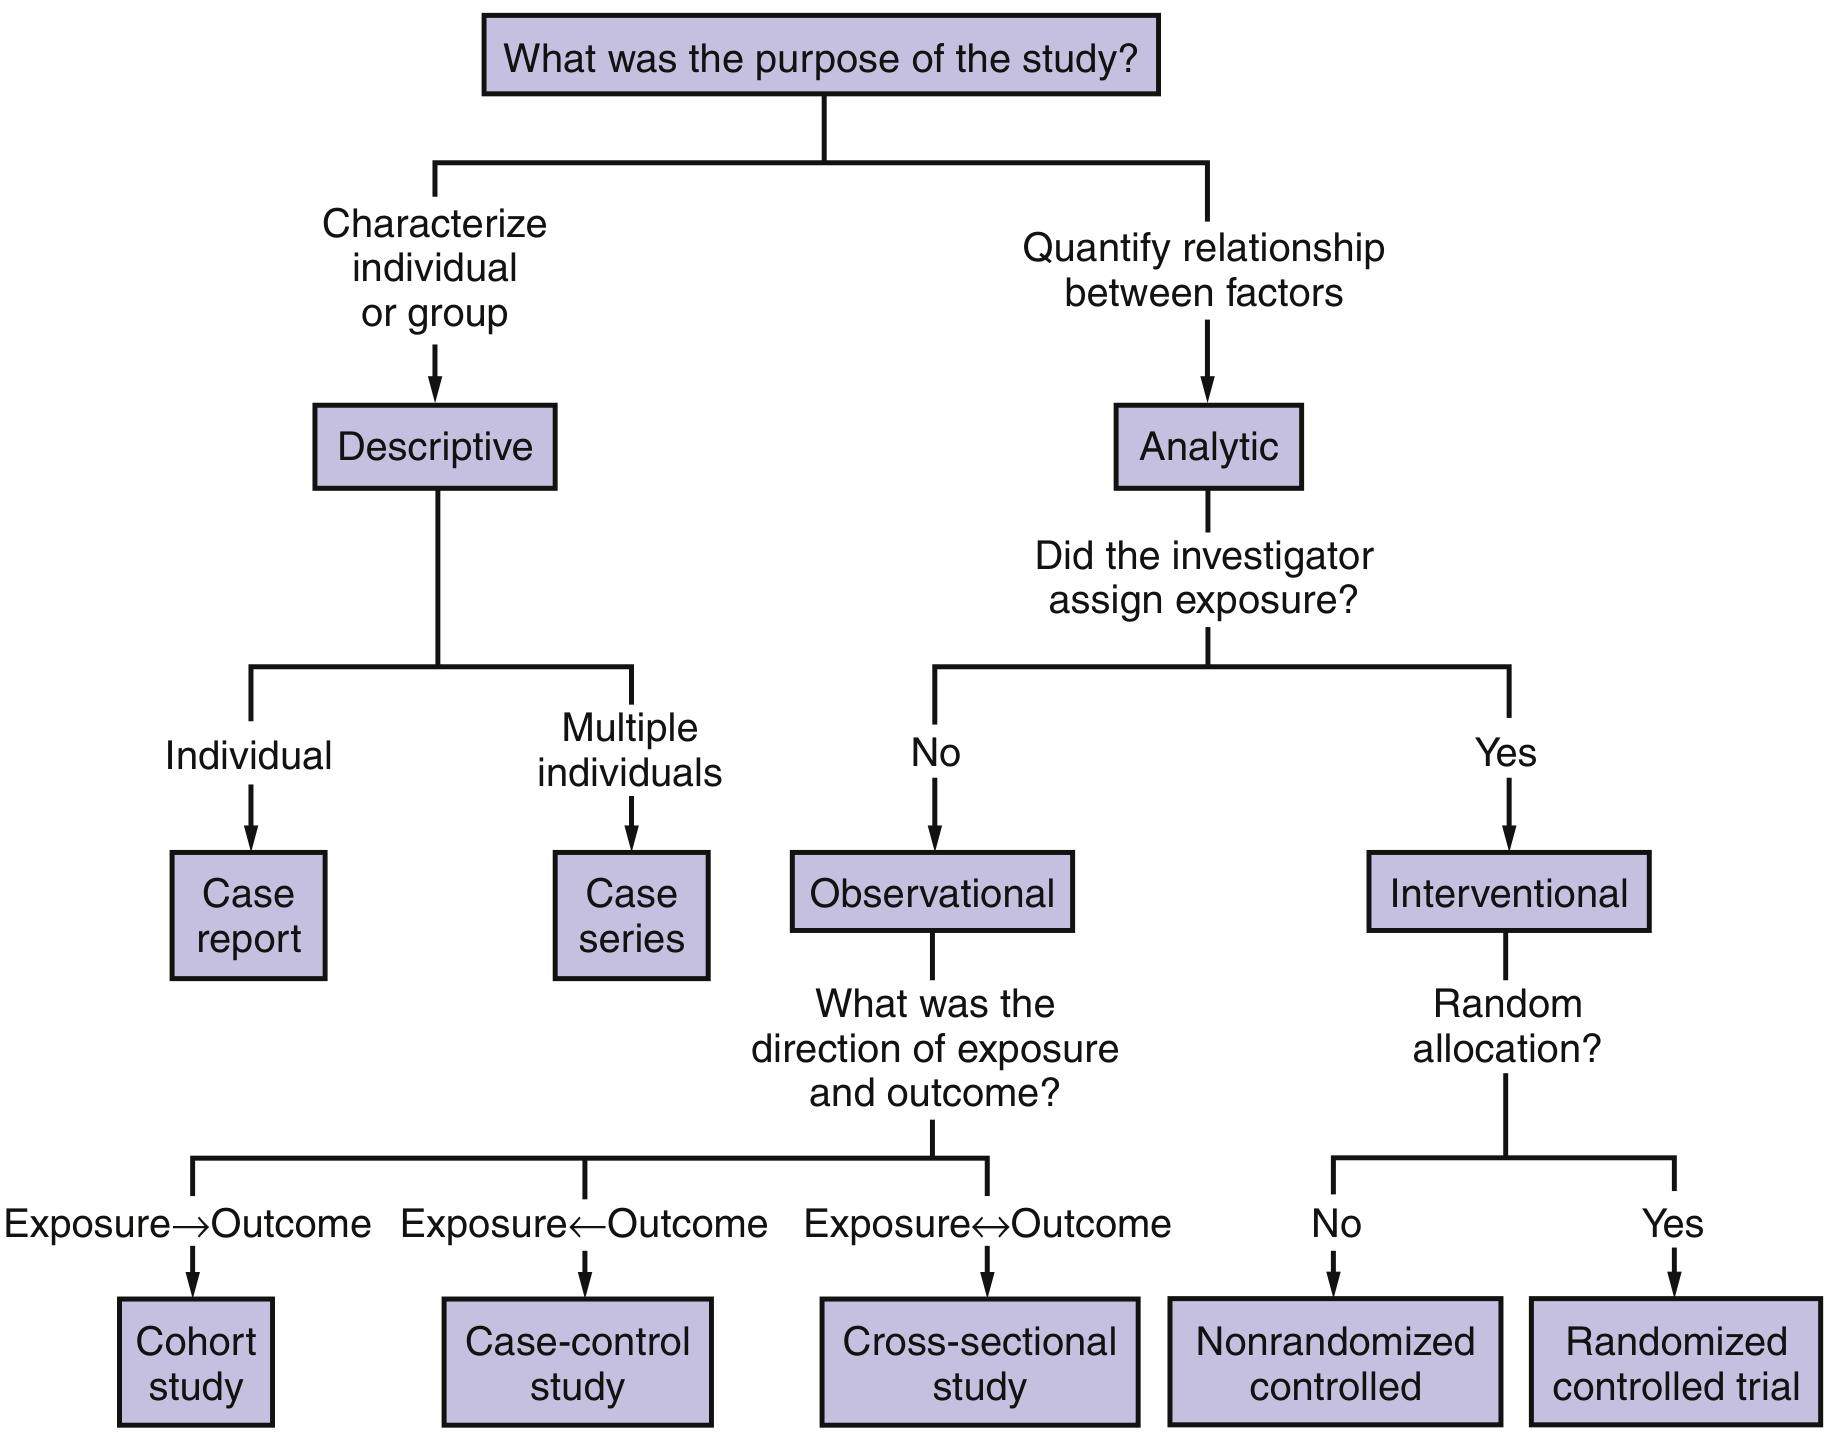
1. Descriptive Epidemiology
Descriptive epidemiology studies the distribution and magnitude of disease in populations by characterizing it in terms of:
- Person - who gets the disease (age, sex, occupation, socioeconomic status)
- Place - where the disease occurs (geographic distribution)
- Time - when the disease occurs (secular trends, seasonal patterns)
Descriptive studies include case reports (a single case) and case series (multiple cases). There is no comparison group, so they cannot establish causality. Their primary value is hypothesis generation. A classic example: the initial cluster reports of pneumonia of unknown cause in Wuhan in late December 2019 eventually led to the identification of COVID-19.
The outcome of descriptive epidemiology is the formulation of an aetiological hypothesis, which is then tested by analytical methods.
2. Analytical Epidemiology
Analytical studies involve two or more comparison groups and quantify the relationship between exposures and outcomes. They test aetiological hypotheses. They may be observational or interventional.
A. Observational Studies (no investigator-assigned exposure)
i. Ecological Studies
- Compare disease frequencies and exposure data across different geographical regions or populations as a whole (not individuals)
- Relatively inexpensive; useful for generating hypotheses
- Subject to the ecological fallacy (group-level associations may not hold at the individual level)
- Cannot establish causality
ii. Cross-Sectional Studies (Prevalence Studies)
- A snapshot - measures both exposure and outcome simultaneously in a defined population at a single point in time
- Direction of exposure and outcome is simultaneous (Exposure ↔ Outcome)
- Can estimate disease prevalence
- Cannot determine temporal sequence (which came first - exposure or disease?)
- Useful for planning health services
iii. Case-Control Studies
- Subjects are selected based on disease status (cases = disease present; controls = disease absent)
- Looks backwards to find past exposures (Exposure ← Outcome; retrospective)
- Calculates Odds Ratio (OR) as the measure of association
- Advantages: fast, inexpensive, good for rare diseases, can study multiple exposures simultaneously
- Disadvantages: cannot calculate incidence rates, prone to recall bias and selection bias
iv. Cohort Studies (Follow-up / Longitudinal Studies)
- Subjects are selected based on exposure status (exposed vs. unexposed) and followed over time for the outcome
- Direction: Exposure → Outcome
- Can be prospective (follow forward in time from exposure) or retrospective (identify exposed group after outcome has occurred using records)
- Calculates Relative Risk (RR) / Incidence Rate
- Advantages: can directly calculate incidence, good for rare exposures, less prone to bias (especially prospective), can study multiple outcomes
- Disadvantages: expensive, time-consuming (for prospective), subject to loss to follow-up
Key comparison - Case-Control vs. Cohort:
| Feature | Case-Control | Cohort |
|---|---|---|
| Selection basis | Disease | Exposure |
| Direction | Retrospective | Prospective or Retrospective |
| Measure | Odds Ratio | Relative Risk |
| Good for | Rare diseases | Rare exposures / common diseases |
| Speed | Quick | Long follow-up |
| Cost | Low | High (prospective) |
| Incidence data | No | Yes |
| Bias susceptibility | High | Lower |
Source: Creasy & Resnik's Maternal-Fetal Medicine
3. Experimental (Intervention) Epidemiology
The investigator assigns the exposure and compares outcomes. This is the highest level of evidence.
A. Randomized Controlled Trial (RCT) - Gold Standard
- Eligible participants are randomly allocated to receive different interventions
- Randomization minimizes confounding and bias
- Can be double-blind (neither participant nor investigator knows the allocation)
- Provides the strongest evidence for causality
- Example: the WHO clofibrate trial for primary prevention of coronary heart disease (involving >15,000 men across Edinburgh, Prague, and Budapest)
B. Non-Randomized (Quasi-Experimental) Trials
- Participants assigned to groups without randomization
- More prone to confounding than RCTs
Types of Experimental Studies in Epidemiology:
- Preventive trials - test whether a preventive measure reduces disease incidence (e.g., vaccine trials)
- Risk factor trials - investigator intervenes to modify a known risk factor (e.g., lowering blood cholesterol in CHD prevention)
- Can be single-factor (e.g., smoking cessation only) or multi-factor (e.g., MRFIT in the USA - addressing cholesterol, smoking, and hypertension together)
- Cessation experiments - evaluate removal of a suspected causal agent. If disease falls after removal, causal hypothesis is strengthened. Example: cigarette smoking cessation and lung cancer
- Trial of aetiological agents - directly test whether a suspected cause produces disease. Classic example: the retrolental fibroplasia (RLF) trial confirming high oxygen therapy caused blindness in premature neonates
4. Other Key Approaches
Systematic Reviews and Meta-Analyses
- Sit at the top of the evidence hierarchy
- Systematically identify, appraise, and synthesize results from multiple primary studies
- Meta-analysis statistically pools data from several studies for a more precise estimate
Biomarker-Based Studies
- Use biological markers (blood levels, genetic markers) to link exposures to health outcomes
- Supplement traditional epidemiological approaches in environmental and molecular epidemiology
Hierarchy of Evidence
Systematic Reviews / Meta-Analyses  (highest)
         ↓
Randomized Controlled Trials
         ↓
Cohort Studies
         ↓
Case-Control Studies
         ↓
Cross-Sectional Studies
         ↓
Ecological Studies
         ↓
Case Series / Case Reports          (lowest)
Ultimate Aim
Per the IEA and Park's Textbook of Preventive and Social Medicine, the three aims of epidemiology are:
- Describe the distribution and magnitude of health problems in populations
- Identify aetiological (risk) factors in the pathogenesis of disease
- Provide data for planning, implementing, and evaluating prevention and treatment services
The ultimate aim is to eliminate or reduce the health problem and promote the health and well-being of society.
Sources: Park's Textbook of Preventive and Social Medicine; Creasy & Resnik's Maternal-Fetal Medicine; Miller's Anesthesia, 10e; Goodman & Gilman's Pharmacological Basis of Therapeutics
Investigation lfbepidemology
The investigation of an epidemic (outbreak investigation) follows a systematic stepwise approach. Key steps include: confirming the diagnosis, establishing case definitions, counting cases, describing the outbreak by person/place/time, forming hypotheses, testing hypotheses, and implementing control measures.
Searching sources...
Finding Sources
Finding Sources
Reading File
Reading File
Reading File
The truncated read earlier at offset 4387 already had a lot of content cut. The key data was included up to where it was cut. Let me get the missing middle steps (steps 4 onwards).
Reading File
Reading File
Reading File
I now have the complete content. Let me also check if there was a step on "case definition" that I may have missed between steps 3 and 4, and retrieve the control measures step.
Reading File
I now have all the steps. Let me compile the comprehensive answer on Investigation of an Epidemic.
Investigation of an Epidemic (Epidemic Investigation)
The occurrence of an epidemic always signals a significant shift in the balance between the agent, host, and environment. It calls for a prompt and thorough investigation to uncover the responsible factors and guide control measures to prevent further spread.
Source: Park's Textbook of Preventive and Social Medicine
Objectives of Epidemic Investigation
According to Park, an epidemic investigation aims to:
- Define the magnitude of the epidemic in terms of time, place, and person
- Determine the conditions and factors responsible for the occurrence
- Identify the cause, source(s) of infection, and modes of transmission to determine control measures
- Make recommendations to prevent recurrence
Steps in Investigation of an Epidemic
Note: Some steps can be done concurrently. No single rigid "cook-book" approach applies to all situations.
Step 1 - Verification of Diagnosis
- The first and most important step
- Reports may sometimes be spurious, arising from misinterpretation of signs and symptoms by the lay public
- A clinical examination of a sample of cases usually suffices (not necessary to examine all)
- Laboratory investigations wherever applicable are most useful to confirm diagnosis
- Epidemiological investigations should NOT be delayed until laboratory results are available
Step 2 - Confirmation of the Existence of an Epidemic
- Compare disease frequency during the same period of previous years
- An epidemic exists when the observed frequency exceeds the expected frequency based on past experience
- An arbitrary limit of 2 standard errors above endemic occurrence is used to define the epidemic threshold (e.g., for influenza)
- Some epidemics (cholera, food poisoning, hepatitis A) are easily and obviously recognized as common-source outbreaks
- Modern epidemics (e.g., cancer, cardiovascular disease) require careful comparison with historical data
Step 3 - Defining the Population at Risk
(a) Obtaining a map of the area:
- A detailed, current map of the area must be obtained or prepared
- Should show natural landmarks, roads, and locations of all dwelling units
- Area may be divided into segments using natural landmarks as boundaries, with dwelling units designated by number
(b) Counting the population (the denominator):
- A complete census of the population by age and sex should be done via house-to-house visits
- Lay health workers may be employed
- This establishes the population at risk - essential for computing attack rates
- Without an appropriate denominator, attack rates cannot be calculated
Step 4 - Rapid Search for All Cases and Their Characteristics
(a) Medical survey:
- A medical survey is conducted in the defined area to identify all cases, including those who have not sought medical care and those possibly exposed to risk
- Lay health workers may be trained to administer epidemiological questionnaires
(b) Epidemiological case sheet (case interview form):
- Should be carefully designed based on findings of a rapid preliminary inquiry
- Collects: name, age, sex, occupation, social class, travel history, previous exposure, time of onset, signs and symptoms, personal contacts, foods eaten, exposure to common vehicles (water, food, milk), history of injections/blood products, attendance at large gatherings, etc.
- For food-borne outbreaks: detailed food histories are essential
- If the outbreak is large (e.g., influenza), a random sample may be examined instead of all cases
(c) Searching for more (secondary) cases:
- Ask patients if they know of other cases at home, school, workplace, neighborhood
- Look for cases admitted to local hospitals
- This may reveal person-to-person spread
- Search for new cases continues daily until the area is declared free of epidemic - typically for a period equal to twice the incubation period since the last case
Step 5 - Data Analysis
Data is analyzed on an ongoing basis using the classical epidemiological parameters - time, place, and person (or the Agent-Host-Environment model if the agent is known).
(a) Time - Epidemic Curve:
- Prepare a chronological distribution of dates of onset and construct an epidemic curve
- The epidemic curve suggests:
- A time relationship with exposure to a suspected source
- Whether it is a common-source or propagated (person-to-person) epidemic
- Whether it is a seasonal or cyclic pattern suggestive of a particular infection
- A sharp, explosive single-peaked curve with a short incubation period = common source
- A prolonged curve with multiple peaks = propagated/person-to-person spread
(b) Place - Spot Map:
- Prepare a spot map (geographic distribution of cases)
- Map their relation to possible sources of infection: water supply, air pollution, foods eaten, occupation
- Clustering of cases indicates a common source
- Classic example: John Snow's spot map during the 1854 cholera outbreak in London's Golden Square district, implicating the Broad Street water pump
(c) Person:
- Analyze data by age, sex, occupation, and other possible risk factors
- Determine attack rates and case fatality rates for those exposed vs. those not exposed
- In food-borne outbreaks: calculate food-specific attack rates for each food item eaten to identify the source
Step 6 - Formulation of Hypotheses
Based on time-place-person distribution (or Agent-Host-Environment model), formulate hypotheses to explain the epidemic in terms of:
- (a) Possible source
- (b) Causative agent
- (c) Possible modes of spread
- (d) Environmental factors that enabled the epidemic
Hypotheses should be ranked by relative likelihood. A tentative hypothesis then guides further investigation.
Step 7 - Testing of Hypotheses
- All reasonable hypotheses are considered and weighed
- Compare attack rates in various groups for those exposed vs. not exposed to each suspected factor
- Determine which hypothesis is consistent with all known facts
- This may involve analytical study designs (case-control, cohort) applied within the outbreak investigation
Step 8 - Evaluation of Ecological Factors
Investigate the environmental circumstances that made the epidemic possible:
- Sanitary status of eating establishments
- Water and milk supply; breakdown in the water supply system
- Movements of human populations
- Atmospheric changes: temperature, humidity, air pollution
- Population dynamics of insects and animal reservoirs
The outbreak can be studied in a case-control fashion to relate the disease to environmental factors, identify source(s) of infection, reservoirs, and modes of transmission.
Step 9 - Further Investigation of Population at Risk
A study (or sample study) of the population at risk may be needed for additional information:
- Medical examination, screening tests
- Examination of suspected food, faeces, or blood samples
- Biochemical studies, assessment of immunity status
- Serological studies may reveal clinically inapparent (subclinical) cases and illuminate pathogenesis
- Healthy individuals from the same population are studied in a case-control fashion to classify all members by:
- (a) Exposure to specific potential vehicles
- (b) Whether ill or not
Step 10 - Writing the Report
The final epidemic report should be complete and convincing and include:
| Section | Contents |
|---|---|
| Background | Geography, climate, demographics, health services, surveillance systems, normal disease prevalence |
| Historical data | Previous epidemics of same disease locally or elsewhere; first cases of current outbreak |
| Methodology | Case definition, questionnaire, survey teams (household, retrospective, prospective surveillance), laboratory techniques |
| Data analysis | Clinical data, epidemiological data (time/place/person), modes of transmission, lab data (agent isolation, serology), interpretation and hypothesis testing |
| Control measures | Strategies, implementation, constraints, results, evaluation (cost-effectiveness), preventive measures |
Control Measures
Control measures may need to be implemented at the commencement of an epidemic based on known facts. These are modified in light of new knowledge from ongoing investigation. Control is directed at:
- Eliminating or reducing the source of infection (e.g., closing the contaminated water pump)
- Interrupting transmission (e.g., sanitation, vector control)
- Protecting susceptibles (e.g., vaccination, chemoprophylaxis)
Summary - The 10 Steps at a Glance
1.  Verify the diagnosis
2.  Confirm existence of an epidemic
3.  Define population at risk (map + census)
4.  Rapid case search + data collection
5.  Data analysis - time (epidemic curve), place (spot map), person (attack rates)
6.  Formulate hypotheses
7.  Test hypotheses (compare attack rates, case-control analysis)
8.  Evaluate ecological / environmental factors
9.  Further investigation of population at risk
10. Write the report + implement and evaluate control measures
Source: Park's Textbook of Preventive and Social Medicine
Waterpurification
Water purification involves removing physical, chemical, and biological impurities from water to make it safe for drinking. Key steps include sedimentation, filtration, and disinfection (mainly chlorination). Other methods include boiling, UV irradiation, and chemical coagulation.
Searching sources...
Finding Sources
Finding Sources
Finding Sources
Finding Sources
Finding Sources
Park's Textbook has an extensive water section. Let me read the relevant blocks.
Finding Sources
Found it - "PURIFICATION OF WATER" at line 3194. Let me read a large block from there.
Reading File
Reading File
Reading File
Reading File
I also need the slow sand filter details and chlorination specifics from the earlier section that was truncated. Let me read it.
Reading File
Reading File
Reading File
Reading File
Reading File
I now have comprehensive data on water purification. Let me also get the coagulation step that precedes rapid filtration.
Reading File
I now have all the key content. Let me compile the comprehensive answer.
Water Purification
Water purification is the process of removing physical, chemical, and biological impurities from water to make it safe, wholesome, and aesthetically acceptable for drinking and other uses.
It is considered under two broad headings:
- Large-scale (municipal/community) purification
- Small-scale (household/individual) purification
Source: Park's Textbook of Preventive and Social Medicine
Sources of Water (and Treatment Needed)
| Source | Characteristics | Treatment Required |
|---|---|---|
| Ground water (wells, springs) | Generally clean, clear | Disinfection only |
| Surface water (rivers, lakes) | Turbid, polluted | Full treatment (storage + filtration + disinfection) |
| Sea water | Saline | Desalination (reverse osmosis) |
Part 1: Large-Scale Purification of Water
A typical water purification system comprises three main steps:
I. Storage
Water is drawn from the source and impounded in natural or artificial reservoirs. Storage provides a reserve of water from which further pollution is excluded. During storage, natural purification occurs in three ways:
(a) Physical:
- About 90% of suspended impurities settle by gravity within 24 hours (plain sedimentation)
- Water becomes clearer, allowing light penetration
- Reduces the load on filters
(b) Chemical:
- Aerobic bacteria oxidize organic matter using dissolved oxygen
- Free ammonia content decreases; nitrates rise
(c) Biological:
- A tremendous drop in bacterial count occurs - total bacterial count of river water drops by up to 90% in the first 5-7 days
- Pathogenic organisms gradually die out
Optimum storage period for river water: 10-14 days. Longer storage risks development of algal growth (imparting bad smell and colour).
II. Filtration
Filtration is the second stage and removes 98-99% of bacteria along with other impurities. Two types of filters are used:
A. Slow Sand Filter (Biological / Schmutzdecke Filter)
First used in 1804 in Scotland - considered the standard method of water purification.
Elements of a Slow Sand Filter:
| Layer | Depth |
|---|---|
| Supernatant (raw) water | 1.0 - 1.5 m |
| Sand bed | 1.2 m (sand grain size: 0.2-0.3 mm) |
| Gravel support | 0.30 m |
| Filter bottom (under-drainage) | 0.16 m |
Key feature - the Vital Layer (Schmutzdecke):
- A slimy, gelatinous biological layer that forms on the surface of the sand bed
- Consists of threadlike algae, plankton, diatoms, and bacteria
- Called "the heart of the slow sand filter"
- Functions: removes organic matter, holds back bacteria, oxidizes ammoniacal nitrogen to nitrates
- Takes several days to fully form ("ripening" of the filter) - the first filtrate is run to waste
Purification mechanisms in the sand bed: mechanical straining, sedimentation, adsorption, oxidation, and biological action
Rate of filtration: 0.4 m³/hour per m² of sand bed surface (very slow)
Cleaning: By scraping the top layer of the sand bed
B. Rapid Sand Filter (Mechanical Filter)
Preceded by chemical coagulation and sedimentation (required because the filter cannot handle highly turbid raw water directly).
Chemical coagulation - added before rapid filtration:
- Alum (aluminium sulphate) is commonly added to raw water
- Forms a gelatinous floc (Al(OH)₃) that traps colloidal and suspended particles
- The floc settles in a sedimentation tank before water enters the rapid filter
Sand grain size: 0.4-0.7 mm (coarser than slow filter)
Rate of filtration: 200 m.g.a.d. (40-50 times faster than slow sand filter)
Cleaning: By backwashing - reversing the flow of water through the sand bed to dislodge impurities; takes about 15 minutes; frequency: daily or weekly
Comparison: Slow Sand vs. Rapid Sand Filter
| Feature | Rapid Sand Filter | Slow Sand Filter |
|---|---|---|
| Space | Occupies very little space | Occupies large area |
| Rate of filtration | 200 m.g.a.d | 2-3 m.g.a.d |
| Sand size | 0.4-0.7 mm | 0.2-0.3 mm |
| Preliminary treatment | Chemical coagulation + sedimentation | Plain sedimentation |
| Washing method | Backwashing | Scraping of sand |
| Skill required | Highly skilled | Less skilled |
| Bacteria removal | 98-99% | 99.9-99.99% |
| Colour removal | Good | Fair |
III. Disinfection (Chlorination)
Requirements for a good water disinfectant:
- Must destroy pathogens within the contact time available
- Must not leave toxic reaction products
- Must be available readily at reasonable cost
- Must leave a residual concentration to protect against re-contamination
- Must be easily detectable by simple tests
In water works practice, "disinfection" is synonymous with "chlorination".
Chlorination
Chlorination is described as "one of the greatest advances in water purification." It is a supplement, not a substitute to sand filtration.
Actions of chlorine:
- Kills pathogenic bacteria
- No effect on spores and certain viruses (e.g., polio, viral hepatitis) except in high doses
- Oxidizes iron, manganese, hydrogen sulphide
- Destroys some taste and odour-producing substances
- Controls algae and slime organisms
- Aids coagulation
Chemistry of chlorination:
H₂O + Cl₂ → HCl + HOCl   (hypochlorous acid)
HOCl → H⁺ + OCl⁻         (hypochlorite ions)
- Germicidal action is mainly due to hypochlorous acid (HOCl)
- HOCl is 70-80 times more effective than hypochlorite ions (OCl⁻)
- Chlorine acts best at pH around 7 (predominance of HOCl)
- At pH > 8.5, chlorine becomes unreliable (90% HOCl ionizes to OCl⁻)
Principles of proper chlorination (3 rules):
- Water must be clear and free from turbidity (turbidity impedes chlorination)
- The "chlorine demand" of water must be estimated - the amount of chlorine needed to destroy bacteria and oxidize all organic matter and ammonia. The point at which this demand is met = "break-point" - beyond this, free residual chlorine appears
- Adequate contact period must be allowed; free residual chlorine of 0.5 mg/litre must remain after 1 hour contact to confirm effective disinfection
Forms of chlorine used:
- Gaseous chlorine (in large waterworks)
- Bleaching powder (CaOCl₂) - contains ~33% available chlorine when fresh; unstable on exposure to air/light
- Chlorine solution (5% solution from bleaching powder)
- High Test Hypochlorite (HTH/perchloron) - contains 60-70% available chlorine; more stable
- Chlorine tablets (e.g., halazone) - 0.5 g tablet sufficient for 20 litres of water
Other disinfectants:
- Ozone - powerful oxidizing agent; no residual effect
- UV irradiation - effective but no residual action; used in point-of-use systems
- Iodine - for emergency use only; 2 drops of 2% iodine in 1 litre of clear water; contact time 20-30 minutes; not suitable for municipal supplies
Advanced Membrane Processes
Used for industrial, pharmaceutical, or brackish/sea water treatment:
| Process | Pore Size | Operating Pressure | Removes |
|---|---|---|---|
| Microfiltration | 0.01-12 μm | 1-2 bar | Colloidal and suspended material (>0.05 μm) |
| Ultrafiltration | 0.002-0.03 μm | <5 bar | Organics >800 daltons |
| Nanofiltration | 0.001-0.01 μm | ~5 bar | Divalent ions (Ca²⁺, Mg²⁺), higher MW organics |
| Reverse Osmosis | <0.002 μm | 15-50 bar | Monovalent ions; used for desalination of brackish and sea water |
Part 2: Small-Scale (Household) Purification
(a) Boiling
- Most reliable household method
- Water must be brought to a "rolling boil" for 10-20 minutes
- Kills all bacteria, spores, cysts, and ova - yields sterilized water
- Also removes temporary hardness (drives off CO₂, precipitates CaCO₃)
- Disadvantage: no residual protection against subsequent contamination
- Water should be boiled preferably in the same container used for storage
(b) Chemical Disinfection (Small Scale)
| Agent | Dose | Notes |
|---|---|---|
| Bleaching powder | Per Appendix formula | Ensure free residual Cl 0.5 mg/L after 1 hr |
| Chlorine tablets (halazone) | 1 tablet (0.5 g) per 20 litres | Cost-effective |
| Iodine (2% ethanol solution) | 2 drops per litre of clear water | Contact time 20-30 min; not for prolonged use (thyroid effects) |
Disinfection of wells:
- Calculate the chlorine demand of the well
- Add bleaching powder in calculated dose
- Agitate by moving bucket vigorously
- Allow 1 hour contact period
- Test for free residual chlorine (≥0.5 mg/litre) using orthotolidine arsenite test
- During cholera epidemics, wells are disinfected daily
Double Pot Method (NEERI, Nagpur):
- A device using two nested pots filled with a mixture of bleaching powder + coarse sand
- Lowered into the well at least 1 m below water level
- Provides continuous, constant-dose chlorination for 2-3 weeks in household wells
(c) Filtration (Small Scale)
- Candle filters (Berkefeld, Chamberland type) - household ceramic filters
- Domestic sand filters
WHO Water Quality Standards (Guidelines for Drinking Water Quality, 2011)
| Parameter | WHO Guideline |
|---|---|
| Turbidity | <4 NTU (ideally 0) |
| Colour | ≤15 TCU |
| Odour | Unobjectionable |
| Coliforms (bacteriological) | Zero E. coli per 100 mL |
| Free residual chlorine | 0.5 mg/litre after 1 hour contact |
WHO quality aspects assessed:
- Acceptability (physical) - turbidity, colour, taste, odour
- Microbiological - bacteria, viruses
- Chemical - heavy metals, nitrates, fluoride
- Radiological - radioactive substances
Summary Flow Chart: Municipal Water Purification
Raw Water (River/Surface)
        ↓
    STORAGE (10-14 days)
    [Physical, chemical, biological self-purification; 90% bacteria killed]
        ↓
    COAGULATION + SEDIMENTATION
    [Alum added → floc forms → suspended particles settle]
        ↓
    FILTRATION
    [Slow sand filter (biological layer) OR Rapid sand filter (backwashing)]
    [98-99.99% bacteria removed]
        ↓
    DISINFECTION (CHLORINATION)
    [Free residual Cl: 0.5 mg/L after 1 hr contact]
        ↓
    DISTRIBUTION
    [Safe, potable drinking water]
Source: Park's Textbook of Preventive and Social Medicine
Epidemologgy of non communicable disease
Non-communicable diseases (NCDs) are the leading cause of death globally, responsible for ~74% of all deaths. The major NCDs are cardiovascular diseases, cancers, chronic respiratory diseases, and diabetes. Key risk factors include tobacco use, physical inactivity, unhealthy diet, and harmful alcohol use.
Searching sources...
Finding Sources
Finding Sources
Finding Sources
Finding Sources
Reading File
Finding Sources
That block was about CKD, not the general NCD epidemiology topic. Let me search Park's textbook directly for NCD-related content and also search Harrison's block 54.
Reading File
Finding Sources
Excellent content from Harrison's. Let me now get the Park's textbook NCD-specific sections on coronary heart disease, cancer, diabetes, and also get more of the Harrison's block.
Reading File
Finding Sources
Finding Sources
Reading File
Let me search Park's textbook specifically for chapters on NCDs like CHD, cancer, hypertension, diabetes.
Finding Sources
Finding Sources
I have used my DB quota. I have rich content from Harrison's on NCD epidemiology. Let me also get the cancer and prevention sections from the Harrison's block and compile the comprehensive answer.
Reading File
Reading File
I now have extensive content. Let me compile the full, structured answer on the Epidemiology of Non-Communicable Diseases.
Epidemiology of Non-Communicable Diseases (NCDs)
Definition and Classification
Non-communicable diseases (NCDs) are diseases that are not transmitted from person to person directly. They are of long duration, generally slow in progression, and result from a combination of genetic, physiological, environmental, and behavioural factors.
The Four Major NCDs (WHO Classification):
- Cardiovascular diseases (coronary heart disease, stroke, hypertension)
- Cancers
- Chronic respiratory diseases (COPD, asthma)
- Diabetes mellitus
Other important NCDs include: mental health disorders, chronic kidney disease, obesity, musculoskeletal disorders, and neurological disorders.
Global Burden of NCDs
- 74% of all deaths worldwide (2022) were attributed to NCDs - Harrison's Principles of Internal Medicine (22e, 2025)
- More than three-quarters of NCD deaths occur in low- and middle-income countries (LMICs)
- LMICs account for 85% of all early NCD-related deaths (~17 million people) - exceeding the combined deaths from AIDS, tuberculosis, and malaria
- By 2030, NCDs are projected to cause 52 million deaths annually if no additional action is taken
- Developing countries carry a "double burden" - both communicable and non-communicable diseases simultaneously
The Epidemiologic Transition
The shift from communicable to non-communicable diseases as leading causes of death is called the epidemiologic transition (described by Omran, 1971). It occurs in stages:
| Stage | Characteristics |
|---|---|
| Age of Pestilence and Famine | Communicable diseases dominate; high mortality; low life expectancy (~20-40 years) |
| Age of Receding Pandemics | Improved sanitation; declining communicable disease mortality; life expectancy rises to ~50 years |
| Age of Degenerative and Man-Made Diseases | NCDs (CVD, cancer, diabetes) become dominant; life expectancy >70 years |
| Age of Delayed Degenerative Diseases | NCD mortality shifts to older age groups due to improved treatment |
Most developed countries are in stage 3-4. Most LMICs are in stages 2-3, carrying a double burden.
The Four Shared Behavioural Risk Factors (WHO Framework)
The WHO identifies four key modifiable behavioural risk factors common to the four major NCDs:
| Risk Factor | Linked NCDs |
|---|---|
| Tobacco use | Cancer (lung, bladder, oral), CVD, COPD |
| Harmful use of alcohol | Liver cancer, CVD, diabetes complications |
| Physical inactivity | CVD, type 2 diabetes, cancer, obesity |
| Unhealthy diet (high salt, saturated fat, sugar; low fruit/vegetables) | CVD, diabetes, cancer, obesity |
These four behaviours lead to four intermediate metabolic/physiological risk factors:
- Raised blood pressure (hypertension)
- Overweight/obesity
- Raised blood glucose (hyperglycaemia)
- Raised blood lipids (dyslipidaemia)
The WHO estimates that 80% of cardiovascular disease and type 2 diabetes, and 40% of all cancers, can be prevented through healthier diets, increased physical activity, and avoidance of tobacco. - Harrison's, 22e
1. Cardiovascular Diseases (CVD)
Global Burden
- Leading cause of NCD death worldwide
- Coronary artery disease (CAD) and hypertension in the elderly are the dominant causes of heart failure in high-income countries
- In LMICs, rheumatic heart disease (RHD) is a major contributor - affecting ~40 million people globally, with ~2.8 million new cases/year and >300,000 deaths/year (almost all in developing countries)
- The Framingham Heart Study: prevalence of severe hypertension (>210/120 mmHg) fell from 1.8% in the 1950s to 0.1% by the 1960s following introduction of antihypertensive agents
Major Risk Factors for CVD:
Non-modifiable:
- Age (risk increases with age)
- Male sex (premenopausal women relatively protected)
- Family history / genetic predisposition
- Ethnicity
Modifiable:
- Hypertension (a leading risk factor)
- Dyslipidaemia (elevated LDL-cholesterol)
- Tobacco smoking
- Diabetes mellitus
- Obesity
- Physical inactivity
- Unhealthy diet
- Psychosocial stress
The Framingham Risk Score
A widely used tool to predict the 10-year risk of CVD events based on age, sex, total cholesterol, HDL-cholesterol, systolic BP, treatment status, diabetes, and smoking. It stratified patients into low, intermediate, and high risk categories to guide preventive therapy.
Epidemiology in LMICs
- Hypertension goes largely undetected, untreated, and uncontrolled in sub-Saharan Africa
- Heart failure from non-ischaemic causes (RHD, peripartum cardiomyopathy, endomyocardial fibrosis, HIV cardiomyopathy) accounts for >90% of cardiac failure in Sub-Saharan Africa
- Eastern Europe and Central Asia: collapse of the Soviet Union was followed by a catastrophic surge in CVD deaths (ischaemic heart disease mortality nearly doubled in Russia between 1991 and 1994)
2. Cancers
Global Burden
- ~10 million cancer deaths worldwide in 2020
- Low- and middle-income countries accounted for ~70% of these deaths
- By 2040, annual mortality from cancer is expected to increase to >16 million deaths
Key Risk Factors by Type
| Cancer | Key Risk Factors |
|---|---|
| Lung | Tobacco smoking, indoor air pollution, radon |
| Breast | Western diet, obesity, late childbearing, OCP, HRT, BRCA1/2 mutations |
| Cervical | Human papillomavirus (HPV) infection |
| Liver (HCC) | Hepatitis B and C viruses, alcohol, aflatoxin exposure |
| Gastric | Helicobacter pylori infection, high-salt diet |
| Colon/Rectum | Diet (high fat, low fibre), obesity, alcohol, physical inactivity |
| Oral | Tobacco (smoking and chewing), alcohol, HPV |
Cancer-causing infections (HPV, HBV, H. pylori) are responsible for up to 50% of cancer cases in some Sub-Saharan African countries. - Harrison's, 22e
NCD-Cancer Paradox in LMICs
- Outcomes are far worse in developing countries
- Health systems cannot provide early detection - most patients at time of diagnosis already have incurable disease
- Treatment is available only to a very small, mostly wealthy minority
3. Diabetes Mellitus
Global Burden
- 537 million diabetic adults worldwide in 2022 (~1 in 11 adults) - International Diabetes Federation
- Expected to rise to 783 million by 2045
- 3 in 4 adults with diabetes live in developing countries
- Diabetics in LMICs are often younger, so micro- and macrovascular complications take a far greater toll
- GBD 2017 study: diabetes accounted for 1.6 million deaths in 2019; 84% in LMICs
- High fasting plasma glucose ranks third among risks for disability and global mortality
Risk Factors for Type 2 Diabetes
| Modifiable | Non-modifiable |
|---|---|
| Overweight / obesity | Age |
| Physical inactivity | Family history |
| Unhealthy diet (refined carbohydrates, sugar) | Ethnicity (South Asian, African, Hispanic) |
| Hypertension | Gestational diabetes history |
| Dyslipidaemia | Genetics (polygenic) |
| Tobacco use | - |
Complications of Diabetes (Sources of Mortality and Morbidity)
- Microvascular: Diabetic nephropathy (CKD), retinopathy (blindness), neuropathy
- Macrovascular: Coronary artery disease, stroke, peripheral arterial disease
- Diabetes + hypertension = dramatically accelerated renal failure
4. Chronic Respiratory Diseases
Chronic Obstructive Pulmonary Disease (COPD)
- Tobacco smoking is the most important cause in high-income countries
- Biomass fuel combustion (indoor cooking fires) is a major cause in LMICs
- Occupational dust and chemical exposure, ambient air pollution also contribute
- Characterized by progressive, irreversible airflow limitation
Asthma
- Multifactorial: allergen exposure, air pollution, obesity, reduced childhood infections (hygiene hypothesis)
- Increasing prevalence in urban populations worldwide
5. Mental and Neurological Disorders
- In 2019, 1 in 8 people (~970 million) worldwide lived with a mental health disorder
-
580 million people suffer from depression and anxiety disorders
- >700,000 deaths by suicide every year
- Depressive disorders are the second leading cause of years lost to disability worldwide
- Most LMICs devote <1% of health expenditure to mental health
Prevention of NCDs: WHO Framework
Three Levels of Prevention
| Level | Strategy |
|---|---|
| Primordial | Prevent emergence of risk factors in society (e.g., tobacco control policies, urban planning for physical activity) |
| Primary | Prevent disease in at-risk individuals (e.g., lifestyle counselling, vaccination for HPV/HBV) |
| Secondary | Early detection via screening (e.g., BP checks, mammography, PAP smear, fasting glucose) |
| Tertiary | Reduce complications and disability in established disease (e.g., cardiac rehab, diabetic foot care) |
The WHO "MPOWER" Package (Tobacco Control)
The 2003 WHO Framework Convention on Tobacco Control committed signatories to:
- Monitor tobacco use
- Protect from tobacco smoke
- Offer cessation support
- Warn about dangers of tobacco
- Enforce advertising bans
- Raise taxes on tobacco
The "Best Buys" (WHO Cost-Effective NCD Interventions)
- Tobacco taxation and smoke-free laws
- Alcohol taxation and restriction of advertising
- Salt reduction in food
- Replacement of trans-fats with polyunsaturated fats
- Aspirin therapy for heart attacks
- Multi-drug therapy for high CVD risk
- Vaccination against HPV and HBV (cancer prevention)
Epidemiological Study Approaches Used in NCD Research
| Study Design | Example Use |
|---|---|
| Cohort study | Framingham Heart Study - followed a population for decades to identify CHD risk factors |
| Case-control study | Linking tobacco smoking to lung cancer (Doll & Hill, 1950) |
| Randomized Controlled Trial | MRFIT trial - multiple risk factor intervention for CHD |
| Cross-sectional survey | Estimating prevalence of hypertension, diabetes in a population |
| Ecological study | Correlating salt intake with stroke rates across countries |
Summary Table: The Four Major NCDs
| NCD | Leading Risk Factors | Key Measures |
|---|---|---|
| CVD | Hypertension, smoking, dyslipidaemia, diabetes, obesity | BP control, statins, aspirin, lifestyle |
| Cancer | Tobacco, infections (HPV, HBV, H. pylori), diet, alcohol | Vaccination, screening, tobacco cessation |
| Diabetes | Obesity, physical inactivity, unhealthy diet | Weight loss, exercise, diet, metformin |
| Chronic Respiratory | Tobacco, biomass fuel, air pollution | Smoking cessation, bronchodilators |
Sources: Harrison's Principles of Internal Medicine, 22nd Edition (2025); Park's Textbook of Preventive and Social Medicine
This is a shared conversation. Sign in to Orris to start your own chat.