
ECG medicine from harrison for mbbs university final proff
Reading File
ECG (electrocardiography) is a major topic for MBBS final exams. Let me search Harrison's for comprehensive ECG content right away.
Searching sources...
Finding Sources
Finding Sources
Finding Sources
Finding Sources
The main ECG chapter is in block27 of Harrison's. Let me read the full ECG chapter now.
Reading File
Reading File
I have enough content from the ECG chapter. Let me also fetch the key ECG images to include them visually.
Loading Image
Finding Sources
I have the conduction system image and detailed text. Let me now read the core ECG content more precisely from the block file.
Reading File
I now have more than enough content to give a thorough, exam-focused answer. Let me also fetch the ECG waveforms diagram.
Loading Image
Excellent! I now have everything needed. Here is the full, exam-focused ECG guide from Harrison's Principles of Internal Medicine 22e (2025).
ECG (Electrocardiography) - Harrison's Principles of Internal Medicine 22e
Chapter 247 - Ary L. Goldberger
1. What Is an ECG?
An electrocardiogram (ECG/EKG) is a graphical representation of the electrical activity generated by the heart. Metallic electrodes attached to the extremities and chest wall detect signals that are amplified and recorded by the electrocardiograph. ECG leads display the instantaneous differences in electrical potentials between specific sets of electrodes.
Clinical utility:
- Detection of arrhythmias and conduction disturbances
- Myocardial ischemia/infarction
- Life-threatening metabolic disturbances (e.g., hyperkalemia)
- Drug toxicities (e.g., digoxin, amiodarone)
- Susceptibility to sudden cardiac arrest
2. Electrophysiologic Background - Cardiac Conduction System
Depolarization of the heart initiates cardiac contraction. The ECG records only atrial and ventricular myocardial depolarization and repolarization - NOT the conduction system itself.
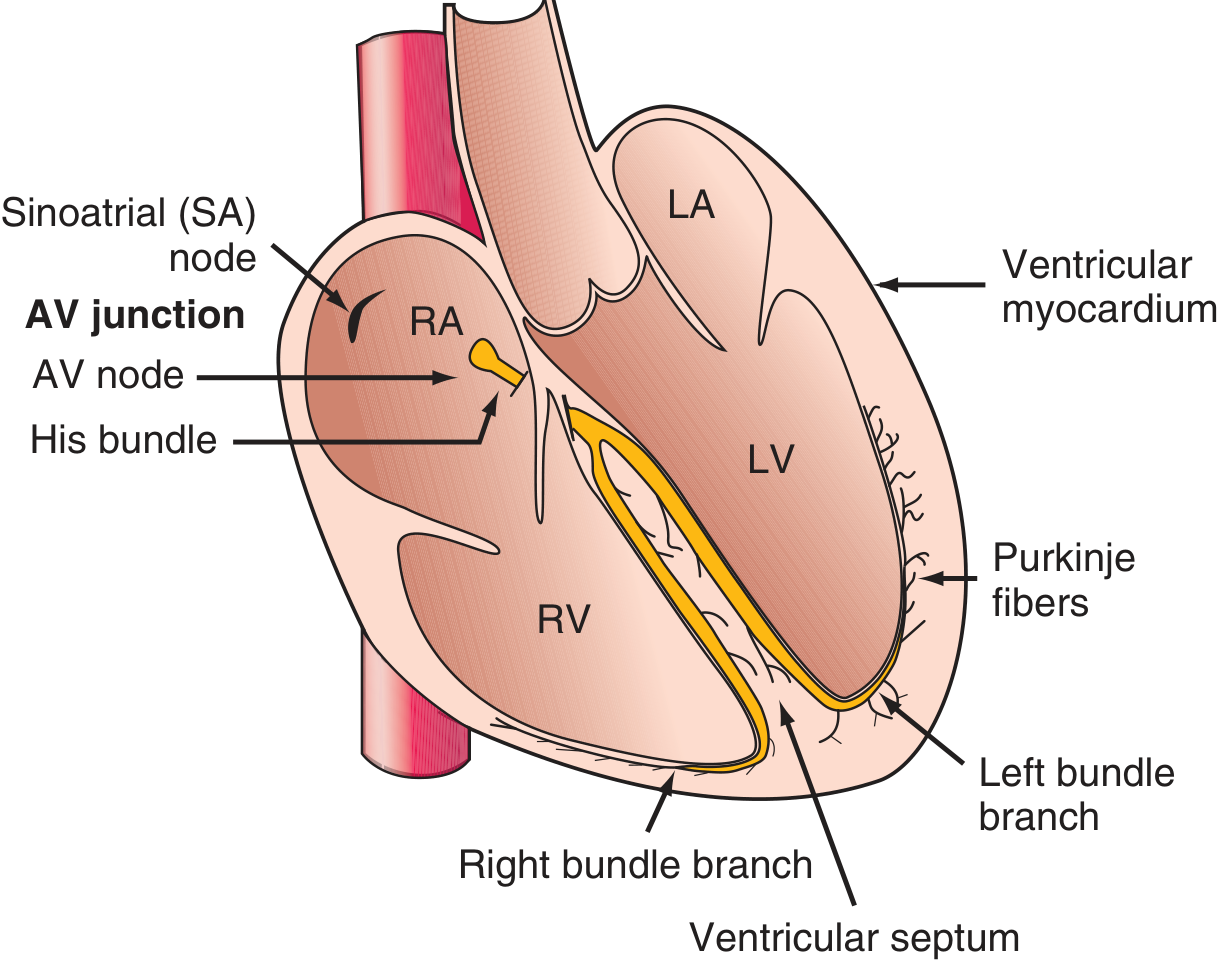
Sequence of normal conduction:
- SA node - pacemaker, spontaneous automaticity
- Depolarization spreads through right and left atria → atrial contraction
- AV node → Bundle of His (together = AV junction) - physiologic delay
- Right and left bundle branches → Purkinje fibers → rapid ventricular depolarization
- Left bundle divides into left anterior and left posterior fascicles
- Depolarization spreads endocardium → epicardium
3. Basic ECG Waveforms and Intervals
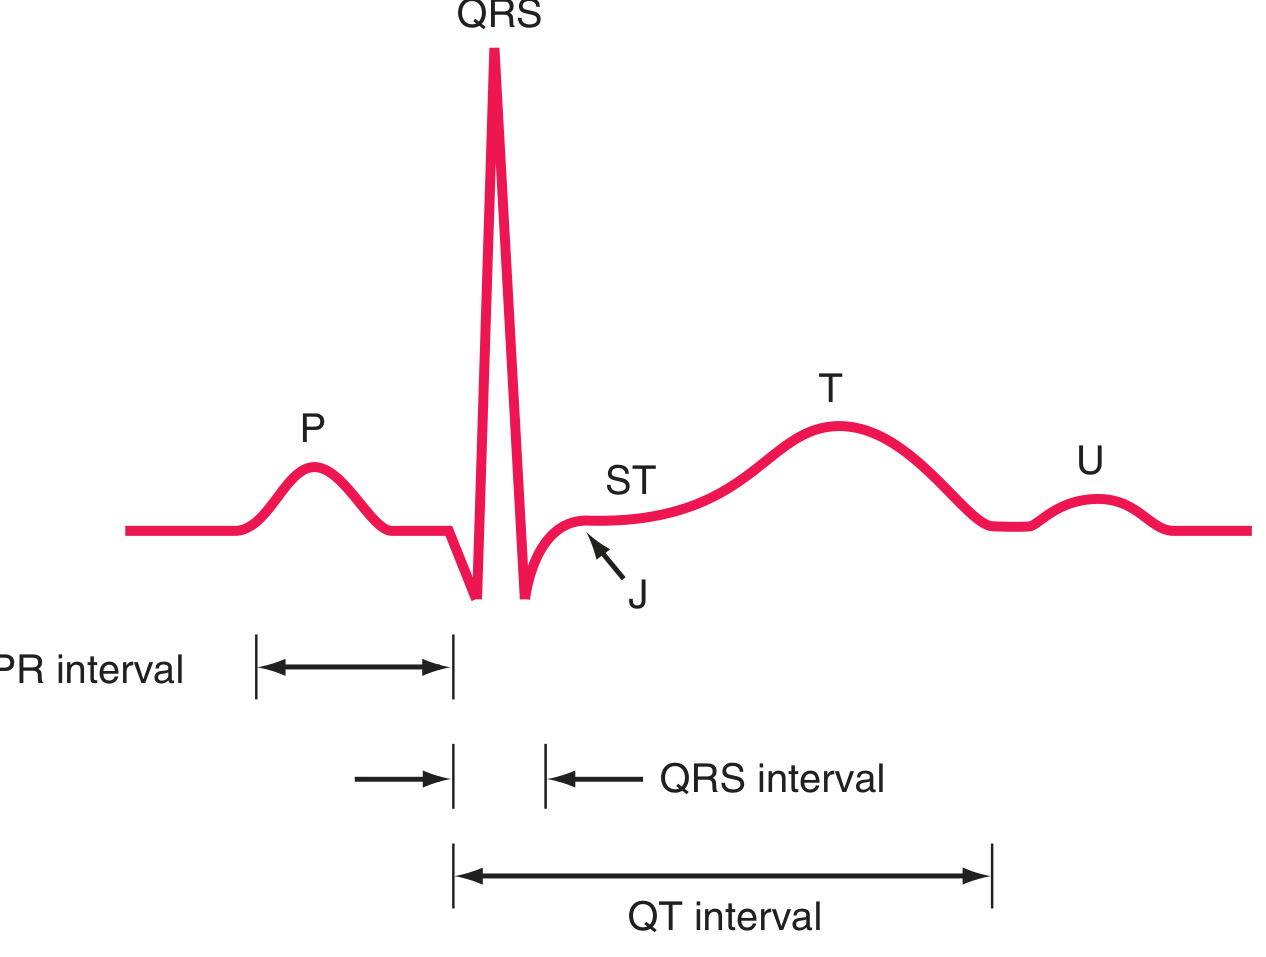
| Wave/Interval | Represents | Normal Value |
|---|---|---|
| P wave | Atrial depolarization | Duration <120 ms, amplitude <2.5 mm |
| PR interval | Atrial to ventricular conduction (AV delay) | 120-200 ms |
| QRS complex | Ventricular depolarization | ≤100-110 ms |
| J point | Junction of QRS end and ST segment start | - |
| ST segment | Ventricular plateau (phase 2 of AP) | Isoelectric normally |
| T wave | Ventricular repolarization (phase 3 of AP) | - |
| U wave | Possibly repolarization of Purkinje fibers | Small, same direction as T |
| QT interval | Ventricular depolarization + repolarization | Rate-dependent; QTc ≤440 ms (men), ≤460 ms (women) |
ECG Paper Speed and Calibration
- Paper speed: 25 mm/s
- 1 small box = 1 mm = 40 ms (0.04 s)
- 5 small boxes = 1 large box = 200 ms (0.20 s)
- Amplitude: 1 mV = 10 mm (standard calibration)
Heart Rate Calculation
- 300 ÷ number of large boxes between R-R
- Or: 1500 ÷ number of small boxes between R-R
QTc Formulas (exam favourite)
- Bazett's formula: QTc = QT / √RR (RR in seconds)
- Framingham formula: QT = QT + 0.154 (1000 - RR) in ms
Key pharmacological effects on intervals:
- Drugs that impair Na⁺ influx (hyperkalemia, flecainide) → widen QRS
- Drugs that prolong phase 2/3 (amiodarone, hypocalcemia) → prolong QT
- Hypercalcemia, digoxin → shorten QT
4. ECG Leads - 12-Lead System
Limb Leads (Frontal Plane)
- Standard (bipolar) leads: I, II, III
- Augmented unipolar leads: aVR, aVL, aVF
Precordial (Chest) Leads (Horizontal Plane)
- V1, V2 - right ventricle
- V3, V4 - interventricular septum / anterior wall
- V5, V6 - lateral left ventricle
ECG Lead Territories (for MI localisation)
| Territory | Leads with Changes | Artery Involved |
|---|---|---|
| Anterior | V1-V4 | LAD |
| Lateral | I, aVL, V5-V6 | LCx |
| Inferior | II, III, aVF | RCA (or LCx) |
| Posterior | Tall R in V1-V2, ST depression V1-V2 | RCA/LCx |
| Right ventricular | V3R-V4R | RCA proximal |
5. Genesis of the Normal ECG
- Frontal plane axis (QRS axis): normally between -30° and +90°
- Left axis deviation (LAD): more negative than -30°
- Right axis deviation (RAD): more positive than +90°
- Hexaxial reference system: uses all 6 limb leads to determine axis
- The mean QRS axis reflects the net direction of ventricular depolarization
Normal axis mnemonic: "No man's land" = -90° to ±180°
6. Major ECG Abnormalities (High-Yield for Final Prof)
A. Chamber Enlargement
Right Atrial Enlargement (RAE) - "P pulmonale":
- Tall, peaked P wave >2.5 mm in lead II
- Best seen in II, III, aVF
Left Atrial Enlargement (LAE) - "P mitrale":
- Broad, notched P wave >120 ms in lead II ("M-shaped")
- Biphasic P in V1 with deep negative terminal component
Left Ventricular Hypertrophy (LVH):
- Cornell criteria: S in V3 + R in aVL >28 mm (men), >20 mm (women)
- Sokolow-Lyon: S in V1 + R in V5 or V6 >35 mm
- Associated "strain" pattern: ST depression + T inversion in lateral leads
Right Ventricular Hypertrophy (RVH):
- R > S in V1 (tall R in V1)
- RAD
- rSR' pattern or R wave progression reversal
B. Bundle Branch Blocks
Right Bundle Branch Block (RBBB):
- QRS ≥120 ms
- RSR' ("rabbit ears") in V1
- Wide S in I, V5, V6
- Complete RBBB = QRS ≥120 ms
Left Bundle Branch Block (LBBB):
- QRS ≥120 ms
- Broad, notched R in I, aVL, V5, V6 (no septal Q waves)
- Deep S in V1
- LBBB obscures MI diagnosis - use Sgarbossa criteria
Left Anterior Fascicular Block (LAFB):
- LAD (more negative than -45°)
- QRS <120 ms
- Small Q in I, aVL; small R in II, III, aVF
Left Posterior Fascicular Block (LPFB):
- RAD (+90° to +180°)
- Small R in I, aVL; small Q in II, III, aVF
- Diagnosis of exclusion
C. Myocardial Ischemia and Infarction
Ischemia vs. Injury vs. Infarction:
| Finding | ECG Change | Meaning |
|---|---|---|
| Ischemia | T-wave inversion (symmetric) | Subendocardial ischemia |
| Injury | ST elevation (≥1 mm in 2 contiguous leads) | Epicardial injury - STEMI |
| Subendocardial injury | ST depression | NSTEMI / UA |
| Infarction | Pathologic Q waves (>40 ms wide, >25% of R wave) | Necrosis |
Anterior STEMI (LAD occlusion):
- ST elevation V1-V4 → evolves to Q waves + T inversion
- Loss of R wave progression
Inferior STEMI (RCA occlusion):
- ST elevation II, III, aVF
- Reciprocal ST depression in I, aVL
- Check V3R/V4R for RV involvement
Evolution of Q-wave MI on ECG:
- Early: Hyperacute T waves (tall, peaked)
- Minutes-hours: ST elevation
- Hours: Q waves begin + T inversion
- Days-weeks: Q waves persist, ST normalises
- Chronic: Q waves remain (scar marker)
D. ST-T Wave Abnormalities
| Pattern | Causes |
|---|---|
| ST elevation | STEMI, Prinzmetal angina, pericarditis (saddle-shaped, diffuse), early repolarisation, LBBB, LVH strain |
| ST depression | NSTEMI, demand ischemia, LVH strain, digoxin (scooped "reverse tick"), hypokalemia |
| T inversion | Ischemia, RVH (V1-V4), LVH strain, myocarditis, Wellens syndrome |
| Tall peaked T waves | Hyperkalemia (earliest ECG sign), hyperacute MI |
| Flat/inverted T waves | Hypokalemia, ischemia, hypothyroidism |
E. Arrhythmia Recognition
Sinus rhythms:
- Normal sinus: rate 60-100, regular P before every QRS, PR 120-200 ms
- Sinus bradycardia: rate <60
- Sinus tachycardia: rate >100
Supraventricular arrhythmias:
- PAC: premature narrow QRS, P may be abnormal; non-compensatory pause
- Atrial fibrillation (AF): irregularly irregular rhythm, no distinct P waves, fibrillatory baseline
- Atrial flutter: regular sawtooth P waves at ~300/min (F waves), typically 2:1 block → ventricular rate ~150
- SVT (AVNRT/AVRT): sudden onset narrow QRS tachycardia, rate 150-250
Ventricular arrhythmias:
- PVC: wide QRS (≥120 ms), no preceding P, compensatory pause, T wave opposite QRS direction
- VT: ≥3 consecutive PVCs, rate >100, wide QRS, AV dissociation
- VF: chaotic, no identifiable QRS - requires immediate defibrillation
AV Blocks:
| Type | PR Interval | QRS Dropped? |
|---|---|---|
| 1st degree | >200 ms, fixed | No |
| 2nd degree Mobitz I (Wenckebach) | Progressive lengthening | Yes (periodic drop) |
| 2nd degree Mobitz II | Fixed (normal or prolonged) | Yes (sudden drop, constant ratio) |
| 3rd degree (complete) | No relation (AV dissociation) | All P waves fail to conduct |
F. Electrolyte Abnormalities
| Electrolyte | ECG Changes |
|---|---|
| Hyperkalemia | Peaked T → PR prolongation → wide QRS → sine wave → asystole |
| Hypokalemia | Flat T → prominent U wave → ST depression → QT prolongation |
| Hypercalcemia | Short QT (QT shortening) |
| Hypocalcemia | Long QT (QT prolongation) |
G. Pericarditis ECG
Classic four-stage evolution:
- Stage I: Diffuse ST elevation (saddle-shaped/concave up) + PR depression in most leads; PR elevation in aVR
- Stage II: ST returns to baseline, T flattening
- Stage III: T-wave inversion
- Stage IV: Normalization
Key differentiator from STEMI: pericarditis = diffuse leads, concave ST, PR depression; STEMI = territorial, convex/tombstone ST, reciprocal changes
7. Clinical Interpretation Approach (Systematic Method)
Use this systematic 10-step method in every ECG:
- Rate - bradycardia / normal / tachycardia
- Rhythm - regular or irregular
- P waves - present, morphology, one before each QRS?
- PR interval - 120-200 ms?
- QRS duration - narrow (<120 ms) or wide (≥120 ms)?
- QRS axis - normal, LAD, RAD?
- QRS morphology - Q waves, R wave progression, BBB?
- ST segment - elevation or depression?
- T waves - normal, inverted, peaked?
- QT interval - prolonged? Calculate QTc
8. Special Patterns (Exam Favourites)
| Pattern | Findings | Significance |
|---|---|---|
| Wolff-Parkinson-White (WPW) | Short PR (<120 ms), delta wave, wide QRS | Pre-excitation via accessory pathway; risk of AF → VF |
| Brugada syndrome | Coved ST elevation V1-V2 with RBBB pattern | Idiopathic VF, sudden death |
| Long QT syndrome | QTc >440 ms (men) / >460 ms (women) | Torsades de pointes, sudden cardiac death |
| Wellens syndrome | Biphasic or deep T inversion V2-V3, no pain at time of ECG | Critical LAD stenosis, pre-infarction pattern |
| De Winter pattern | Upsloping ST depression + tall T in V1-V4, no ST elevation | Proximal LAD occlusion equivalent |
| Digitalis effect | Scooped ("reverse tick") ST depression, short QT | Therapeutic digoxin |
| Digoxin toxicity | Any arrhythmia especially PAT with block, bidirectional VT | Toxic levels |
9. Computerised ECG
Computerised ECG systems can accurately measure intervals and axes, but clinical context (symptoms, exam) is always required for interpretation. The machine report is a screening tool, not a final diagnosis - all computer interpretations must be verified by a clinician.
Summary Table for Finals Quick Revision
| Topic | Key Point |
|---|---|
| P wave = atrial depolarisation | Normal <120 ms, <2.5 mm |
| QRS = ventricular depolarisation | Normal ≤110 ms |
| PR interval | 120-200 ms; prolonged in AV block |
| QTc | >440 ms (men) / >460 ms (women) = prolonged |
| STEMI | ST elevation ≥1 mm in ≥2 contiguous leads |
| Pathologic Q wave | >40 ms wide OR >25% of R wave |
| LBBB | QRS ≥120 ms, broad R in lateral leads, no septal Q |
| RBBB | RSR' in V1, wide S in I/V6, QRS ≥120 ms |
| AF | Irregularly irregular, no P waves |
| Atrial flutter | Sawtooth at 300/min, 2:1 block → rate ~150 |
| 3rd degree AV block | AV dissociation; P and QRS independent |
| Hyperkalemia | Peaked T → wide QRS → sine wave |
| Pericarditis | Diffuse saddle ST + PR depression |
| WPW | Short PR + delta wave |
Source: Harrison's Principles of Internal Medicine 22e (2025), Chapter 247 - Electrocardiography (Ary L. Goldberger)
This is a shared conversation. Sign in to Orris to start your own chat.