Why the t wave is inverted in V1 lead

Reading File
Finding Sources
Searching PubMed

"T wave inversion" AND electrocardiography

Searching the Web

ECG T wave inversion V1 normal variant guideline

Searching Images

ECG normal T wave inversion V1 lead example
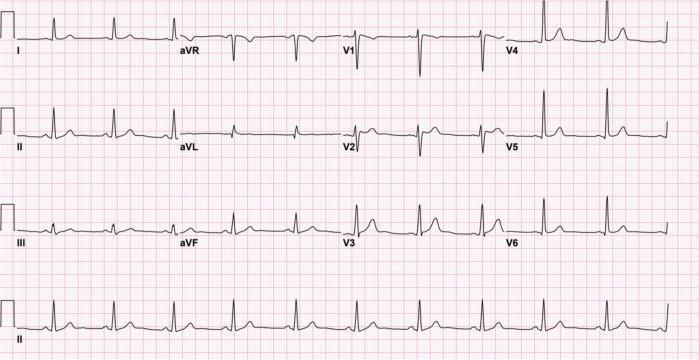
This diagnostic image is a standard 12-lead electrocardiogram (ECG) displayed on a pink grid background. The tracing demonstrates a regular normal sinus rhythm with clearly visible P waves preceding each QRS complex. The QRS complexes are narrow and exhibit normal morphology across the limb leads (I, II, III, aVR, aVL, aVF) and precordial leads (V1-V6). Lead aVR shows an expected global inversion of the P, QRS, and T waves. In the precordial leads, there is a normal progression of R-wave amplitude from V1 to V6, with the S-wave amplitude decreasing accordingly. The ST segments are predominantly isoelectric, showing a resolution of prior significant ST-segment elevation. Minor J-point elevation is noted in leads V1 and V2, though the characteristic 'coved' type 1 Brugada pattern is no longer prominent. T waves are upright in the majority of leads, particularly the lateral precordial leads (V4-V6). This ECG serves as a clinical example of the pharmacological reversal or resolution of a drug-induced Brugada phenocopy following the discontinuation of inciting medications like lamotrigine.
This diagnostic image is a standard 12-lead electrocardiogram (ECG) displayed on a pink grid background. The tracing demonstrates a regular normal sinus rhythm with clearly visible P waves preceding each QRS complex. The QRS complexes are narrow and exhibit normal morphology across the limb leads (I, II, III, aVR, aVL, aVF) and precordial leads (V1-V6). Lead aVR shows an expected global inversion of the P, QRS, and T waves. In the precordial leads, there is a normal progression of R-wave amplitude from V1 to V6, with the S-wave amplitude decreasing accordingly. The ST segments are predominantly isoelectric, showing a resolution of prior significant ST-segment elevation. Minor J-point elevation is noted in leads V1 and V2, though the characteristic 'coved' type 1 Brugada pattern is no longer prominent. T waves are upright in the majority of leads, particularly the lateral precordial leads (V4-V6). This ECG serves as a clinical example of the pharmacological reversal or resolution of a drug-induced Brugada phenocopy following the discontinuation of inciting medications like lamotrigine.

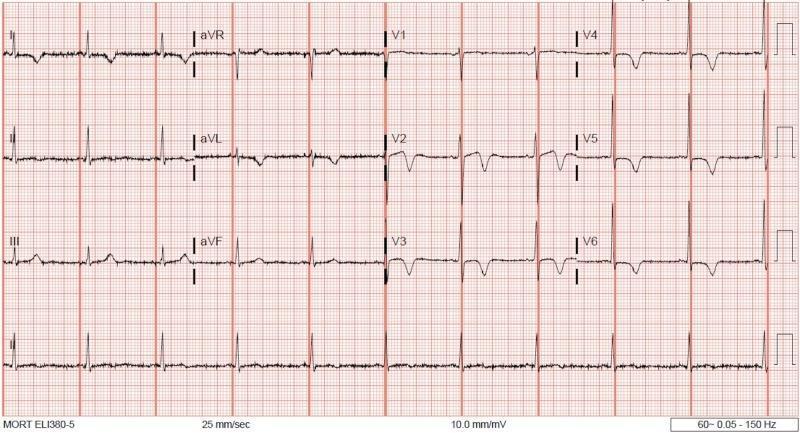
This diagnostic image is a standard 12-lead electrocardiogram (ECG) displayed on a traditional grid layout. The tracing shows a normal sinus rhythm with a heart rate of approximately 75-80 bpm. The QRS complexes exhibit normal duration and a standard R-wave progression across the precordial leads (V1-V6). The most prominent diagnostic feature is the presence of deep, symmetric T-wave inversions in the anterolateral leads, specifically V2 through V6, as well as lead aVL. There is a notable resolution of previously reported ST-segment elevation, with the ST segments now appearing largely isoelectric. These findings are clinically significant as they often represent a post-ischemic state or reperfusion following transient coronary vasospasm, such as Prinzmetal's angina. The limb leads (I, II, III, aVR, aVL, aVF) show upright T waves except in aVR (where inversion is physiological) and aVL. This ECG serves as an educational example of dynamic T-wave changes and the resolution of injury patterns in the context of acute coronary syndromes or vasospastic disorders.
This diagnostic image is a standard 12-lead electrocardiogram (ECG) displayed on a traditional grid layout. The tracing shows a normal sinus rhythm with a heart rate of approximately 75-80 bpm. The QRS complexes exhibit normal duration and a standard R-wave progression across the precordial leads (V1-V6). The most prominent diagnostic feature is the presence of deep, symmetric T-wave inversions in the anterolateral leads, specifically V2 through V6, as well as lead aVL. There is a notable resolution of previously reported ST-segment elevation, with the ST segments now appearing largely isoelectric. These findings are clinically significant as they often represent a post-ischemic state or reperfusion following transient coronary vasospasm, such as Prinzmetal's angina. The limb leads (I, II, III, aVR, aVL, aVF) show upright T waves except in aVR (where inversion is physiological) and aVL. This ECG serves as an educational example of dynamic T-wave changes and the resolution of injury patterns in the context of acute coronary syndromes or vasospastic disorders.

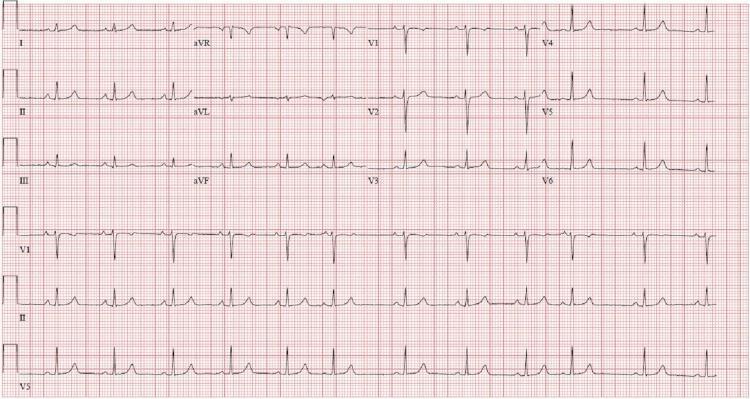
A standard 12-lead electrocardiogram (ECG) displayed on a red grid background with calibration markers. The tracing includes limb leads (I, II, III), augmented limb leads (aVR, aVL, aVF), and precordial leads (V1-V6), with additional rhythm strips at the bottom for leads VI, II, and V5. The ECG demonstrates a normal sinus rhythm with narrow QRS complexes and consistent P waves preceding each QRS. In the limb leads, the QRS axis is normal with predominantly positive deflections in leads I, II, III, aVL, and aVF, and a negative deflection in lead aVR. Precordial lead analysis shows normal R-wave progression from V1 through V6, characterized by small R waves and deep S waves in V1-V2 transitioning to dominant R waves in V5-V6. ST segments are generally isoelectric without acute ST-elevation or significant depression. T-waves are upright in the lateral and inferior leads, with inversion noted in aVR. The tracing lacks evidence of acute ischemic changes, significant arrhythmias, or conduction blocks, serving as an educational example of a baseline ECG in a clinical setting.

A standard 12-lead electrocardiogram (ECG) displayed on a red grid background with calibration markers. The tracing includes limb leads (I, II, III), augmented limb leads (aVR, aVL, aVF), and precordial leads (V1-V6), with additional rhythm strips at the bottom for leads VI, II, and V5. The ECG demonstrates a normal sinus rhythm with narrow QRS complexes and consistent P waves preceding each QRS. In the limb leads, the QRS axis is normal with predominantly positive deflections in leads I, II, III, aVL, and aVF, and a negative deflection in lead aVR. Precordial lead analysis shows normal R-wave progression from V1 through V6, characterized by small R waves and deep S waves in V1-V2 transitioning to dominant R waves in V5-V6. ST segments are generally isoelectric without acute ST-elevation or significant depression. T-waves are upright in the lateral and inferior leads, with inversion noted in aVR. The tracing lacks evidence of acute ischemic changes, significant arrhythmias, or conduction blocks, serving as an educational example of a baseline ECG in a clinical setting.

An inverted or flat T wave in V1 alone is often a normal ECG variant, especially in women and young people.
Why it happens: V1 sits over the right side of the sternum. The net direction of normal ventricular repolarization is usually leftward and posterior, so its electrical vector may point away from V1. That produces a negative T wave in that lead. It is often concordant with the predominantly negative QRS complex normally seen in V1.
It is more likely to be physiologic when:
  • Inversion is isolated to V1
  • The T wave is shallow and asymmetrical
  • There are no ST-segment abnormalities, symptoms, or other ECG changes
  • It occurs in children or adolescents, where right-precordial T-wave inversion can be part of the juvenile pattern
A T-wave inversion deserves more assessment if it is new, deep and symmetric, extends into V2-V4 or beyond, or occurs with chest pain, breathlessness, syncope, palpitations, ST changes, or abnormal QRS findings. Possible causes then include anterior ischemia, right-ventricular strain such as pulmonary embolism, ventricular hypertrophy, bundle-branch block, or arrhythmogenic right-ventricular cardiomyopathy. Braunwald notes that right-heart strain in pulmonary embolism may produce T-wave inversion in V1-V4.
For an isolated V1 finding, this is usually benign, as summarized in this ECG interpretation reference. The clinical context and comparison with any prior ECG are what determine significance.

Isn't the vector of repolarization is upwards and rightwards

Reading File
Finding Sources
Searching PubMed

electrocardiography T wave vector repolarization

Searching the Web

normal mean T wave axis downward leftward anterior ECG repolarization vector

Not in the usual ECG-vector convention.
The mean ventricular T-wave vector is normally directed leftward, inferiorly (downward), and slightly anteriorly/forward. It is generally close to the mean QRS axis, which is why T waves are normally upright in leads I, II, and V4-V6. Harrison's describes the mean T-wave vector as roughly concordant with the QRS vector, usually within about 45 degrees in the frontal plane.
The confusing part is this:
  • The sequence of ventricular repolarization proceeds mainly from epicardium to endocardium, opposite to depolarization.
  • But repolarization has opposite electrical polarity to depolarization.
  • These two opposites cancel in terms of the surface ECG direction, so the resulting T-wave vector points in approximately the same overall direction as the QRS vector, not opposite to it.
So, in 3D, normal T vector: left + down + forward.
Why can V1 still have an inverted T wave? V1 is a right-anterior chest lead. The normal T vector may project weakly away from it, especially because V1 is near the transition zone and individual cardiac position varies. Thus, a shallow inverted or flat T in V1 alone can be normal. The normal ECG vector discussion similarly describes the normal T vector as forward, slightly leftward, and downward.
You may be recalling the terminal QRS vector, generated by late activation of basal ventricular regions, which is often upward and posterior. That is a QRS component, not the overall normal T-wave vector.
This is a shared conversation. Sign in to Orris to start your own chat.