Characteristics of biostatistics

Reading File
Searching the Web

characteristics of biostatistics medical statistics

Finding Sources
Finding Sources
Reading File
Finding Sources
Finding Sources
Finding Sources
Reading File
Finding Sources
Reading File
Now I have sufficient material from the textbook and web sources to deliver a thorough answer. Let me compile it.

Characteristics of Biostatistics

Biostatistics is the branch of statistics concerned with data arising from biological and health sciences. It provides the mathematical and methodological foundation for medical research, clinical trials, epidemiology, and public health decision-making.

1. Definition and Scope

Biostatistics applies statistical principles to biological, medical, and public health data. Its scope covers:
  • Designing experiments and observational studies
  • Collecting and organizing biological data
  • Analyzing and interpreting results
  • Drawing valid scientific conclusions
As the University of Washington Department of Biostatistics puts it: biostatistics is about "turning data into knowledge" and is central to all of science because science depends on gathering and evaluating evidence to make judgments.

2. Core Characteristics

A. Deals with Variability

Biological data is inherently variable - no two patients, measurements, or responses are identical. Biostatistics quantifies and accounts for this variability using measures of central tendency (mean, median, mode) and dispersion (variance, standard deviation, range).

B. Uses Probability Theory

Every inference in biostatistics is probabilistic. Concepts like p-values, confidence intervals, and hypothesis testing all rest on probability. For example:
  • The 95% confidence interval describes the range of values within which there is a 95% chance that the true population value falls; when confidence intervals for groups overlap, there is no statistically significant difference. (Harriet Lane Handbook, p. 958)

C. Two Main Branches

BranchPurpose
Descriptive statisticsSummarizes and presents data (tables, graphs, means, frequencies)
Inferential statisticsDraws conclusions about a population from a sample using hypothesis testing, regression, etc.

D. Population and Sample

  • A population is the entire group of interest (e.g., all diabetic adults in a country)
  • A sample is a subset drawn from the population for practical study
  • Biostatistics allows valid generalizations from samples to populations

E. Study Design is Integral

Biostatistics is inseparable from study design. Different designs serve different purposes (Harriet Lane Handbook, p. 958):
DesignKey Feature
Cross-sectionalMeasures exposure and outcome simultaneously; defines prevalence
Case-controlCompares cases vs. controls retrospectively; good for rare diseases
CohortFollows exposed vs. unexposed groups forward; defines incidence
Randomized Controlled Trial (RCT)Gold standard; randomization reduces confounding
Systematic Review / Meta-analysisPools data from multiple studies; highest statistical power

F. Hypothesis Testing

A central tool in biostatistics:
  • Null hypothesis (H₀): No effect or association exists
  • Alternative hypothesis (H₁): An effect or association exists
  • Alpha (α): Typically set at 0.05 - the threshold for statistical significance
  • Power (1 - β): Typically set at ≥ 0.80 - the probability of detecting a true effect (Harriet Lane Handbook, p. 958)
  • Sample size is calculated from predetermined power and α to detect a meaningful effect

G. Recognizes and Controls Bias

Biostatistics identifies and corrects for systematic errors (Harriet Lane Handbook, p. 955):
  • Selection bias - non-representative sampling
  • Information bias - flawed exposure/outcome measurement (includes recall bias, lead-time bias)
  • Confounding - a third variable distorts the apparent association between exposure and outcome
  • Effect modification - a variable changes the magnitude of an association in different subgroups

H. Multidisciplinary Nature

Biostatistics blends mathematics, biology, logic, and clinical judgment. It supports:
  • Clinical trials and drug development
  • Epidemiology and disease surveillance
  • Genetics and genomics
  • Public health policy
  • Laboratory medicine and diagnostic test evaluation

I. Supports Evidence-Based Medicine (EBM)

Biostatistics underpins the EBM framework (Harriet Lane Handbook, p. 953). Sackett's definition of EBM - "the conscientious, explicit, and judicious use of current best evidence in making decisions about the care of individual patients" - requires statistical tools to:
  1. Formulate answerable clinical questions (PICO)
  2. Search and appraise evidence
  3. Assess internal validity (unbiased conduct) and external validity (real-world applicability)
  4. Evaluate value: outcomes per cost

J. Deals with Different Data Types

Data TypeExamples
NominalBlood group, sex, presence/absence of disease
OrdinalPain scale, cancer staging
DiscreteNumber of hospital admissions
ContinuousBlood pressure, serum glucose, weight
Each type requires specific statistical tests, making classification a foundational step in any analysis.

Summary Table

CharacteristicCore Idea
VariabilityQuantifies natural biological fluctuation
ProbabilityAll inferences are probabilistic
Descriptive + InferentialSummarizes data AND draws conclusions
Population/SampleGeneralizes from part to whole
Study designIntegral to valid data collection
Hypothesis testingFormal framework for decision-making
Bias awarenessIdentifies and controls systematic errors
MultidisciplinaryBridges math, biology, and clinical judgment
EBM supportProvides tools for evidence appraisal
Data typesDifferent scales require different methods

Reference: Biostatistics and Evidence-Based Medicine section, The Harriet Lane Handbook - The Johns Hopkins Hospital, 23rd ed., pp. 953-958.

Make it as 20 marks answer naa explain and define each characteristics

Finding Sources
Searching the Web

characteristics of biostatistics detailed explanation definition scope features

Reading File
Finding Sources
Reading Web Page

https://acmcasereport.org/wp-content/uploads/2023/06/ACMCR-v…

Reading File
Finding Sources
Reading File
Finding Sources
I now have rich content from textbooks and peer-reviewed sources to write a full 20-mark answer. Here it is:

Characteristics of Biostatistics

(20-Mark Answer)


Definition of Biostatistics

Biostatistics (also called Biometry, from the Greek bios = life, metron = measurement) is the branch of applied statistics that deals with the collection, compilation, analysis, and interpretation of data related to biological and biomedical sciences. It provides the quantitative foundation for understanding health, disease, and clinical outcomes in both individuals and populations.
As Kunnavil (2022) defines it: "Biostatistics is a branch of applied statistics which deals with collection, compilation, analysis and interpretation of data related to biomedical sciences. It provides a key to better understanding of the medical discipline." - Ann Clin Med Case Rep, 2022
Biostatistics draws quantitative methods from statistics, operations research, economics, and mathematics, and applies them to epidemiology, nutrition, environmental health, genomics, population genetics, and clinical medicine.

Characteristics of Biostatistics


1. Aggregate of Facts (Data Must be Numerical)

Definition: Biostatistics deals with facts expressed as numbers. A single isolated observation has no statistical meaning - biostatistics requires a collection of measurements from multiple subjects.
Explanation: Statistics are always aggregates, not individual facts. For example, saying "one patient's blood pressure is 140/90 mmHg" is just an observation. But recording blood pressure across 500 hypertensive patients, computing the mean, and comparing it to a control group - that is biostatistics at work. Biological data arises from many individuals, and the aggregate is what allows meaningful conclusions. The larger the aggregate, the more reliable the statistical inference.
Example: Mortality rates, disease prevalence, mean serum glucose levels across a cohort.

2. Affected by Multiplicity of Causes (Variability)

Definition: Biological data is inherently variable - it is influenced by multiple factors simultaneously, including genetic, environmental, social, nutritional, and behavioral factors. Biostatistics acknowledges and quantifies this variability.
Explanation: Unlike physical measurements (e.g., the speed of light), biological measurements vary from person to person and within the same person over time. Blood pressure differs by age, sex, stress, posture, medication, and time of day. Biostatistics uses measures of central tendency (mean, median, mode) and dispersion (variance, standard deviation, range) to describe and account for this variability. Parametric tests are used when data follow a normal distribution - a bell-shaped curve where mean, median, and mode are all equal. (Harriet Lane Handbook, p. 956)
Example: The variability in drug response between patients is accounted for using standard deviation and confidence intervals in clinical trials.

3. Collected in a Systematic and Pre-planned Manner

Definition: Data in biostatistics must be gathered according to a pre-specified, scientific plan - not haphazardly. The research plan includes the research question, hypothesis, experimental design, data collection methods, and analytical strategy.
Explanation: Unsystematic data is unreliable and invalid. Biostatistics requires that before any study begins, the following are defined:
  • The research question (using the PICO framework - Patient, Intervention, Comparison, Outcome)
  • The hypothesis to be tested
  • The significance level (α)
  • The method of data collection
This is why study design is inseparable from biostatistics. The Harriet Lane Handbook describes the PICO process as the first step in evidence-based practice: formulating a precise clinical question before any data is sought. (Harriet Lane Handbook, p. 953)
Example: In an RCT studying a new antihypertensive, the dose, eligibility criteria, primary outcome, and follow-up period are all pre-specified before a single patient is enrolled.

4. Collected for a Definite Purpose

Definition: Statistical data in biomedical sciences must always be collected with a specific, pre-defined objective. Data collected without purpose leads to meaningless conclusions.
Explanation: The purpose drives everything - the study design, the variables measured, the population sampled, and the tests applied. Purposes in biostatistics may include:
  • Testing the efficacy of a new drug vs. placebo
  • Measuring disease prevalence in a community
  • Identifying risk factors for a specific disease
  • Evaluating the performance of a diagnostic test
  • Fixing priorities in public health programs
Without a defined purpose, the analyst cannot choose the appropriate statistical test or interpret results correctly.
Example: The purpose "to determine whether Drug A reduces cardiovascular mortality compared to placebo" defines every element of the study that follows.

5. Capable of Being Related to Each Other (Comparability)

Definition: Biostatistical data must be collected under comparable conditions and must be capable of being placed in relation to one another - enabling valid comparisons between groups, time points, or treatments.
Explanation: This characteristic is the foundation of comparative studies. For data to be comparable:
  • Cases and controls must be drawn from the same population
  • Measurements must use the same scale and instrument
  • Confounding variables must be controlled
Study designs in biostatistics are specifically structured to ensure comparability (Harriet Lane Handbook, p. 958):
Study DesignComparability Mechanism
Cross-sectionalOutcomes and risk factors measured simultaneously in same population
Case-controlCases (with disease) vs. controls (without disease) matched on key variables
CohortExposed vs. non-exposed followed over same time period
RCTRandomization ensures baseline comparability between arms
Example: In a case-control study of lung cancer, cases and controls must be matched for age and smoking status to make the comparison valid.

6. Accuracy and Precision

Definition: Biostatistical data must be sufficiently accurate and precise to allow valid conclusions. Accuracy means closeness to the true value; precision means reproducibility.
Explanation: While absolute accuracy is rarely achievable in biological measurements, biostatistics requires that data be collected with sufficient exactness for the purpose at hand. Errors are of two types:
  • Type I error (α error): Rejecting the null hypothesis when it is actually true (false positive). In medical research, α is typically preset at < 0.05 - this means a 95% certainty that a detected association is real. (Harriet Lane Handbook, p. 957)
  • Type II error (β error): Failing to reject the null hypothesis when the alternative is true (false negative). Power (1 - β) is typically set at ≥ 0.80, ensuring 80% certainty of detecting a true effect.
Imprecise measurement introduces information bias, which distorts results and must be minimized by standardizing data collection and blinding.
Example: A blood glucose meter that consistently reads 10 mg/dL higher than the true value has poor accuracy; one that gives wildly different readings each time has poor precision.

7. Based on Probability Theory

Definition: Every inference drawn in biostatistics is probabilistic, not absolute. Conclusions are expressed in terms of likelihood, not certainty.
Explanation: Biological systems are governed by chance. Medicine is a science in which chance is a significant factor, and biostatistics helps quantify the contribution of that chance. Key probability-based tools include:
  • P-value: The probability of obtaining the observed result if the null hypothesis is true. If P = 0.01, there is only a 1 in 100 chance the result occurred by chance alone. The P value is judged against α; if P < α, the association is deemed statistically significant. (Harriet Lane Handbook, p. 957)
  • Confidence Interval (CI): A 95% CI describes the range of values within which the true population parameter falls with 95% probability. When CIs for two groups overlap, the difference is not statistically significant. (Harriet Lane Handbook, p. 957)
  • Bayesian inference: Incorporates prior evidence and biological plausibility into probability calculations - an increasingly used approach in modern biostatistics.
Example: A drug trial showing P = 0.03 means there is a 3% probability the observed benefit occurred by chance, which is below the 0.05 threshold - the result is statistically significant.

8. Deals with Populations and Samples

Definition: Biostatistics distinguishes between the population (the entire group of interest) and the sample (a subset drawn from that population for study). It uses the sample to make valid inferences about the population.
Explanation: It is almost never feasible to study an entire population. Instead, a representative sample is selected. The validity of this inference depends on:
  • Sample size: The number of subjects needed to detect an effect with pre-set power and α. (Harriet Lane Handbook, p. 957)
  • Random sampling: Reduces selection bias
  • Representativeness: The sample must reflect the characteristics of the population
In biostatistics, "population" is broadly defined - it may refer not just to people but to all specimens of a particular type (e.g., all biopsy samples from a tumor type).
Example: To estimate the prevalence of diabetes in India, a stratified random sample of 10,000 individuals from different states and age groups is drawn and studied, and the result is generalized to the national population.

9. Uses Both Descriptive and Inferential Statistics

Definition: Biostatistics encompasses two major branches - descriptive (summarizing data) and inferential (drawing conclusions from data).
Explanation:
Descriptive Statistics organizes, summarizes, and presents data in an understandable form without making generalizations beyond the sample:
  • Measures of central tendency: Mean, Median, Mode
  • Measures of dispersion: Range, Variance, Standard Deviation, IQR
  • Graphical representations: Bar charts, histograms, box plots, scatter plots
Inferential Statistics uses data from a sample to make inferences about a population and to test hypotheses:
  • Parametric tests (t-test, ANOVA, Pearson correlation) - used when data follow a normal distribution (Harriet Lane Handbook, p. 956)
  • Non-parametric tests (Chi-square, Mann-Whitney U, Spearman) - used when data do not follow a normal distribution or are ordinal/nominal
  • Regression analysis - models the relationship between variables
Both branches are necessary - you must first describe your data before you can infer from it.
Example: A clinical trial first describes baseline characteristics of both arms (descriptive), then uses a t-test or ANOVA to determine if the outcome difference is statistically significant (inferential).

10. Multidisciplinary and Applied in Nature

Definition: Biostatistics does not exist in isolation. It is applied across multiple health and biological disciplines and draws from mathematics, probability, computing, and clinical judgment.
Explanation: Biostatistics is a fundamental scientific field in public health, health services, and biomedical research. Its applications span:
  • Clinical trials - drug safety and efficacy testing
  • Epidemiology - disease causation, outbreak investigation, risk factor identification
  • Genomics and genetics - population genetics, genome-wide association studies
  • Diagnostic medicine - evaluating sensitivity, specificity, and predictive values of tests
  • Public health - monitoring mortality, morbidity, program evaluation
  • Pharmacokinetics - modeling drug absorption, distribution, and elimination
  • Health policy - evidence-based guideline development
Biostatistics also serves as the engine of evidence-based medicine (EBM). According to Sackett's definition, EBM is "the conscientious, explicit, and judicious use of current best evidence in making decisions about the care of individual patients," integrating clinical expertise with statistical evidence from systematic research. (Harriet Lane Handbook, p. 953)
The discipline has expanded into machine learning, clinical epidemiology, molecular biology, and modern systems medicine, making it more stochastic, quantitative, and evidence-based than ever before.

Summary Table

#CharacteristicCore Concept
1Aggregate of factsBased on multiple numerical observations, not single data points
2Multiplicity of causesAccounts for biological variability from genetic, environmental, social factors
3Systematic collectionData must be gathered according to a pre-planned scientific protocol
4Definite purposeEvery biostatistical study must have a clearly defined objective
5ComparabilityData must be capable of valid comparison between groups or conditions
6Accuracy and precisionMinimizes Type I and Type II errors; preset α and power
7Based on probabilityAll inferences are probabilistic (P-values, confidence intervals)
8Population and sampleValid generalizations from a representative sample to the population
9Descriptive + InferentialSummarizes data AND draws conclusions beyond the observed sample
10MultidisciplinaryApplied across clinical medicine, epidemiology, public health, genetics, and EBM

References:
  • The Harriet Lane Handbook - The Johns Hopkins Hospital, 23rd Edition, Chapter 29: Biostatistics and Evidence-Based Medicine, pp. 953-958
  • Kunnavil R. Bio-Statistics Newer Advances, Scope & Challenges in Bio-Medical Research. Ann Clin Med Case Rep. 2022; V8(14): 1-7

Any other 1 point

Here is one more important characteristic:

11. Recognizes and Controls Bias and Confounding

Definition: A fundamental characteristic of biostatistics is its systematic ability to identify, measure, and control for bias and confounding variables that can distort study results and lead to false conclusions.
Explanation: Biological and clinical research is vulnerable to multiple sources of error that are not due to chance alone. Biostatistics provides the tools to detect and manage these errors:
Types of Bias:
  • Selection Bias - Occurs when the sample studied is not representative of the target population. For example, an RCT performed in healthy volunteers whose results are then applied to sicker patients introduces sampling bias. (Harriet Lane Handbook, p. 955)
  • Information Bias - Caused by flawed collection of data on exposures or outcomes:
    • Recall bias - Awareness of a disease alters how subjects remember past exposures
    • Lead-time bias - Early detection of a disease is mistakenly interpreted as increased survival
  • Exclusion Bias - When certain populations (e.g., children, pregnant women) are excluded from a study, limiting how broadly the results can be applied
Confounding:
A confounder is a third variable that is associated with both the exposure and the outcome, creating a false apparent relationship between them. For example, ice cream sales appear to increase violence - but both are explained by hot weather (the confounder). Confounding is best controlled by randomization in RCTs, or by matching, stratification, and statistical adjustment in observational studies. (Harriet Lane Handbook, p. 955)
Effect Modification (Interaction):
An effect modifier changes the magnitude of an association in different subgroups. For example, if a new drug works in female children but not male children, sex is an effect modifier. This is controlled by stratification.
Why This Matters:
Without recognizing bias and confounding, a study may conclude that a treatment works when it does not, or that a risk factor causes disease when it is merely associated through a third variable. Biostatistics provides directed tools - randomization, blinding, matching, regression adjustment, and directed acyclic graphs (DAGs) - to protect against these errors and ensure valid, trustworthy conclusions.

In short: Biostatistics is not just about calculating numbers - it is equally about ensuring those numbers are free from systematic distortion, making bias control one of its most defining characteristics.

Another final

Here is the final additional characteristic:

12. Deals with Different Types of Data (Classification of Variables)

Definition: Biostatistics recognizes that not all biological data is the same. A core characteristic is its ability to classify data into different types and apply the appropriate statistical method for each type.
Explanation: The type of data collected determines which statistical test is valid. Using the wrong test on the wrong data type produces meaningless or misleading results. Biostatistics therefore begins every analysis by classifying the variables involved.

Types of Data in Biostatistics:
A. Qualitative Data (Categorical)
Data that describes a quality or category with no natural numeric scale.
  • Nominal Data - Categories with no natural order. There is no ranking between groups.
    • Examples: Blood group (A, B, O, AB), sex (male/female), presence or absence of disease
    • Statistical tools: Chi-square test, frequency tables, bar charts
  • Ordinal Data - Categories that have a natural order or ranking, but the intervals between them are not equal.
    • Examples: Pain scale (mild, moderate, severe), cancer staging (Stage I, II, III, IV), socioeconomic status
    • Statistical tools: Median, Mann-Whitney U test, Spearman correlation

B. Quantitative Data (Numerical)
Data that has a natural numeric scale and can be measured.
  • Discrete Data - Can only take specific whole number values; cannot be meaningfully subdivided.
    • Examples: Number of hospital admissions, number of children, number of seizure episodes
    • Statistical tools: Poisson distribution, frequency counts
  • Continuous Data - Can take any value within a range, including fractions and decimals.
    • Examples: Blood pressure (mmHg), serum glucose (mg/dL), body weight (kg), temperature (°C)
    • Statistical tools: Mean, standard deviation, t-test, ANOVA, Pearson correlation
Continuous data is further subdivided into:
  • Interval scale - Equal intervals but no true zero (e.g., temperature in °C)
  • Ratio scale - Equal intervals with a true zero (e.g., weight, height, blood glucose)

Why This Characteristic Matters:
Data TypeMeasure of Central TendencyAppropriate Test
NominalModeChi-square
OrdinalMedianMann-Whitney, Wilcoxon
Discrete / Continuous (normal)Meant-test, ANOVA
Continuous (non-normal)MedianNon-parametric tests
Misclassifying data leads to incorrect test selection, invalid p-values, and flawed conclusions. Biostatistics insists on this classification step before any analysis begins, making it one of its most foundational and practical characteristics.

Example: If a researcher wants to compare pain levels (ordinal scale: mild/moderate/severe) between two treatment groups, using a t-test (which assumes continuous, normally distributed data) would be inappropriate. The correct choice is the Mann-Whitney U test, which works on ranked ordinal data.

In short: Biostatistics does not apply a one-size-fits-all approach. Its recognition that different data types demand different methods is what makes it a rigorous and scientifically sound discipline.

Next question scales of measurement 20 marks

Finding Sources
Searching the Web

scales of measurement biostatistics nominal ordinal interval ratio detailed explanation

Finding Sources
Finding Sources
Finding Sources
Finding Sources
Reading File
Finding Sources
Finding Sources
Finding Sources
Reading File
Reading File
Excellent - I now have rich textbook and research content. Here is the full 20-mark answer:

Scales of Measurement

(20-Mark Answer)


Introduction

Scales of measurement (also called levels of measurement) refer to the rules and procedures by which numbers or symbols are assigned to characteristics of objects or events. The concept was formally introduced by psychologist Stanley Smith Stevens in 1946, who classified measurement into four hierarchical levels: Nominal, Ordinal, Interval, and Ratio (remembered by the acronym NOIR).
Understanding scales of measurement is foundational in biostatistics because the scale of a variable determines:
  • What mathematical operations can be performed on it
  • Which measures of central tendency and dispersion are appropriate
  • Which statistical tests (parametric or non-parametric) are valid
As described in the Tietz Textbook of Laboratory Medicine: "Many constituents in laboratory medicine can be measured on a nominal scale... or an ordinal scale... Often, measurements performed on an ordinal scale are measurements that can also be performed on a ratio or interval (numeric) scale." (Tietz Textbook of Laboratory Medicine, 7th ed., p. 237)

The Four Scales of Measurement

The four scales form a hierarchy - each higher scale possesses all the properties of the lower ones plus an additional property:
ScaleProperties
NominalIdentity (naming/classifying)
OrdinalIdentity + Order (ranking)
IntervalIdentity + Order + Equal intervals
RatioIdentity + Order + Equal intervals + True zero

1. Nominal Scale

Definition

The nominal scale is the lowest and simplest level of measurement. It involves classifying or categorizing data into mutually exclusive and exhaustive groups, where the categories are merely named or labeled. There is no quantitative relationship between the categories - they cannot be ranked, ordered, or compared mathematically.
The word "nominal" comes from the Latin nomen meaning "name."

Properties

  • Data is divided into distinct categories
  • Categories are mutually exclusive (one observation belongs to only one category)
  • Categories are exhaustive (every observation fits into a category)
  • No natural order or ranking between categories
  • Numbers assigned are just labels, not quantities (e.g., Male = 1, Female = 2 does not mean female is "more than" male)

Examples in Biomedical Sciences

  • Blood group: A, B, AB, O
  • Sex: Male, Female
  • Religion / Marital status
  • Disease present / absent (dichotomous nominal)
  • Type of bacteria: E. coli, Group A Streptococcus, Klebsiella (Tietz, p. 237)
  • Type of surgical procedure: Appendectomy, Cholecystectomy, Hernia repair
  • Eye color, Hair color

Measures Applicable

  • Central tendency: Mode only (the most frequently occurring category)
  • Dispersion: Frequency counts and percentages
  • Statistical tests: Chi-square test, Fisher's exact test

What CANNOT Be Done

  • Cannot calculate mean or median (meaningless for categories)
  • Cannot say one group is "greater than" or "less than" another
  • Cannot perform arithmetic operations

2. Ordinal Scale

Definition

The ordinal scale is the second level of measurement. It has all the properties of the nominal scale but adds the ability to rank or order the categories in a meaningful sequence. However, the intervals between ranks are not equal - the difference between consecutive ranks is unknown or unequal.
The word "ordinal" comes from Latin ordinalis meaning "order."

Properties

  • Data can be categorized AND ranked
  • The order is meaningful (one category is "more" or "less" than another)
  • The distance between categories is not equal or measurable
  • Ratios between values have no meaning

Examples in Biomedical Sciences

  • Pain scale: Mild, Moderate, Severe (we know severe > moderate > mild, but the gap between mild and moderate may not equal the gap between moderate and severe)
  • Cancer staging: Stage I < Stage II < Stage III < Stage IV
  • Likert scale: Strongly Disagree, Disagree, Neutral, Agree, Strongly Agree
  • Urine dipstick results: 0, 1+, 2+, 3+, 4+ (graded responses for increasing analyte) (Tietz, p. 237)
  • Socioeconomic status: Low, Middle, High
  • APGAR score (newborn assessment: 0-10)
  • Muscle power grading: 0-5 (MRC scale)

Measures Applicable

  • Central tendency: Median and Mode
  • Dispersion: Range, Percentiles, Interquartile range
  • Statistical tests: Mann-Whitney U test, Wilcoxon signed-rank test, Kruskal-Wallis test, Spearman rank correlation (Harriet Lane Handbook, p. 956)

What CANNOT Be Done

  • Cannot calculate the arithmetic mean (it would be mathematically misleading)
  • Cannot say "Stage II is twice as severe as Stage I"
  • Cannot perform multiplication or division meaningfully

3. Interval Scale

Definition

The interval scale is the third level of measurement. It has all the properties of the ordinal scale but adds the feature that the intervals (distances) between values are equal and measurable. However, it lacks a true zero point - zero on an interval scale does not mean the complete absence of the attribute; it is just an arbitrary reference point.

Properties

  • Data can be categorized, ranked, and the difference between values is meaningful and equal
  • No absolute zero - zero is arbitrary
  • Can add and subtract values meaningfully
  • Cannot multiply or divide meaningfully (ratios are not valid)

Examples in Biomedical Sciences

  • Temperature in Celsius or Fahrenheit: The difference between 20°C and 30°C is the same as between 30°C and 40°C. But 0°C does not mean "no temperature" - it is just the freezing point of water. 40°C is NOT "twice as hot" as 20°C in any physical sense.
  • IQ scores: The difference between IQ 90 and 100 equals the difference between 110 and 120, but IQ 0 does not mean "no intelligence"
  • Calendar years: 2000 AD is not "twice as recent" as 1000 AD
  • pH scale (in the linear sense)
  • Standardized psychological test scores

Measures Applicable

  • Central tendency: Mean, Median, Mode
  • Dispersion: Variance, Standard deviation, Range
  • Statistical tests: t-test, ANOVA, Pearson correlation coefficient, linear regression (Harriet Lane Handbook, p. 956)

What CANNOT Be Done

  • Cannot form ratios: 60°C is NOT twice as hot as 30°C
  • Multiplication and division of raw values is not valid
  • Cannot say "Patient A's IQ is twice that of Patient B"

4. Ratio Scale

Definition

The ratio scale is the highest and most informative level of measurement. It has all the properties of the interval scale but additionally possesses a true zero point, meaning zero represents the complete absence of the attribute being measured. This allows meaningful ratio comparisons between values.

Properties

  • Data can be categorized, ranked, and the intervals are equal
  • Has an absolute (true) zero - zero means "none" of the attribute
  • All arithmetic operations are valid: addition, subtraction, multiplication, division
  • Ratios between values are meaningful (e.g., 4 kg is twice as heavy as 2 kg)

Examples in Biomedical Sciences

  • Body weight (kg): 0 kg = no mass; 80 kg is twice as heavy as 40 kg
  • Height (cm): 0 cm = no height
  • Blood pressure (mmHg): 0 mmHg = no pressure
  • Serum glucose (mg/dL): 0 = no glucose present
  • Heart rate (beats/min): 0 = no heart beat
  • Age (years)
  • Drug dosage (mg)
  • Enzyme levels, hormone concentrations
  • Respiratory rate, urine output (mL/hr)

Measures Applicable

  • Central tendency: Mean, Median, Mode, Geometric mean
  • Dispersion: Variance, SD, Range, Coefficient of variation
  • Statistical tests: All parametric tests - t-test, ANOVA, Pearson correlation, regression, plus ratio-specific measures (Harriet Lane Handbook, p. 956)

What CAN Be Done (uniquely for ratio scale)

  • Can say "Patient A's glucose is twice that of Patient B"
  • Can calculate coefficient of variation (SD/Mean × 100%)
  • All four arithmetic operations are meaningful

Hierarchical Comparison of All Four Scales

PropertyNominalOrdinalIntervalRatio
Named/classified categories
Meaningful order/rank
Equal intervals between values
True zero (absolute absence)
Mean is meaningful
Ratios are meaningful

Statistical Tests Applicable to Each Scale

ScaleParametric TestNon-Parametric Test
NominalChi-square testFisher's exact test
Ordinal-Mann-Whitney U, Wilcoxon, Kruskal-Wallis, Spearman
Interval / Ratiot-test, ANOVA, Pearson correlation, RegressionNon-parametric equivalents if non-normal
(Modified from Greenhalgh T, BMJ 1997, as cited in Harriet Lane Handbook, p. 956)
Parametric tests are used when data follow a normal distribution (bell-shaped curve where mean = median = mode). They are generally more powerful. Non-parametric tests rank data rather than using absolute values and are used when a particular distribution cannot be assumed. (Harriet Lane Handbook, p. 957)

Clinical Relevance and Importance

  1. Choosing the right test: Applying a t-test (parametric) to ordinal pain scale data is statistically invalid - the correct test would be Mann-Whitney U.
  2. Interpreting results correctly: A mean APGAR score of 7.5 has no real meaning because APGAR is ordinal. The median is the appropriate measure.
  3. Diagnostic test design: Urine dipstick results are ordinal (0 to 4+), but underlying urine protein can be measured on a ratio scale (mg/dL). The choice affects precision and the statistical approach used for evaluation. (Tietz, p. 237)
  4. Clinical trial data analysis: Drug dosages and outcomes like blood pressure, survival time, and serum levels are ratio scale - allowing the full power of parametric statistics.
  5. Epidemiology: Disease categories (present/absent) are nominal; severity grades are ordinal; incidence rates and blood values are ratio.

Memory Aid

NOIR (like the film genre - dark and layered):
Nominal - Name only Ordinal - Order matters Interval - Intervals equal, no true zero Ratio - Real zero exists, ratios valid

Summary

Scales of measurement form the backbone of all statistical reasoning in biostatistics. Moving from nominal to ratio, each scale gains additional mathematical properties. The scale of a variable determines what can be meaningfully computed from it and which statistical test is appropriate. Misidentifying the scale of a variable is one of the most common errors in biomedical research and directly leads to invalid conclusions.
References:
  • The Harriet Lane Handbook, 23rd ed. - Biostatistics and Evidence-Based Medicine, pp. 956-957
  • Tietz Textbook of Laboratory Medicine, 7th ed. - External Quality Assessment for Measurements on a Nominal or Ordinal Scale, p. 237
  • Miller's Review of Orthopaedics, 9th ed. - Testing Your Hypotheses with Statistics, p. 974
  • Stevens SS. On the Theory of Scales of Measurement. Science. 1946;103(2684):677-680

Next question scales of measurement 20 marks

You just asked this same question and I gave you the full 20-mark answer above. Here is a clean, formatted version of the same answer for easy use:

Scales of Measurement

(20-Mark Answer)


Introduction & Definition

Scales of measurement refer to the rules by which numbers or symbols are assigned to characteristics of objects or events. Introduced by Stanley Smith Stevens (1946), there are four hierarchical levels:
Nominal → Ordinal → Interval → Ratio (Acronym: NOIR)
Each higher scale has all the properties of the lower scale PLUS one additional property. The scale of a variable determines:
  • Which measures of central tendency apply
  • Which statistical test is valid (parametric vs. non-parametric)
  • What arithmetic operations are meaningful

Scale 1: Nominal Scale

Definition

The lowest level of measurement. Variables are named or classified into mutually exclusive categories with no quantitative relationship between them. Numbers assigned are mere labels, not quantities.
(From Latin: nomen = name)

Properties

  • Categories are mutually exclusive and exhaustive
  • No order, ranking, or direction between categories
  • Numbers are labels only (Male = 1, Female = 2 does not mean Female > Male)
  • Only equality/inequality can be determined

Medical Examples

ExampleCategories
Blood groupA, B, AB, O
SexMale, Female
Disease statusPresent / Absent
Bacteria identityE. coli, Klebsiella, Group A Strep
Type of surgeryAppendectomy, Cholecystectomy
Eye colourBrown, Blue, Green

Applicable Statistics

  • Central tendency: Mode only
  • Dispersion: Frequency, Percentage
  • Tests: Chi-square test, Fisher's exact test

What Cannot Be Done

  • No mean or median
  • No ranking
  • No arithmetic operations

Scale 2: Ordinal Scale

Definition

The second level of measurement. Adds ranking/ordering to the nominal properties. Categories can be placed in a meaningful sequence, but the intervals between ranks are unequal and unknown - we know the order but not the exact distance between categories.
(From Latin: ordinalis = order)

Properties

  • Categories are named AND ranked
  • Order is meaningful (one rank is greater/lesser than another)
  • Distance between consecutive ranks is NOT equal or measurable
  • Ratios between values are meaningless

Medical Examples

ExampleCategories
Pain scaleMild < Moderate < Severe
Cancer stagingStage I < II < III < IV
Likert scaleStrongly Disagree → Strongly Agree
Urine dipstick0, 1+, 2+, 3+, 4+
APGAR score0 - 10 (composite ordinal)
Muscle power (MRC)Grade 0 - 5
Socioeconomic statusLow < Middle < High
Note: We know Stage III is worse than Stage II, but we cannot say it is "twice as bad."

Applicable Statistics

  • Central tendency: Median, Mode
  • Dispersion: Range, Percentiles, Interquartile Range
  • Tests: Mann-Whitney U, Wilcoxon signed-rank, Kruskal-Wallis, Spearman rank correlation

What Cannot Be Done

  • Cannot calculate arithmetic mean (misleading)
  • Cannot multiply or divide meaningfully
  • Cannot assume equal spacing between ranks

Scale 3: Interval Scale

Definition

The third level of measurement. Adds equal and measurable intervals between values to the ordinal properties. However, it lacks a true zero - zero is an arbitrary reference point, not the complete absence of the attribute. Therefore, ratios between values are NOT valid.

Properties

  • Categories are named, ranked, and the distance between them is equal
  • Zero is arbitrary - does not mean "none" of the attribute
  • Addition and subtraction are valid
  • Multiplication and division of raw values are NOT valid

Medical Examples

ExampleWhy No True Zero
Temperature in °C or °F0°C = freezing point of water, not "no temperature"
IQ scoreIQ 0 does not mean "no intelligence"
Calendar yearYear 0 is arbitrary
pH scalepH 0 is not "no acidity"
Standardized psychological test scoresZero is a reference, not absence
Key point: 40°C is NOT twice as hot as 20°C because zero is arbitrary. But the difference between 20°C and 30°C equals the difference between 30°C and 40°C.

Applicable Statistics

  • Central tendency: Mean, Median, Mode
  • Dispersion: Variance, Standard deviation, Range
  • Tests: t-test, ANOVA, Pearson correlation, linear regression

What Cannot Be Done

  • Cannot form ratios (40°C ≠ twice 20°C)
  • Multiplication and division of raw values are misleading

Scale 4: Ratio Scale

Definition

The highest and most informative level of measurement. Possesses all properties of the interval scale PLUS a true (absolute) zero, meaning zero represents the complete absence of the attribute. All arithmetic operations and ratio comparisons are valid.

Properties

  • Categories are named, ranked, equally spaced, AND have a true zero
  • Zero = complete absence of the attribute
  • All four arithmetic operations (+ − × ÷) are valid
  • Ratios between values are meaningful ("twice as much," "half as much")

Medical Examples

ExampleWhy True Zero Exists
Body weight (kg)0 kg = no mass at all
Height (cm)0 cm = no height
Blood pressure (mmHg)0 = no pressure
Serum glucose (mg/dL)0 = no glucose
Heart rate (beats/min)0 = cardiac arrest
Drug dosage (mg)0 = no drug given
Age (years)0 = birth
Urine output (mL/hr)0 = no urine
Enzyme / hormone levels0 = absent
Key point: A patient weighing 80 kg is exactly twice as heavy as a patient weighing 40 kg. A blood glucose of 200 mg/dL is twice that of 100 mg/dL.

Applicable Statistics

  • Central tendency: Mean, Median, Mode, Geometric mean
  • Dispersion: Variance, SD, Range, Coefficient of Variation (CV = SD/Mean × 100%)
  • Tests: All parametric tests - t-test, ANOVA, Pearson correlation, regression analysis, and ratio-specific computations

Hierarchical Comparison - Master Table

PropertyNominalOrdinalIntervalRatio
Named categories
Meaningful order/rank
Equal intervals between values
True zero (absolute absence)
Mode applicable
Median applicable
Mean applicable
Ratios meaningful

Statistical Tests by Scale

ScaleParametric TestNon-Parametric Test
NominalChi-squareFisher's exact test
OrdinalNot applicableMann-Whitney U, Wilcoxon, Kruskal-Wallis, Spearman
Interval / Ratio (normal)t-test, ANOVA, Pearson, RegressionEquivalent non-parametric tests if non-normal
Parametric tests are used when data follow a normal distribution (bell-shaped curve where mean = median = mode) - they are generally more powerful. Non-parametric tests rank data rather than use absolute values and are applied when a normal distribution cannot be assumed. (Harriet Lane Handbook, p. 957)

Difference Between Interval and Ratio - The Critical Distinction

This is the most commonly confused pair:
FeatureIntervalRatio
True zeroNo (arbitrary zero)Yes (absolute zero)
Ratios valid?NoYes
ExampleTemperature in °CTemperature in Kelvin (0K = absolute zero)
Can say "twice as much"?NoYes
Temperature in Kelvin is a ratio scale because 0K = absolute zero = complete absence of molecular motion. Temperature in Celsius is an interval scale because 0°C is merely the freezing point of water, not the absence of heat.

Clinical Importance of Correct Scale Identification

  1. Validity of statistical tests: Using a t-test on ordinal pain scores (mild/moderate/severe) is invalid. The Mann-Whitney U test must be used instead.
  2. Interpreting central tendency correctly: The mean APGAR score across a group is mathematically misleading - the median is the appropriate measure for ordinal APGAR scores.
  3. Diagnostic test design: Urine dipstick readings (ordinal: 0-4+) carry less precision than measuring actual protein concentration in mg/dL (ratio). Ordinal tests trade precision for speed and accessibility. (Tietz Textbook of Laboratory Medicine, p. 237)
  4. Clinical trials: Drug doses, serum concentrations, and physiological parameters (BP, HR, temperature) are mostly ratio scale - allowing the full range of parametric statistics for analysis.
  5. Avoiding false conclusions: Saying "the average blood group is 2.3" is meaningless - blood group is nominal. Saying "Stage II is twice as severe as Stage I" is invalid - cancer stage is ordinal.

Memory Aid

Nominal - Name only Ordinal - Order matters Interval - Intervals equal, no true zero Ratio - Real zero, ratios valid
Or remember it as NOIR - each letter adds one more property.

Conclusion

Scales of measurement are the starting point of every biostatistical analysis. Nominal data names, ordinal data ranks, interval data measures equal gaps, and ratio data provides absolute quantification. Correctly identifying the scale of a variable is not merely an academic exercise - it directly determines the validity of the statistical method chosen, the appropriateness of summary measures used, and the accuracy of the conclusions drawn in clinical and public health research.

References:
  • The Harriet Lane Handbook, Johns Hopkins Hospital, 23rd ed., pp. 956-957
  • Tietz Textbook of Laboratory Medicine, 7th ed., p. 237
  • Miller's Review of Orthopaedics, 9th ed., p. 974
  • Stevens SS. On the Theory of Scales of Measurement. Science. 1946;103(2684):677-680

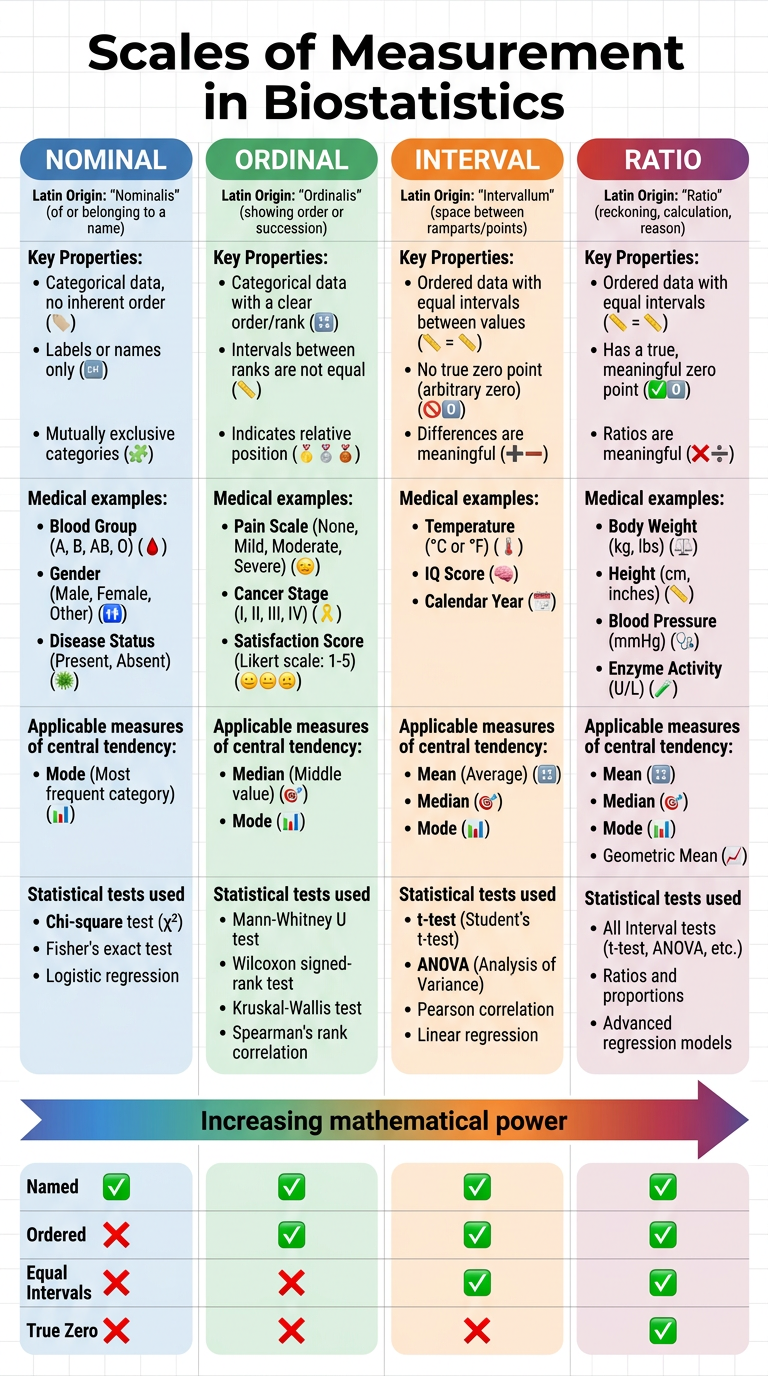
Create a visual comparison poster of the four scales with examples

Generating Image

A clean, professional educational poster titled "Scales of Measurement in Biostatistics" showing four columns side by side, one for each scale: Nominal, Ordinal, Interval, and Ratio. Each column has a distinct color (Nominal = blue, Ordinal = green, Interval = orange, Ratio = red/purple). Each column contains: the scale name at the top in large bold text, a Latin origin note, key properties listed as bullet points, medical examples with icons (blood group, pain scale, temperature, body weight), the applicable measures of central tendency, and the statistical tests used. At the bottom a summary row shows a hierarchy arrow from Nominal to Ratio labeled "Increasing mathematical power". Include a checkmark/cross comparison table showing which properties (Named, Ordered, Equal Intervals, True Zero) each scale has. Use icons and color coding throughout. Clean white background, modern medical education style.

Scales of Measurement in Biostatistics - Visual Comparison Poster
Here is your visual comparison poster covering all four scales. It includes:
  • Color-coded columns - one for each scale (Nominal = blue, Ordinal = green, Interval = orange, Ratio = red/purple)
  • Key properties listed per scale
  • Medical examples for each
  • Applicable statistics and tests
  • Hierarchy arrow showing increasing mathematical power from Nominal → Ratio
  • Checkmark/cross comparison for Named, Ordered, Equal Intervals, and True Zero properties
You can save this image directly for your notes or revision material.
This is a shared conversation. Sign in to Orris to start your own chat.