
Coefficient of thermal expansion in dentistry
coefficient of thermal expansion dentistry dental materials CTE values enamel dentin
https://pocketdentistry.com/2-properties-of-materials
coefficient of thermal expansion dental materials comparison table
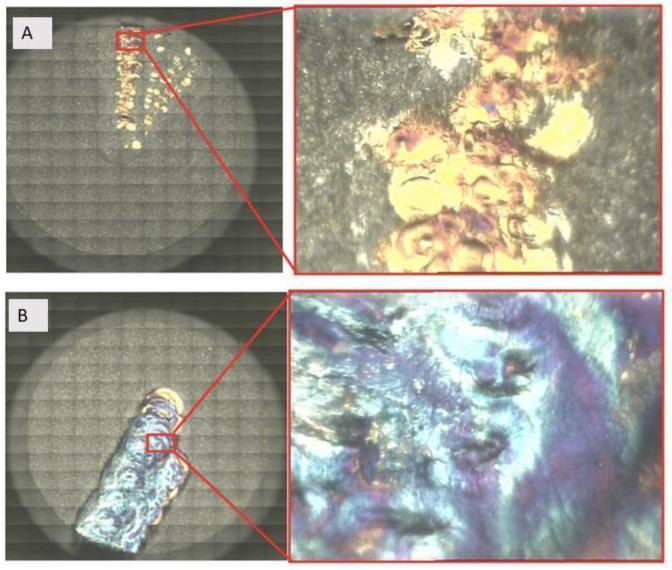
Comparison of laser-treated dental implant materials (Grade 4 titanium disks) visualized through light microscopy to assess surface topography and oxidation. Panel A displays a titanium disk after 1 W Er:YAG laser irradiation, showing a heterogeneous distribution of golden-yellow and silver-white regions against a darker background. The magnified view reveals granular surface irregularities and signs of localized thermal alteration. Panel B depicts the surface after 4 W Er:YAG laser irradiation, demonstrating a more uniform and extensive modification characterized by a blue and iridescent chromatic scale. This high-power treatment results in a smoother, blended texture indicative of advanced material melting, resolidification, and the formation of a thicker titanium oxide (TiO2) layer. These images are clinically relevant for evaluating dental implant decontamination and modification protocols, highlighting how different power settings impact surface roughness, oxide layer thickness, and potential microfracture formation, which are critical for osseointegration and biocompatibility.
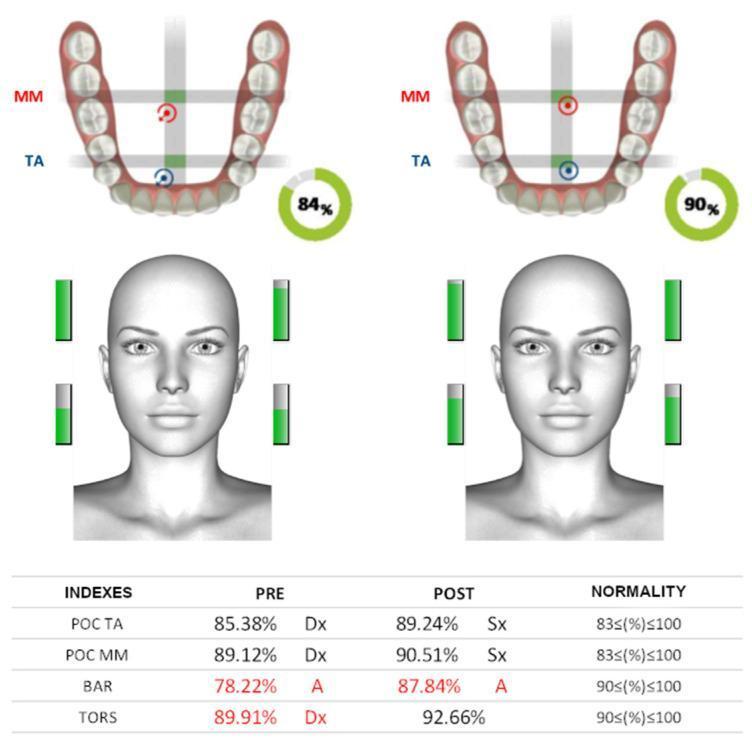
A comparison infographic displaying surface electromyography (sEMG) data for dental occlusion assessment, comparing 'PRE' and 'POST' intervention states. The visual is divided into four main sections: occlusal board graphics, global balance percentages, facial muscle activation indicators, and a quantitative index table. The occlusal board diagrams illustrate the dental arch with target points for the Masseter (MM) and Temporalis Anterior (TA) muscles. Flanking a 3D facial avatar are green vertical bar graphs representing the intensity of muscle contraction for the masseter and temporalis muscles bilaterally. A circular gauge shows a global neuromuscular balance score, which increases from 84% (PRE) to 90% (POST). The bottom table details functional indices including POC TA (Percentage Overlap Coefficient for Temporalis Anterior), POC MM (Masseter), BAR (Barycenter), and TORS (Torsion). Values highlighted in red, such as the initial BAR at 78.22%, indicate measurements falling outside the 'Normality' range (defined as 83-100% or 90-100% depending on the index). The image demonstrates clinical improvement in cranial neuromuscular symmetry and occlusal stability following treatment.
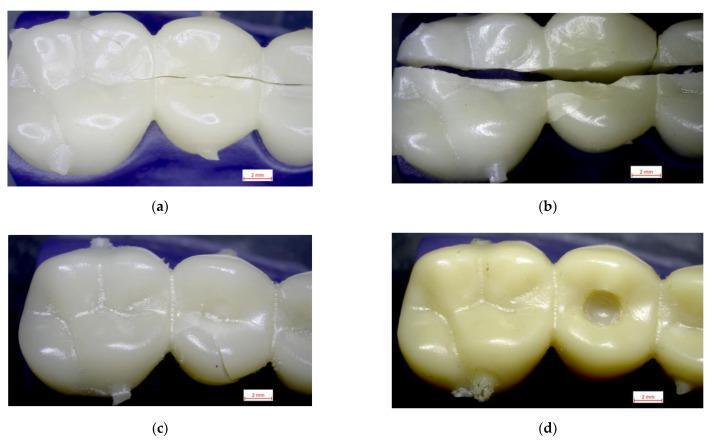
A comparison of fracture mechanics in dental restorative materials, presented through four intraoral-style photographs of prosthetic dental bridges (occlusal view). The images illustrate different material failure patterns under mechanical stress: (a) PMMA shows a longitudinal linear crack across the occlusal surfaces, characteristic of brittle failure. (b) Graphene-reinforced polymer (GRA) demonstrates a catastrophic failure, with a complete, sharp-edged fracture separating the prosthesis into two distinct segments. (c) Reinforced acrylic (RA) shows localized, non-linear micro-cracks on the occlusal table. (d) Polystyrene (PS) exhibits ductile behavior; instead of fracturing, the material shows significant plastic deformation and a central circular perforation from crushing force. The collection serves as an educational tool for dental biomaterials science, highlighting the clinical significance of fracture toughness and material deformation (brittle vs. ductile) in fixed prosthodontics.
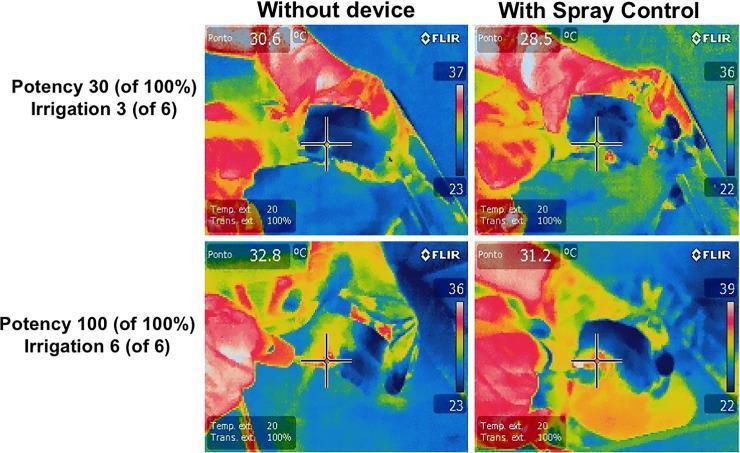
This diagnostic comparison chart utilizes FLIR thermal imaging to evaluate heat distribution and aerosol spread during dental procedures. The 2x2 grid compares temperatures 'Without device' (left) and 'With Spray Control' (right) across two settings: 'Potency 30/Irrigation 3' (top row) and 'Potency 100/Irrigation 6' (bottom row). The images depict a heat map overlay of the patient's face and neck, with a color scale ranging from approximately 22°C (blue) to 39°C (red/white). Centered crosshairs mark specific measurement points labeled as 'Ponto.' Visually, the 'With Spray Control' panels demonstrate a notable reduction in surface temperature and aerosol-related thermal dissipation compared to the 'Without device' panels. For example, at low potency, the temperature drops from 30.6°C to 28.5°C when the device is used. At maximum potency, the temperature is reduced from 32.8°C to 31.2°C. These thermal patterns provide evidence for the device's efficacy in managing water cooling spray and potential bio-aerosol dispersion during high-speed or ultrasonic dental instrument use, enhancing infection control and operator safety.
Coefficient of Thermal Expansion (CTE) in Dentistry
Definition
α = ΔL / (L₀ × ΔT)
CTE Values of Dental Materials vs. Human Teeth
| Material | CTE (× 10⁻⁶/°C) |
|---|---|
| Human teeth (enamel + dentin) | 8 - 15 |
| Ceramics | 8 - 14 |
| Glass ionomer cement | 10 - 11 |
| Gold alloys | 12 - 15 |
| Dental amalgam | 22 - 28 |
| Composites | 25 - 68 |
| Unfilled acrylics & sealants | 70 - 100 |
| Inlay wax | 300 - 1000 |
- Z-100 (highly filled hybrid): ~22.5 × 10⁻⁶/°C (closest to tooth)
- P-50: ~23.5 × 10⁻⁶/°C
- Herculite XR: ~32.6 × 10⁻⁶/°C
- Heliomolar: ~44.7 × 10⁻⁶/°C
Why CTE Matters Clinically
1. Microleakage and Percolation
- It can irritate the dental pulp
- It promotes recurrent (secondary) caries under the restoration
- It leads to marginal degradation over time
2. Restoration Failure - Cracking and Debonding
- Ceramic cracking or crazing
- Debonding of the porcelain from the metal framework
- This is why porcelain and alloys in PFM restorations must be matched in CTE
3. Wax Patterns in Casting
CTE Comparison Summary
| Material vs. Tooth | CTE Relationship | Clinical Impact |
|---|---|---|
| Gold alloys | ~Same (12-15 vs. 8-15) | Excellent marginal seal, minimal percolation |
| Ceramics | ~Same or slightly lower | Good seal; PFM requires careful matching |
| Glass ionomer | Very close (10-11) | Good biocompatibility |
| Amalgam | ~2-3× higher | Percolation initially; but corrosion products eventually seal margins over time |
| Composites | ~3-5× higher | Significant microleakage risk; high filler content reduces mismatch |
| Unfilled acrylics | ~5-7× higher | Poor marginal integrity; significant percolation |
Factors Affecting CTE of Dental Materials
- Filler content (composites): Higher filler loading (ceramic particles) reduces CTE significantly. Highly filled hybrids like Z-100 approach tooth-like values because ceramic fillers have lower CTE.
- Matrix type: Polymer matrices have inherently high CTE; ceramic and metallic matrices have low CTE.
- Temperature range: CTE is not uniform across all temperatures - it tends to increase as temperature rises and is generally higher in liquids than solids.
- Thermocycling history: Research shows CTE of composites decreases slightly with repeated thermocycling (p < 0.1), possibly due to additional post-cure polymerization.
Special Considerations
Amalgam - The Exception
- Corrosion products (tin/silver oxides) gradually fill the marginal gap over time
- This self-sealing effect reduces microleakage after the initial period
Dental Waxes
PFM and All-Ceramic Restorations
Key Takeaways
- Ideal restorative materials should have a CTE as close to natural tooth structure (8-15 × 10⁻⁶/°C) as possible.
- Gold alloys and ceramics match tooth CTE most closely among restorative materials.
- Composites have much higher CTEs than tooth, but heavily filled composites are substantially better than unfilled resins.
- CTE mismatch is the underlying mechanism behind microleakage, percolation, marginal degradation, and ceramic fracture.
- In fixed prosthodontics, matching the CTE between ceramic and alloy is a critical requirement for long-term success.
Glass transition temperature
glass transition temperature dentistry dental materials Tg clinical significance composites polymers
https://www.intechopen.com/chapters/16729
Glass Transition Temperature (Tg) in Dentistry
Definition
Tg and Oral Cavity Temperatures
Any dental polymer must have a Tg above the maximum intraoral temperature (~60°C) to maintain its mechanical properties in service.
- Bis-GMA, TEGDMA, and UDMA-based resins have Tg values of approximately 35-47°C (for the resins alone)
- Commercial composites (Z-100, Filtek Z-250, etc.) show Tg around 40-45°C - dangerously close to or within the oral temperature range if not adequately cured
- Orthodontic composites (Transbond XT, Ortho Lite Cure) when properly cured achieve Tg of ~363-387 K (~90-114°C), which is safely above oral temperatures
Factors That Affect Tg in Dental Composites
1. Degree of Conversion (DC)
2. Light-Curing Parameters
- Exposure time: Longer exposure increases Tg, especially for lightly filled composites with lower-power light sources. For example, Fill Magic composite required 120 seconds at lower power density to achieve an adequate Tg.
- Power density (irradiance): Higher irradiance generally increases DC and thus Tg more rapidly, but excessive irradiance can paradoxically reduce DC in some systems due to oxygen inhibition or thermal degradation.
- Energy density (irradiance × time): A minimum energy density (e.g., ~4.68-6.24 J/cm²) is required for adequate Tg in some orthodontic composites.
3. Filler Content
4. Monomer Chemistry
- Cross-linking monomers (Bis-GMA, UDMA) increase Tg by creating a rigid network
- Diluent monomers (TEGDMA, HEMA) increase mobility and lower Tg somewhat
- Chain stiffness, bulky side groups, and intermolecular interactions all raise Tg
5. Water Sorption
6. Thermocycling
Tg of Specific Dental Materials
| Material | Tg (approximate) | Notes |
|---|---|---|
| PMMA (denture base acrylic) | ~100-105°C | Well above oral temps; good dimensional stability |
| Bis-GMA resin (pure) | ~110-120°C | High Tg due to rigid biphenyl backbone |
| TEGDMA (pure) | ~-10 to 50°C | Low Tg; used as diluent monomer |
| UDMA resin (pure) | ~55-100°C | Moderate Tg |
| Light-cured composites (cured) | ~40-120°C | Varies widely with DC and filler load |
| Orthodontic composites (properly cured) | ~90-114°C | Safe for oral use |
| Dental waxes | Low (-10 to 40°C) | Tg and softening point relevant for intraoral temp sensitivity |
| PEEK (prosthodontic use) | ~143°C | High performance polymer; well above oral temps |
Relationship Between Tg and CTE
- Below Tg: lower CTE (more tooth-like behavior)
- Above Tg: CTE increases sharply, worsening the mismatch with tooth structure
- A composite operating at or near its Tg in vivo will show erratic dimensional changes with temperature
Measurement Methods
- DSC (Differential Scanning Calorimetry) - detects the heat capacity change at Tg
- DMA (Dynamic Mechanical Analysis) - detects the drop in storage modulus at Tg; often considered the most accurate for cross-linked networks
- TMA (Thermomechanical Analysis) - detects the change in CTE at Tg
Clinical Relevance Summary
| If Tg is... | Clinical consequence |
|---|---|
| Well above 60°C | Material maintains hardness, wear resistance, dimensional stability in service |
| Near oral temperature range | Material softens under hot beverages; reduced wear resistance; increased creep |
| Below body temperature | Immediate failure; material is rubbery at room/oral temp |
| Lowered by inadequate curing | Reduced strength, increased solubility, greater water sorption, toxicity risk from unreacted monomers |
| Lowered by water plasticization | Long-term property degradation of resins and denture bases |