
I am going to give you some topics . Give me SAQ type answers on them that I can write in my university exam of first year mbbs and also include diagrams if required
Angina pectoris , myocardial infarction, ejection fraction, stroke volume, exercise physiology [cardiovascular]
pressure volume loop cardiac cycle diagram ejection fraction
ECG changes in myocardial infarction ST elevation
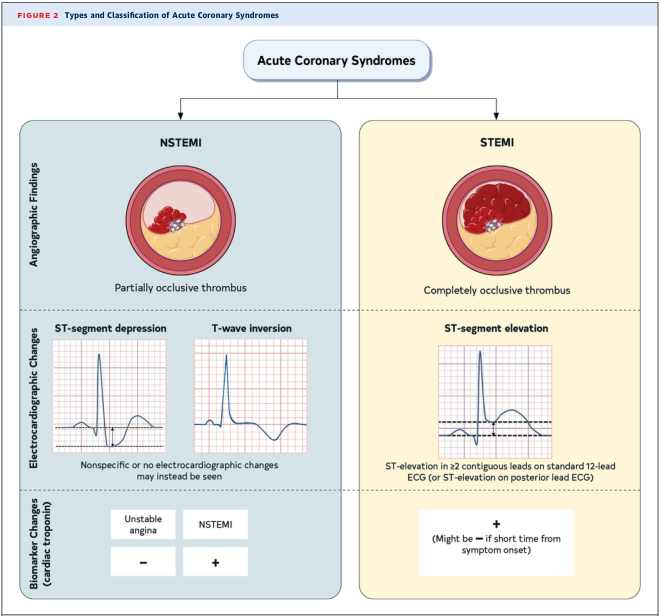
Summary : This figure presents the types and classification of Acute Coronary Syndromes, contrasting NSTEMI (Non-ST-Elevation Myocardial Infarction) and STEMI (ST-Elevation Myocardial Infarction) based on angiographic findings, electrocardiographic changes, and cardiac biomarker changes.
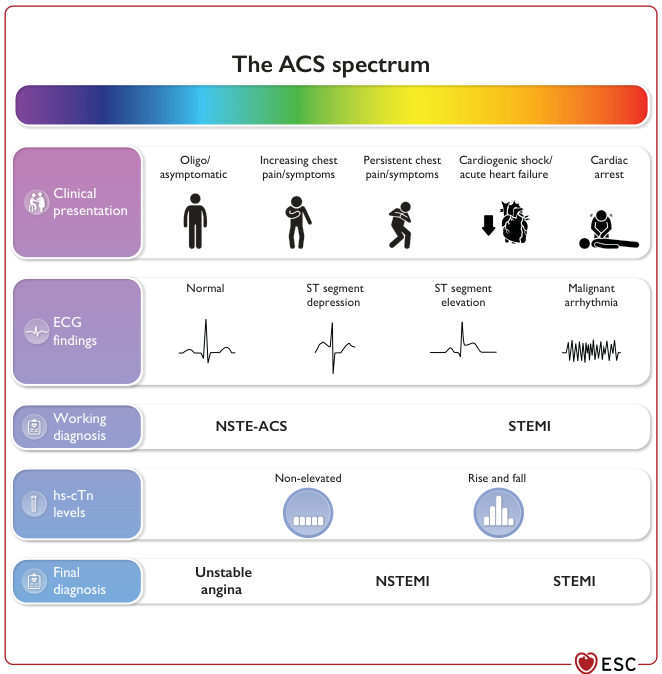
Summary : This figure illustrates the spectrum of Acute Coronary Syndromes (ACS), detailing the progression from mild or asymptomatic presentations to severe outcomes such as cardiac arrest. It organizes ACS into clinical presentation, ECG findings, working diagnosis, high-sensitivity cardiac troponin (hs-cTn) levels, and final diagnosis, showing how these elements interrelate across the ACS continuum.
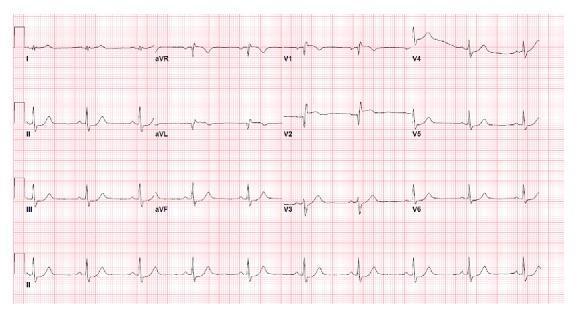
A 12-lead electrocardiogram (ECG) printed on standard grid paper demonstrating acute ST-segment changes consistent with myocardial ischemia or infarction. The tracing shows sinus bradycardia with a heart rate of approximately 56 beats per minute. Primary abnormalities include significant ST-segment elevation in the septal leads (V1, V2) and the high lateral lead (aVL). Corresponding reciprocal ST-segment depression is visible in the inferior leads (II, III, and aVF) as well as the lateral precordial leads (V5 and V6). The morphology of the ST elevation in V1-V2 is indicative of an acute anteroseptal injury pattern. This ECG serves as an educational example of how traumatic cardiac contusion or coronary artery occlusion can present with classic ST-elevation myocardial infarction (STEMI) patterns, requiring urgent clinical correlation with echocardiography and potentially cardiac catheterization.
Frank-Starling law cardiac output venous return graph
Wiggers diagram left ventricular pressure volume changes during cardiac cycle
coronary artery atherosclerotic plaque rupture thrombosis diagram
cardiac output heart rate stroke volume during graded exercise graph
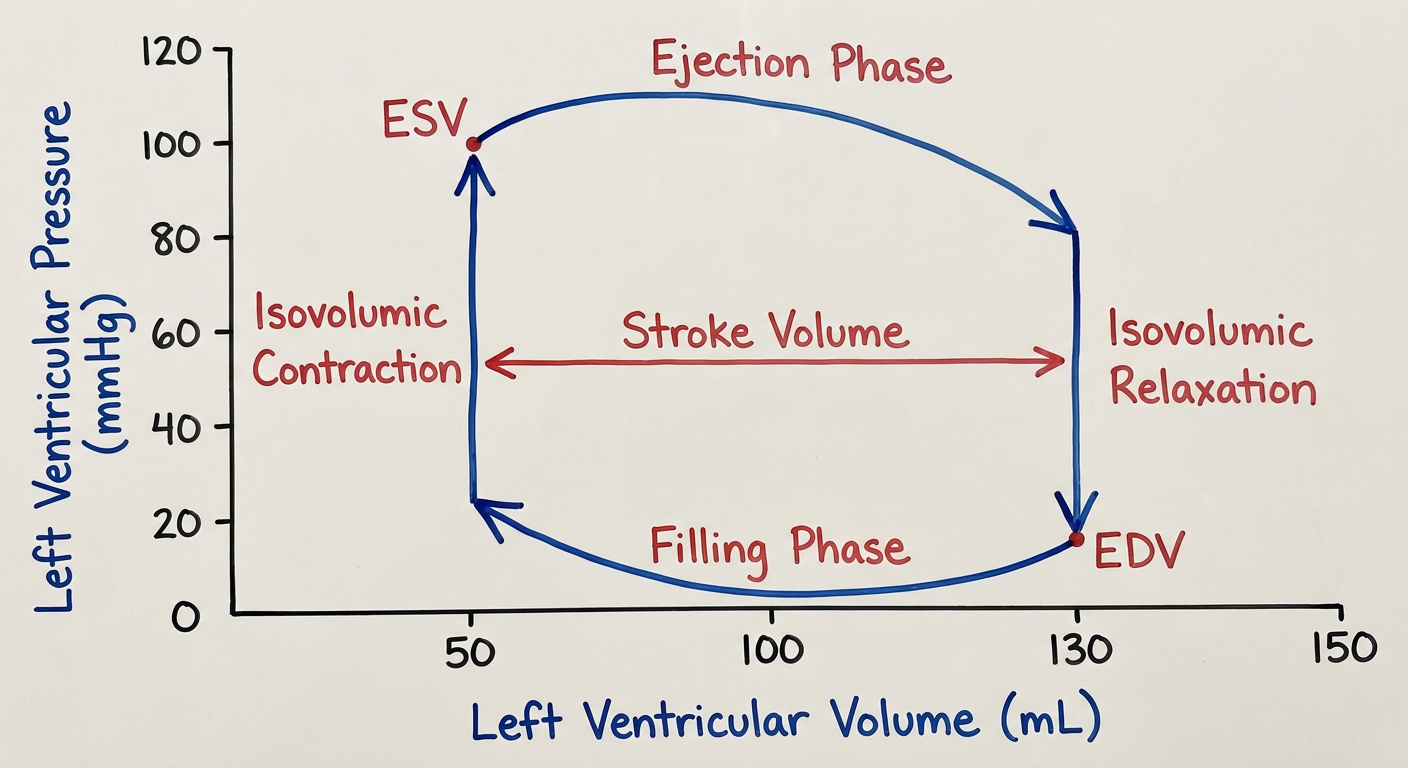
A simple labeled physiology diagram of the left ventricular pressure-volume loop across one cardiac cycle, showing end-diastolic volume (EDV), end-systolic volume (ESV), stroke volume as the horizontal distance between EDV and ESV, isovolumic contraction, ejection phase, isovolumic relaxation, and filling phase, with axes labeled Left Ventricular Volume (mL) on x-axis and Left Ventricular Pressure (mmHg) on y-axis
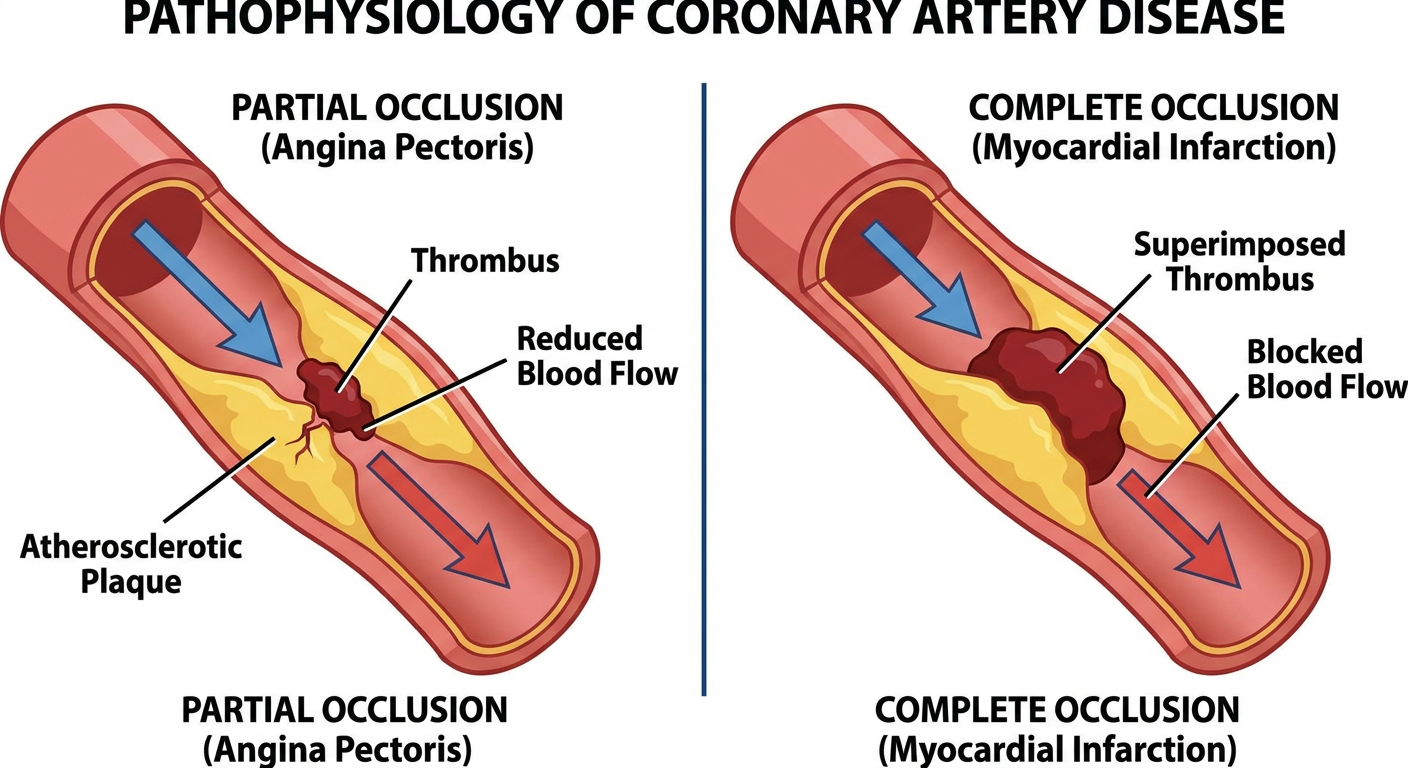
A simple labeled medical diagram showing a coronary artery cross-section with atherosclerotic plaque, plaque rupture, and superimposed thrombus formation causing partial versus complete occlusion, illustrating the pathophysiology of angina pectoris and myocardial infarction
Cardiovascular SAQs - First Year MBBS
1. Angina Pectoris
- Stable (Typical) angina - predictable, episodic chest pain on exertion or increased demand (e.g., tachycardia); crushing/squeezing substernal pain radiating to left arm/jaw; relieved by rest or nitroglycerin.
- Prinzmetal (Variant) angina - occurs at rest, due to coronary artery vasospasm (can affect even normal vessels); responds to nitrates/calcium channel blockers.
- Unstable angina - increasing frequency/severity, occurs with less exertion or at rest; caused by plaque disruption with superimposed thrombosis, distal embolization, or vasospasm. Often shows evidence of myocyte injury - considered part of acute coronary syndrome, needs aggressive treatment.
2. Myocardial Infarction (MI)
- Atheromatous plaque erosion/disruption (endothelial injury, intraplaque hemorrhage, mechanical stress) exposes subendothelial collagen and necrotic plaque contents.
- Platelets adhere, aggregate, and release thromboxane A2, ADP, serotonin → further aggregation and vasospasm.
- Tissue factor exposure activates coagulation cascade, adding to the thrombus.
- Within minutes, the enlarging thrombus completely occludes the coronary lumen.
- Seconds: aerobic metabolism ceases → ATP falls, lactic acid accumulates.
- Minutes: rapid loss of contractility (reversible if flow restored).
- 20-40 minutes of persistent ischemia: irreversible injury → coagulative necrosis.
- Earliest detectable feature of necrosis: disruption of sarcolemmal membrane integrity → leakage of intracellular macromolecules (cardiac troponins, CK-MB) into interstitium and blood - basis of biomarker diagnosis.
| Feature | Angina | MI |
|---|---|---|
| Ischemia duration | Transient (minutes) | Prolonged (>20-40 min) |
| Myocyte necrosis | Absent | Present |
| Cardiac biomarkers | Normal | Elevated (troponin, CK-MB) |
| Reversibility | Fully reversible | Irreversible damage |
3. Stroke Volume (SV)
Stroke Volume = End-Diastolic Volume (EDV) - End-Systolic Volume (ESV)
- EDV = volume in ventricle just before ejection (~140 mL)
- ESV = volume remaining after ejection (~70 mL)
- Normal SV ≈ 70 mL
- Preload - left ventricular EDV/fiber length; governed by the Frank-Starling relationship (greater venous return → greater EDV → greater force of contraction, on the ascending limb of the length-tension curve).
- Afterload - resistance the ventricle must overcome to eject blood (approximated by aortic pressure); velocity of shortening is maximal when afterload is zero and decreases as afterload rises.
- Contractility - intrinsic force of contraction independent of preload/afterload (affected by sympathetic stimulation, catecholamines).
4. Ejection Fraction (EF)
Ejection Fraction = Stroke Volume / End-Diastolic Volume
- Normal EF ≈ 0.55 (55%)
- ↑ EF = ↑ contractility; ↓ EF = ↓ contractility (e.g., in heart failure with reduced EF, EF may fall below 40%)
5. Exercise Physiology (Cardiovascular Changes)
-
Muscle blood flow: Increases dramatically - up to ~25-fold in a well-trained athlete during maximal exercise (from ~3.6 to ~90 mL/100g muscle/min). About half of this increase is due to local metabolic vasodilation (released vasodilator metabolites from active muscle); the rest is from a rise in arterial blood pressure (~30% increase) which increases flow and stretches arteriolar walls, further reducing resistance.
-
Cardiac output: Rises linearly with work output and O2 consumption, because increased O2 consumption dilates muscle vasculature → increased venous return → increased cardiac output (Frank-Starling mechanism contributes along with sympathetic stimulation).
- Cardiac Output = Stroke Volume × Heart Rate
- Both heart rate and stroke volume increase with exercise intensity (heart rate rises more steeply at higher workloads, while stroke volume plateaus earlier).
-
Note on contraction and flow: Rhythmic muscle contraction itself transiently reduces blood flow to the contracting muscle (compression of intramuscular vessels), with flow being higher between contractions than during them - relevant to why sustained tonic (static) contraction causes rapid fatigue.
-
Vo2 max: Maximum oxygen consumption is the ceiling for aerobic exercise capacity, and is used to gauge cardiovascular fitness; reduced in deconditioning or after illness (e.g., post-COVID exercise intolerance).
-
Thermoregulatory link: Since most metabolic energy becomes heat (muscle efficiency only 20-25%), prolonged exercise raises core temperature; failure of heat dissipation can cause heatstroke - relevant because cardiovascular system (skin vasodilation, increased cardiac output) is central to heat loss during exercise.
Quick revision summary (for last-minute recall)
- Angina = reversible ischemia, no necrosis, 3 types (stable/Prinzmetal/unstable)
- MI = irreversible necrosis from thrombotic coronary occlusion, diagnosed by ECG + biomarkers
- SV = EDV - ESV (normal ~70 mL)
- EF = SV/EDV (normal ~55%)
- Exercise: CO ↑ (SV↑ + HR↑), muscle blood flow ↑ up to 25x, driven by local metabolites + ↑BP
Yeah, so I have my physiology university exams, first year MBBS exams in a few days and, uhhh... Like, I have to study. So I'm giving you some SAQ, uh, short answer type and long answer type questions, and explain them to me in a very nice, uh, like, elaborate way and in easy words, simple words, so that I can remember them easily. And, uh, mmm, yeah, like, because I'm studying them right now. Okay. So we have gastrointestinal physiology right now. Topic for short answer type questions are functions and composition of saliva, regulation of salivary secretion, deglutition reflex, then functions and mechanism of secretion of HCl by parietal cells, and factors regulating secretion. Next is peptic ulcer, its etiology and treatment. Then, uh, functions of bile salts and its composition. Then, uh, defecation reflex. Then, enumerate hormones of GIT. Then, a note on gastrin, note on CCK, uh, regulation of gastric motility, and achalasia cardia. And then the topics for long answer type questions are deglutition, gastric glands, enumerate secretion and function. Then, gastric juice, its composition, and then pancreatic juice, its composition. Function and regulation. So, like, uh, they are, in sec- the length should be accordingly for the short type and long type. Um, but yeah, you should explain them to me nicely because I'm sort of studying it for the first time. Like, yeah. And, um... Yeah. Give me, provide me all of this thing in one PDF form. Okay. And, uh, like, in the beginning, explain them really nicely. And at the end, give me, like, very short, very short, concise notes of all these, like, sort of a cheat sheet, you could say, or, like, z- one-page notes, something like that, at the end of the PDF. So that on the, mm, like, a day before the paper, I can read them.
- Saliva & Deglutition - composition/functions of saliva, regulation of salivary secretion, deglutition reflex (SAQ), deglutition in detail (LAQ)
- Gastric secretion (HCl) & related disorders - parietal cell HCl secretion mechanism + regulating factors, gastric glands (secretions/functions, LAQ), gastric juice composition (LAQ), peptic ulcer etiology/treatment, achalasia cardia, regulation of gastric motility
- GI hormones - enumeration of GIT hormones, note on gastrin, note on CCK
- Bile & Pancreatic juice - functions/composition of bile salts, pancreatic juice composition/function/regulation (LAQ)
- Defecation reflex
Which topic cluster should we go deep into first?
1. Angina Pectoris
- Stable (Typical) angina - predictable, episodic chest pain on exertion or increased demand (e.g., tachycardia); crushing/squeezing substernal pain radiating to left arm/jaw; relieved by rest or nitroglycerin.
- Prinzmetal (Variant) angina - occurs at rest, due to coronary artery vasospasm (can affect even normal vessels); responds to nitrates/calcium channel blockers.
- Unstable angina - increasing frequency/severity, occurs with less exertion or at rest; caused by plaque disruption with superimposed thrombosis, distal embolization, or vasospasm. Often shows evidence of myocyte injury - considered part of acute coronary syndrome, needs aggressive treatment.
2. Myocardial Infarction (MI)
- Atheromatous plaque erosion/disruption (endothelial injury, intraplaque hemorrhage, mechanical stress) exposes subendothelial collagen and necrotic plaque contents.
- Platelets adhere, aggregate, and release thromboxane A2, ADP, serotonin → further aggregation and vasospasm.
- Tissue factor exposure activates coagulation cascade, adding to the thrombus.
- Within minutes, the enlarging thrombus completely occludes the coronary lumen.
- Seconds: aerobic metabolism ceases → ATP falls, lactic acid accumulates.
- Minutes: rapid loss of contractility (reversible if flow restored).
- 20-40 minutes of persistent ischemia: irreversible injury → coagulative necrosis.
- Earliest detectable feature of necrosis: disruption of sarcolemmal membrane integrity → leakage of intracellular macromolecules (cardiac troponins, CK-MB) into interstitium and blood - basis of biomarker diagnosis.
| Feature | Angina | MI |
|---|---|---|
| Ischemia duration | Transient (minutes) | Prolonged (>20-40 min) |
| Myocyte necrosis | Absent | Present |
| Cardiac biomarkers | Normal | Elevated (troponin, CK-MB) |
| Reversibility | Fully reversible | Irreversible damage |
3. Stroke Volume (SV)
Stroke Volume = End-Diastolic Volume (EDV) - End-Systolic Volume (ESV)
- EDV = volume in ventricle just before ejection (~140 mL)
- ESV = volume remaining after ejection (~70 mL)
- Normal SV ≈ 70 mL
- Preload - left ventricular EDV/fiber length; governed by the Frank-Starling relationship (greater venous return → greater EDV → greater force of contraction, on the ascending limb of the length-tension curve).
- Afterload - resistance the ventricle must overcome to eject blood (approximated by aortic pressure); velocity of shortening is maximal when afterload is zero and decreases as afterload rises.
- Contractility - intrinsic force of contraction independent of preload/afterload (affected by sympathetic stimulation, catecholamines).
4. Ejection Fraction (EF)
Ejection Fraction = Stroke Volume / End-Diastolic Volume
- Normal EF ≈ 0.55 (55%)
- ↑ EF = ↑ contractility; ↓ EF = ↓ contractility (e.g., in heart failure with reduced EF, EF may fall below 40%)
5. Exercise Physiology (Cardiovascular Changes)
-
Muscle blood flow: Increases dramatically - up to ~25-fold in a well-trained athlete during maximal exercise (from ~3.6 to ~90 mL/100g muscle/min). About half of this increase is due to local metabolic vasodilation (released vasodilator metabolites from active muscle); the rest is from a rise in arterial blood pressure (~30% increase) which increases flow and stretches arteriolar walls, further reducing resistance.
-
Cardiac output: Rises linearly with work output and O2 consumption, because increased O2 consumption dilates muscle vasculature → increased venous return → increased cardiac output (Frank-Starling mechanism contributes along with sympathetic stimulation).
- Cardiac Output = Stroke Volume × Heart Rate
- Both heart rate and stroke volume increase with exercise intensity (heart rate rises more steeply at higher workloads, while stroke volume plateaus earlier).
-
Note on contraction and flow: Rhythmic muscle contraction itself transiently reduces blood flow to the contracting muscle (compression of intramuscular vessels), with flow being higher between contractions than during them - relevant to why sustained tonic (static) contraction causes rapid fatigue.
-
Vo2 max: Maximum oxygen consumption is the ceiling for aerobic exercise capacity, and is used to gauge cardiovascular fitness; reduced in deconditioning or after illness (e.g., post-COVID exercise intolerance).
-
Thermoregulatory link: Since most metabolic energy becomes heat (muscle efficiency only 20-25%), prolonged exercise raises core temperature; failure of heat dissipation can cause heatstroke - relevant because cardiovascular system (skin vasodilation, increased cardiac output) is central to heat loss during exercise.
Quick revision summary (for last-minute recall)
- Angina = reversible ischemia, no necrosis, 3 types (stable/Prinzmetal/unstable)
- MI = irreversible necrosis from thrombotic coronary occlusion, diagnosed by ECG + biomarkers
- SV = EDV - ESV (normal ~70 mL)
- EF = SV/EDV (normal ~55%)
- Exercise: CO ↑ (SV↑ + HR↑), muscle blood flow ↑ up to 25x, driven by local metabolites + ↑BP
- Saliva & Deglutition - composition/functions of saliva, regulation of salivary secretion, deglutition reflex (SAQ), deglutition in detail (LAQ)
- Gastric secretion (HCl) & related disorders - parietal cell HCl secretion mechanism + regulating factors, gastric glands (secretions/functions, LAQ), gastric juice composition (LAQ), peptic ulcer etiology/treatment, achalasia cardia, regulation of gastric motility
- GI hormones - enumeration of GIT hormones, note on gastrin, note on CCK
- Bile & Pancreatic juice - functions/composition of bile salts, pancreatic juice composition/function/regulation (LAQ)
- Defecation reflex
I want you to provide me a PDF which contains, uh, the notes on all the topics that I have given you above. Like in that SAQ and LAQ form, I want them and at the end provide me very, very short concise notes, uh, like ch-- uh, cheat sheet or one page notes of them so that I can review them a day before. No, provide-- give me a PDF of all the topics that I have, mm, just listed.
You have an exam in a few days and want all 16 topics in one PDF. I can do this two ways:
1. Angina Pectoris
- Stable (Typical) angina - predictable, episodic chest pain on exertion or increased demand (e.g., tachycardia); crushing/squeezing substernal pain radiating to left arm/jaw; relieved by rest or nitroglycerin.
- Prinzmetal (Variant) angina - occurs at rest, due to coronary artery vasospasm (can affect even normal vessels); responds to nitrates/calcium channel blockers.
- Unstable angina - increasing frequency/severity, occurs with less exertion or at rest; caused by plaque disruption with superimposed thrombosis, distal embolization, or vasospasm. Often shows evidence of myocyte injury - considered part of acute coronary syndrome, needs aggressive treatment.
2. Myocardial Infarction (MI)
- Atheromatous plaque erosion/disruption (endothelial injury, intraplaque hemorrhage, mechanical stress) exposes subendothelial collagen and necrotic plaque contents.
- Platelets adhere, aggregate, and release thromboxane A2, ADP, serotonin → further aggregation and vasospasm.
- Tissue factor exposure activates coagulation cascade, adding to the thrombus.
- Within minutes, the enlarging thrombus completely occludes the coronary lumen.
- Seconds: aerobic metabolism ceases → ATP falls, lactic acid accumulates.
- Minutes: rapid loss of contractility (reversible if flow restored).
- 20-40 minutes of persistent ischemia: irreversible injury → coagulative necrosis.
- Earliest detectable feature of necrosis: disruption of sarcolemmal membrane integrity → leakage of intracellular macromolecules (cardiac troponins, CK-MB) into interstitium and blood - basis of biomarker diagnosis.
| Feature | Angina | MI |
|---|---|---|
| Ischemia duration | Transient (minutes) | Prolonged (>20-40 min) |
| Myocyte necrosis | Absent | Present |
| Cardiac biomarkers | Normal | Elevated (troponin, CK-MB) |
| Reversibility | Fully reversible | Irreversible damage |
3. Stroke Volume (SV)
Stroke Volume = End-Diastolic Volume (EDV) - End-Systolic Volume (ESV)
- EDV = volume in ventricle just before ejection (~140 mL)
- ESV = volume remaining after ejection (~70 mL)
- Normal SV ≈ 70 mL
- Preload - left ventricular EDV/fiber length; governed by the Frank-Starling relationship (greater venous return → greater EDV → greater force of contraction, on the ascending limb of the length-tension curve).
- Afterload - resistance the ventricle must overcome to eject blood (approximated by aortic pressure); velocity of shortening is maximal when afterload is zero and decreases as afterload rises.
- Contractility - intrinsic force of contraction independent of preload/afterload (affected by sympathetic stimulation, catecholamines).
4. Ejection Fraction (EF)
Ejection Fraction = Stroke Volume / End-Diastolic Volume
- Normal EF ≈ 0.55 (55%)
- ↑ EF = ↑ contractility; ↓ EF = ↓ contractility (e.g., in heart failure with reduced EF, EF may fall below 40%)
5. Exercise Physiology (Cardiovascular Changes)
-
Muscle blood flow: Increases dramatically - up to ~25-fold in a well-trained athlete during maximal exercise (from ~3.6 to ~90 mL/100g muscle/min). About half of this increase is due to local metabolic vasodilation (released vasodilator metabolites from active muscle); the rest is from a rise in arterial blood pressure (~30% increase) which increases flow and stretches arteriolar walls, further reducing resistance.
-
Cardiac output: Rises linearly with work output and O2 consumption, because increased O2 consumption dilates muscle vasculature → increased venous return → increased cardiac output (Frank-Starling mechanism contributes along with sympathetic stimulation).
- Cardiac Output = Stroke Volume × Heart Rate
- Both heart rate and stroke volume increase with exercise intensity (heart rate rises more steeply at higher workloads, while stroke volume plateaus earlier).
-
Note on contraction and flow: Rhythmic muscle contraction itself transiently reduces blood flow to the contracting muscle (compression of intramuscular vessels), with flow being higher between contractions than during them - relevant to why sustained tonic (static) contraction causes rapid fatigue.
-
Vo2 max: Maximum oxygen consumption is the ceiling for aerobic exercise capacity, and is used to gauge cardiovascular fitness; reduced in deconditioning or after illness (e.g., post-COVID exercise intolerance).
-
Thermoregulatory link: Since most metabolic energy becomes heat (muscle efficiency only 20-25%), prolonged exercise raises core temperature; failure of heat dissipation can cause heatstroke - relevant because cardiovascular system (skin vasodilation, increased cardiac output) is central to heat loss during exercise.
Quick revision summary (for last-minute recall)
- Angina = reversible ischemia, no necrosis, 3 types (stable/Prinzmetal/unstable)
- MI = irreversible necrosis from thrombotic coronary occlusion, diagnosed by ECG + biomarkers
- SV = EDV - ESV (normal ~70 mL)
- EF = SV/EDV (normal ~55%)
- Exercise: CO ↑ (SV↑ + HR↑), muscle blood flow ↑ up to 25x, driven by local metabolites + ↑BP
- Saliva & Deglutition - composition/functions of saliva, regulation of salivary secretion, deglutition reflex (SAQ), deglutition in detail (LAQ)
- Gastric secretion (HCl) & related disorders - parietal cell HCl secretion mechanism + regulating factors, gastric glands (secretions/functions, LAQ), gastric juice composition (LAQ), peptic ulcer etiology/treatment, achalasia cardia, regulation of gastric motility
- GI hormones - enumeration of GIT hormones, note on gastrin, note on CCK
- Bile & Pancreatic juice - functions/composition of bile salts, pancreatic juice composition/function/regulation (LAQ)
- Defecation reflex
diagram of three stages of swallowing deglutition oral pharyngeal esophageal
structure of gastric gland showing mucous neck cells parietal cells chief cells
parietal cell hydrochloric acid secretion mechanism proton pump diagram
defecation reflex diagram rectum anal sphincter
A clear educational diagram showing the three stages of swallowing (deglutition): oral/buccal stage with tongue pushing bolus, pharyngeal stage with soft palate elevation and epiglottis covering larynx, and esophageal stage with peristaltic wave pushing bolus toward stomach through lower esophageal sphincter
A labeled cross-section diagram of a gastric gland in the stomach fundus showing surface mucous cells at the gastric pit, mucous neck cells, parietal (oxyntic) cells, chief (peptic) cells, and enteroendocrine G cells at the base of the gland
A simple labeled diagram of a parietal cell showing the mechanism of hydrochloric acid secretion, including carbonic anhydrase converting CO2 and water to carbonic acid, H+/K+ ATPase proton pump secreting H+ into the canaliculus in exchange for K+, chloride channel secreting Cl- ions, and the HCO3-/Cl- exchanger on the basolateral membrane
A simple labeled diagram of the defecation reflex arc showing the rectum, internal and external anal sphincters, sensory nerve fibers going to the sacral spinal cord, and parasympathetic motor fibers returning to cause rectal contraction and sphincter relaxation
mkdir -p /tmp/workspace/gi-physiology-notes/assets && ls -la /tmp/workspace/
cd /tmp/workspace/gi-physiology-notes/assets && curl -sL -o deglutition.png "https://cdn.orris.care/image-gen/dd1fc8573e114e8cad6c2e531f3beddf.png" && curl -sL -o gastric_gland.png "https://cdn.orris.care/image-gen/27b51f3837f74f35801ee79256b099ac.png" && curl -sL -o parietal_cell.png "https://cdn.orris.care/image-gen/1adae4b95a91408786d8ccb48b630018.png" && curl -sL -o defecation.png "https://cdn.orris.care/image-gen/3b921ca9b2a34b35973f682bc59fb0ea.png" && ls -la
mkdir -p /tmp/workspace/gi-physiology-notes/assets && cd /tmp/workspace/gi-physiology-notes/assets && curl -sL -o deglutition.png "https://cdn.orris.care/image-gen/dd1fc8573e114e8cad6c2e531f3beddf.png" && curl -sL -o gastric_gland.png "https://cdn.orris.care/image-gen/27b51f3837f74f35801ee79256b099ac.png" && curl -sL -o parietal_cell.png "https://cdn.orris.care/image-gen/1adae4b95a91408786d8ccb48b630018.png" && curl -sL -o defecation.png "https://cdn.orris.care/image-gen/3b921ca9b2a34b35973f682bc59fb0ea.png" && ls -la
~/gi-physiology-notes/build_pdf.py
#!/usr/bin/env python3
# -*- coding: utf-8 -*-
"""
Builds GI_Physiology_MBBS_Notes.pdf
First year MBBS - GI Physiology SAQ/LAQ notes + cheat sheet
"""
import os
from reportlab.lib.pagesizes import A4
from reportlab.lib.units import cm
from reportlab.lib import colors
from reportlab.platypus import (
SimpleDocTemplate, Paragraph, Spacer, Table, TableStyle,
Image, PageBreak, ListFlowable, ListItem, HRFlowable, KeepTogether
)
from reportlab.lib.styles import getSampleStyleSheet, ParagraphStyle
from reportlab.lib.enums import TA_CENTER, TA_LEFT, TA_JUSTIFY
BASE = os.path.dirname(os.path.abspath(__file__))
ASSETS = os.path.join(BASE, "assets")
OUT = os.path.join(BASE, "GI_Physiology_MBBS_Notes.pdf")
styles = getSampleStyleSheet()
title_style = ParagraphStyle("TitleBig", parent=styles["Title"], fontSize=22, spaceAfter=6, textColor=colors.HexColor("#1a4d8f"))
subtitle_style = ParagraphStyle("Subtitle", parent=styles["Normal"], fontSize=12, alignment=TA_CENTER, textColor=colors.HexColor("#444444"), spaceAfter=20)
part_style = ParagraphStyle("Part", parent=styles["Heading1"], fontSize=18, textColor=colors.white, backColor=colors.HexColor("#1a4d8f"),
spaceAfter=14, spaceBefore=6, leftIndent=6, borderPadding=(8,8,8,8))
q_style = ParagraphStyle("Question", parent=styles["Heading2"], fontSize=14, textColor=colors.HexColor("#1a4d8f"),
spaceBefore=16, spaceAfter=8, borderWidth=0, leftIndent=0)
sub_style = ParagraphStyle("Sub", parent=styles["Heading3"], fontSize=11.5, textColor=colors.HexColor("#c0392b"),
spaceBefore=8, spaceAfter=4)
body_style = ParagraphStyle("Body", parent=styles["Normal"], fontSize=10.3, leading=14.5, alignment=TA_JUSTIFY, spaceAfter=6)
bullet_style = ParagraphStyle("Bullet", parent=body_style, leftIndent=14, bulletIndent=4, spaceAfter=3)
caption_style = ParagraphStyle("Caption", parent=styles["Normal"], fontSize=9, alignment=TA_CENTER, textColor=colors.HexColor("#555555"), spaceAfter=10, spaceBefore=2, italic=True)
cheat_head = ParagraphStyle("CheatHead", parent=styles["Heading3"], fontSize=11, textColor=colors.white, backColor=colors.HexColor("#c0392b"), spaceBefore=8, spaceAfter=4, leftIndent=4, borderPadding=(4,4,4,4))
cheat_body = ParagraphStyle("CheatBody", parent=styles["Normal"], fontSize=8.6, leading=11.2, spaceAfter=3)
story = []
def H(text):
story.append(Paragraph(text, q_style))
def SH(text):
story.append(Paragraph(text, sub_style))
def P(text):
story.append(Paragraph(text, body_style))
def BUL(items):
flow = ListFlowable(
[ListItem(Paragraph(it, bullet_style), bulletColor=colors.HexColor("#1a4d8f")) for it in items],
bulletType='bullet', start='circle', leftIndent=16
)
story.append(flow)
story.append(Spacer(1, 4))
def NUM(items):
flow = ListFlowable(
[ListItem(Paragraph(it, bullet_style)) for it in items],
bulletType='1', leftIndent=18
)
story.append(flow)
story.append(Spacer(1, 4))
def IMG(fname, caption, width=11*cm):
path = os.path.join(ASSETS, fname)
if os.path.exists(path):
img = Image(path, width=width, height=width*0.62)
story.append(Spacer(1,4))
story.append(img)
story.append(Paragraph(caption, caption_style))
def TBL(header, rows, col_widths=None):
data = [header] + rows
t = Table(data, colWidths=col_widths, repeatRows=1)
t.setStyle(TableStyle([
("BACKGROUND", (0,0), (-1,0), colors.HexColor("#1a4d8f")),
("TEXTCOLOR", (0,0), (-1,0), colors.white),
("FONTSIZE", (0,0), (-1,-1), 8.7),
("FONTNAME", (0,0), (-1,0), "Helvetica-Bold"),
("GRID", (0,0), (-1,-1), 0.5, colors.grey),
("VALIGN", (0,0), (-1,-1), "TOP"),
("ROWBACKGROUNDS", (0,1), (-1,-1), [colors.white, colors.HexColor("#eef3fa")]),
("TOPPADDING", (0,0), (-1,-1), 4),
("BOTTOMPADDING", (0,0), (-1,-1), 4),
]))
story.append(t)
story.append(Spacer(1,8))
def PART(text):
story.append(PageBreak())
story.append(Paragraph(text, part_style))
story.append(Spacer(1,10))
def HR():
story.append(HRFlowable(width="100%", thickness=0.7, color=colors.HexColor("#cccccc"), spaceBefore=6, spaceAfter=10))
# ============ COVER ============
story.append(Spacer(1, 3*cm))
story.append(Paragraph("Gastrointestinal Physiology", title_style))
story.append(Paragraph("First Year MBBS | SAQ & LAQ Exam Notes with One-Page Cheat Sheet", subtitle_style))
story.append(Spacer(1, 1*cm))
story.append(Paragraph(
"How to use this document: Part A covers all Short Answer Questions (SAQs) with concise, exam-ready explanations. "
"Part B covers the Long Answer Questions (LAQs) in full detail with diagrams. "
"Part C, at the very end, is a one-page dense cheat sheet -- read that the night before your exam to refresh everything quickly. "
"Each topic starts with a plain-language explanation before the exam-style points, so read it once slowly to understand, then revise using the bold points and tables.",
ParagraphStyle("Intro", parent=body_style, fontSize=10.5, textColor=colors.HexColor("#333333"))
))
# ================= PART A : SAQs =================
PART("PART A - Short Answer Questions (SAQs)")
# ---- 1. Saliva composition & function ----
H("1. Functions and Composition of Saliva")
P("Saliva is the watery secretion of the salivary glands that mixes with food in the mouth. Think of it as the body's first digestive fluid -- it is mostly water but carries a few very important ingredients that start digestion, protect the mouth, and make swallowing possible.")
SH("Composition of Saliva")
BUL([
"Produced by 3 paired major glands - <b>parotid</b> (serous, watery), <b>submandibular</b> and <b>sublingual</b> (mixed serous+mucous) - plus small buccal glands.",
"Daily volume: <b>1000-1500 mL/day</b>. pH: <b>6.0-7.4</b>. It is the <b>only hypotonic</b> GI secretion.",
"<b>Organic constituents:</b> salivary amylase (ptyalin) - digests starch; lingual lipase - digests some fat; mucin - lubrication; lysozyme & IgA - antibacterial; kallikrein; haptocorrin (binds vitamin B12).",
"<b>Inorganic constituents:</b> Na⁺, K⁺, Cl⁻, HCO3⁻, Ca²⁺, thiocyanate, fluoride. K⁺ and HCO3⁻ are higher than plasma; Na⁺ and Cl⁻ are lower than plasma (ductal cells reabsorb Na/Cl and secrete K/HCO3)."
])
SH("Functions of Saliva")
NUM([
"<b>Digestive</b> - amylase starts starch digestion (up to 30-40% before gastric acid inactivates it); lingual lipase begins fat digestion.",
"<b>Lubrication</b> - mucus helps form a smooth bolus for easy swallowing and aids speech.",
"<b>Protective/Antibacterial</b> - lysozyme, IgA and lactoferrin control oral flora; washes away food debris.",
"<b>Solvent action</b> - dissolves food chemicals so they can stimulate taste buds.",
"<b>Buffering</b> - bicarbonate neutralizes acid and protects teeth from caries.",
"<b>Excretory</b> - excretes certain drugs, viruses (e.g. rabies) and heavy metals.",
"<b>Wound healing</b> - contains epidermal growth factor (EGF)."
])
# ---- 2. Regulation of salivary secretion ----
H("2. Regulation of Salivary Secretion")
P("Unlike most other body functions, salivary secretion is controlled purely by <b>nerves</b>, not hormones. And unusually, BOTH the sympathetic and parasympathetic systems increase salivation (they don't oppose each other here) - though the quality of saliva produced differs.")
SH("Parasympathetic control (the major, dominant pathway)")
BUL([
"Originates from the <b>superior and inferior salivatory nuclei</b> in the pons/medulla.",
"Facial nerve (VII) → submandibular & sublingual glands; Glossopharyngeal nerve (IX) → parotid gland.",
"Neurotransmitter: <b>Acetylcholine on M3 receptors</b>.",
"Effect: copious, watery, enzyme-rich saliva + vasodilation of gland vessels (via co-transmitter VIP)."
])
SH("Sympathetic control (minor pathway)")
BUL([
"From superior cervical ganglion; noradrenaline acts on beta receptors.",
"Effect: small volume of thick, mucus-rich saliva."
])
SH("Inputs that drive the salivatory nuclei")
NUM([
"Taste (sour is the strongest stimulus) and tactile stimuli from the tongue/mouth.",
"Higher centres - smell, sight, or even the thought of food (a learned/conditioned reflex, classic example: Pavlov's dog).",
"Reflexes from the stomach/upper GI tract - nausea-provoking stimuli increase salivation (\"waterbrash\")."
])
P("Salivation is <b>reduced</b> by sleep, fear and dehydration, and <b>increased</b> by nausea and the smell/sight of food.")
# ---- 3. Deglutition reflex (short) ----
H("3. Deglutition Reflex (Short Note)")
P("Deglutition (swallowing) is the reflex that carries a bolus of food from the mouth into the stomach. Imagine it as a relay race with 3 legs - once you start the second leg, you cannot stop until the baton (bolus) reaches the stomach.")
NUM([
"<b>Oral stage (voluntary)</b> - the tongue pushes the bolus against the hard palate and back into the oropharynx.",
"<b>Pharyngeal stage (involuntary, <2 sec)</b> - touch receptors around the pharynx send signals via IX and X nerves to the <b>deglutition centre</b> in the medulla/lower pons. This triggers: soft palate elevation (blocks nose), glottis closure + epiglottis covering the larynx (protects airway), relaxation of the upper esophageal sphincter, and a peristaltic wave pushing the bolus into the esophagus. Breathing is briefly stopped (deglutition apnoea).",
"<b>Esophageal stage (involuntary)</b> - primary peristalsis (continuation of the pharyngeal wave) ± secondary peristalsis (local reflex if the bolus is not cleared) carries the bolus down; the lower esophageal sphincter relaxes just ahead of the wave to let the bolus enter the stomach."
])
P("<b>Key exam point:</b> once the pharyngeal stage begins, swallowing becomes an all-or-none reflex that cannot be voluntarily interrupted. (See Part B, Q13 for the fully detailed version with diagram.)")
# ---- 4. HCl secretion by parietal cells ----
H("4. Functions and Mechanism of HCl Secretion by Parietal Cells; Factors Regulating Secretion")
P("The parietal (oxyntic) cells of the gastric glands are the body's own acid factory. Picture the parietal cell as having a deep pit (the canaliculus) where a pump throws H⁺ ions out into the stomach lumen, using energy, while Cl⁻ ions follow to complete the acid.")
SH("Functions of HCl")
NUM([
"Converts pepsinogen to active pepsin and provides the acid pH (1.5-3.5) pepsin needs to work.",
"Kills most ingested bacteria (bactericidal/protective role).",
"Denatures dietary proteins, unwinding them for enzyme action.",
"Triggers secretin release from the duodenum once acid chyme enters it.",
"Helps keep iron and calcium soluble for absorption."
])
SH("Mechanism of HCl secretion")
NUM([
"CO2 (from blood) + H2O → H2CO3 inside the parietal cell (catalysed by <b>carbonic anhydrase</b>) → dissociates to H⁺ + HCO3⁻.",
"H⁺ is pumped into the canalicular lumen by the <b>H⁺/K⁺ ATPase (proton pump)</b> in exchange for K⁺ entering the cell - this is the main energy-requiring step (blocked by omeprazole/PPIs).",
"The HCO3⁻ generated leaves the cell into the blood in exchange for Cl⁻ coming in (this HCO3⁻ surge into blood after meals is the \"alkaline tide\").",
"Cl⁻ diffuses from the cell into the canalicular lumen through Cl⁻ channels, following the recycled K⁺.",
"H⁺ + Cl⁻ combine in the canaliculus to form <b>HCl</b>, which flows into the stomach lumen."
])
IMG("parietal_cell.png", "Fig: Mechanism of HCl secretion by the parietal cell (H+/K+ ATPase proton pump)")
SH("The three stimulants of HCl secretion (they potentiate each other)")
BUL([
"<b>Gastrin</b> (from G cells) - acts on gastrin/CCK-2 receptors; most potent stimulant, also triggers histamine release from ECL cells.",
"<b>Acetylcholine</b> (from vagus) - acts on M3 receptors - direct vagal drive.",
"<b>Histamine</b> (from ECL cells) - acts on H2 receptors; amplifies the effect of gastrin and ACh (this is why H2-blockers like ranitidine work so well)."
])
SH("Factors regulating secretion - the 3 phases")
BUL([
"<b>Cephalic phase (~30%)</b> - sight/smell/taste/thought of food, via vagus.",
"<b>Gastric phase (~60%, the largest)</b> - stomach distension + protein digestion products directly stimulate G cells to release gastrin.",
"<b>Intestinal phase (~10%)</b> - briefly stimulatory, then mainly <b>inhibitory</b> as acid/fat/chyme fill the duodenum, via secretin, GIP, CCK and the enterogastric reflex."
])
P("<b>Inhibition:</b> low antral pH (<3) switches on somatostatin from D cells, which shuts off both gastrin and the parietal cell directly - a protective negative feedback loop.")
# ---- 5. Peptic ulcer ----
H("5. Peptic Ulcer - Etiology and Treatment")
P("A peptic ulcer is simply a break in the stomach or duodenal lining that goes deep enough to reach the muscularis mucosae. It happens when the acid+pepsin \"attack\" on the mucosa becomes stronger than the mucosa's own \"defence\" (mucus-bicarbonate barrier, blood flow, prostaglandins).")
SH("Etiology")
NUM([
"<b>Helicobacter pylori infection</b> - the single most important cause (present in 70-90% of duodenal ulcers); its urease neutralizes local acid so the bacteria survive, and it damages the mucus layer and provokes inflammation.",
"<b>NSAIDs/Aspirin</b> - inhibit COX-1, reducing protective prostaglandins that normally maintain mucus, bicarbonate, and mucosal blood flow.",
"<b>Excess acid-pepsin secretion</b> - e.g. Zollinger-Ellison syndrome (gastrinoma causing massive acid output).",
"<b>Smoking</b> - reduces mucosal blood flow and bicarbonate secretion, delays healing.",
"<b>Other contributing factors</b> - blood group O, genetic predisposition, chronic stress, alcohol.",
"<b>Weakened mucosal defence</b> in general - reduced mucus/bicarbonate, reduced blood flow, reduced cell renewal."
])
SH("Treatment")
NUM([
"<b>Eradicate H. pylori</b> - triple therapy: a PPI + 2 antibiotics (e.g. amoxicillin + clarithromycin) for 10-14 days.",
"<b>Reduce acid secretion</b> - Proton Pump Inhibitors (omeprazole, pantoprazole - block the H+/K+ ATPase directly) or H2-receptor blockers (ranitidine, famotidine).",
"<b>Neutralise existing acid</b> - antacids (Mg/Al hydroxide) for symptom relief.",
"<b>Mucosal protective agents</b> - sucralfate (coats the ulcer), bismuth compounds, misoprostol (a PGE1 analogue, useful specifically for NSAID-induced ulcers).",
"<b>Lifestyle changes</b> - stop smoking/alcohol, avoid NSAIDs.",
"<b>Surgery</b> - reserved for complications only (perforation, uncontrolled bleeding, gastric outlet obstruction, suspected malignancy) - e.g. vagotomy, partial gastrectomy."
])
# ---- 6. Bile salts / bile composition ----
H("6. Functions of Bile Salts and Composition of Bile")
P("Bile is made continuously by the liver and stored/concentrated in the gallbladder between meals. Think of bile salts as tiny \"soap molecules\" - just like soap breaks grease into small droplets in water, bile salts break big fat globules into tiny droplets that enzymes can attack easily.")
SH("Composition of Bile (liver bile vs concentrated gallbladder bile)")
TBL(
["Substance", "Liver bile", "Gallbladder bile"],
[
["Water", "97.5 g/dL", "92 g/dL"],
["Bile salts", "1.1 g/dL", "6 g/dL"],
["Bilirubin", "0.04 g/dL", "0.3 g/dL"],
["Cholesterol", "0.1 g/dL", "0.3-0.9 g/dL"],
["Lecithin", "0.04 g/dL", "0.3 g/dL"],
["Na+", "145 mEq/L", "130 mEq/L"],
["K+", "5 mEq/L", "12 mEq/L"],
["HCO3-", "28 mEq/L", "10 mEq/L"],
],
col_widths=[5.2*cm, 4.4*cm, 4.4*cm]
)
P("The gallbladder concentrates bile 5-10 fold by reabsorbing water and electrolytes (Na⁺, Cl⁻, HCO3⁻), while bile salts, pigments, and cholesterol stay behind and become concentrated.")
SH("Functions of Bile Salts")
NUM([
"<b>Emulsification of fat</b> - being amphipathic, they reduce surface tension of fat globules, breaking them into small droplets and hugely increasing surface area for pancreatic lipase.",
"<b>Micelle formation</b> - bile salts form micelles with monoglycerides, fatty acids, and fat-soluble vitamins, keeping them in solution until they reach the brush border for absorption.",
"<b>Absorption of fat-soluble vitamins</b> A, D, E, K.",
"<b>Choleretic action</b> - reabsorbed bile salts stimulate the liver to secrete more bile (enterohepatic circulation).",
"<b>Mild laxative action</b> - promote intestinal motility.",
"<b>Route for cholesterol excretion</b> from the body."
])
P("Bile salts are made from cholesterol in the liver (~6 g/day) and >90% are reabsorbed in the terminal ileum, recycling 6-8 times a day (enterohepatic circulation).")
# ---- 7. Defecation reflex ----
H("7. Defecation Reflex")
P("Defecation is triggered the moment the rectum is stretched by incoming faeces - it works like a doorbell: press the button (stretch the rectal wall) and a signal goes to the \"office\" (spinal cord) which sends back the order to open the door (relax the anal sphincters).")
NUM([
"Faeces entering the rectum <b>distends its wall</b>, exciting stretch receptors.",
"Signals travel via the <b>pelvic nerves (parasympathetic, S2-S4)</b> to the sacral spinal cord.",
"Two reflexes are triggered: (a) a weak <b>intrinsic myenteric reflex</b> confined to the gut wall itself; (b) the much more powerful <b>parasympathetic defecation reflex</b>, where signals go up to the sacral cord and back down via pelvic nerve efferents, greatly intensifying peristalsis in the descending colon, sigmoid, rectum and relaxing the internal anal sphincter.",
"The <b>internal anal sphincter</b> (smooth muscle, involuntary) relaxes as the peristaltic wave nears the anus.",
"If the <b>external anal sphincter</b> (skeletal muscle, voluntary, controlled by the pudendal nerve) is also relaxed, defecation occurs.",
"It is aided by voluntary <b>straining</b> - contraction of abdominal muscles and diaphragm increases intra-abdominal pressure (a Valsalva-like effort)."
])
IMG("defecation.png", "Fig: Defecation reflex arc")
P("<b>Key point:</b> the urge to defecate can be voluntarily suppressed by keeping the external sphincter contracted - the rectal wall gradually accommodates to the distension, and repeated suppression over time can lead to constipation.")
# ---- 8. Hormones of GIT ----
H("8. Enumerate the Hormones of the GIT")
P("The gut is the largest endocrine organ in the body! A whole set of hormones released from special cells scattered in the stomach and intestinal mucosa keep digestion running smoothly and talk to each other in a beautiful feedback network.")
TBL(
["Hormone", "Source", "Main Action"],
[
["Gastrin", "G cells (antrum)", "Stimulates HCl secretion; trophic to gastric mucosa"],
["Cholecystokinin (CCK)", "I cells (duodenum/jejunum)", "Gallbladder contraction, pancreatic enzyme secretion, slows gastric emptying, satiety"],
["Secretin", "S cells (duodenum)", "Stimulates pancreatic/biliary HCO3- secretion; inhibits gastric acid"],
["GIP", "K cells (duodenum/jejunum)", "Stimulates insulin release; inhibits gastric acid secretion"],
["Motilin", "M cells (duodenum)", "Triggers migrating motor complex (interdigestive motility)"],
["Somatostatin", "D cells (stomach/pancreas)", "Inhibits almost all GI hormones and gastric acid"],
["VIP", "Enteric neurons", "Relaxes GI smooth muscle/sphincters; stimulates secretion"],
["Ghrelin", "Gastric fundus", "Stimulates hunger and growth hormone release"],
["GLP-1", "L cells (ileum/colon)", "Stimulates insulin, slows gastric emptying, satiety"],
],
col_widths=[4*cm, 4.2*cm, 5.8*cm]
)
P("<b>Exam tip - classify by family:</b> Gastrin family (gastrin, CCK - share the same active C-terminal end); Secretin family (secretin, GIP, VIP, glucagon); Others (motilin, somatostatin, ghrelin).")
# ---- 9. Gastrin ----
H("9. Short Note on Gastrin")
BUL([
"<b>Source:</b> G cells of the gastric antral mucosa.",
"<b>Chemical nature:</b> peptide hormone; exists as G34 (\"big gastrin\") and G17 (\"little gastrin\"); the biologically active part is the C-terminal tetrapeptide (shared with CCK).",
"<b>Stimuli for release:</b> stomach distension, products of protein digestion (peptides/amino acids - especially phenylalanine & tryptophan), vagal stimulation (via GRP), and an alkaline antral pH.",
"<b>Inhibited by:</b> low antral pH (<3, negative feedback) and somatostatin.",
"<b>Actions:</b> (1) most potent stimulant of gastric HCl secretion - both directly on parietal cells and by triggering histamine release from ECL cells; (2) trophic (growth-promoting) effect on the gastric mucosa; (3) mild stimulation of gastric motility and pepsinogen secretion.",
"<b>Clinical correlate:</b> Zollinger-Ellison syndrome - a gastrin-secreting tumour (gastrinoma) causes massive acid hypersecretion, severe/recurrent peptic ulcers, and diarrhoea/steatorrhoea (acid inactivates pancreatic lipase)."
])
# ---- 10. CCK ----
H("10. Short Note on Cholecystokinin (CCK)")
BUL([
"<b>Source:</b> I cells of the duodenal and jejunal mucosa.",
"<b>Stimuli for release:</b> fatty acids, monoglycerides, and amino acids/peptides in the duodenum - fat is the strongest trigger.",
"<b>Actions:</b> (1) contracts the gallbladder and relaxes the sphincter of Oddi - the most potent stimulus for gallbladder emptying; (2) strongly stimulates pancreatic acinar cells to release digestive enzymes; (3) potentiates secretin's action on pancreatic HCO3- output; (4) slows gastric emptying, giving more time for fat digestion (part of the \"ileal brake\"); (5) promotes satiety - hence its nickname, the \"satiety hormone\"; (6) has a trophic effect on pancreatic acinar tissue.",
"<b>Structural note:</b> shares the same active C-terminal 5 amino acids as gastrin, so it has weak gastrin-like actions too."
])
# ---- 11. Regulation of gastric motility ----
H("11. Regulation of Gastric Motility")
P("Gastric motility is not just one movement - it is receptive relaxation (making room), mixing waves (churning), and controlled emptying (letting food out slowly) - each carefully regulated so the duodenum is never overwhelmed.")
NUM([
"<b>Receptive relaxation</b> - as food enters via swallowing, the fundus/body of the stomach relaxes to accommodate volume without a big rise in pressure; mediated by a vagovagal reflex releasing NO/VIP.",
"<b>Mixing waves</b> - peristaltic contractions (~3/min), paced by the gastric \"pacemaker\" (interstitial cells of Cajal in the greater curvature generating the basic electrical rhythm), churn food into chyme; a strong antral \"pyloric pump\" pushes chyme toward the pylorus.",
"<b>Gastric emptying</b> is controlled by a tug-of-war between:",
])
BUL([
"<b>Gastric factors that promote emptying</b> - food volume/distension (triggers local myenteric reflexes that boost the pyloric pump); gastrin (mild stimulatory effect).",
"<b>Duodenal factors that inhibit emptying (the stronger side, the \"enterogastric reflex\")</b> - duodenal distension, acidity (pH <3.5-4), hypertonicity, fat/protein breakdown products, or irritation. These act through nervous reflexes (enteric, prevertebral ganglia, vagus) AND hormones (CCK, secretin, GIP), reducing antral pump activity and increasing pyloric tone."
])
P("Overall: <b>parasympathetic (vagus)</b> stimulates gastric motility; <b>sympathetic</b> inhibits it. The net effect ensures chyme enters the duodenum only as fast as it can be digested and absorbed.")
# ---- 12. Achalasia cardia ----
H("12. Achalasia Cardia")
P("Achalasia is what happens when the lower esophageal sphincter (LES) 'forgets how to relax'. Normally special inhibitory nerves tell the LES to relax just before food arrives - in achalasia those nerves are lost, so food gets stuck at the gate.")
BUL([
"<b>Definition:</b> a motility disorder with (1) impaired/absent relaxation of the LES on swallowing, and (2) absence of normal peristalsis in the esophageal body (aperistalsis).",
"<b>Pathophysiology:</b> loss of inhibitory ganglion cells (which release nitric oxide and VIP) in the myenteric (Auerbach) plexus of the lower esophagus. Excitatory cholinergic neurons remain relatively intact, so LES tone may even be increased due to this unopposed action while relaxation still fails.",
"<b>Clinical features:</b> progressive dysphagia to both solids and liquids, regurgitation of undigested food, chest discomfort, weight loss; barium swallow shows a dilated esophagus with a smooth tapering \"bird-beak\" narrowing at the LES.",
"<b>Physiology exam angle:</b> normal LES relaxation (\"receptive relaxation\") is a vagally-mediated reflex using NO/VIP just ahead of the peristaltic wave - in achalasia this inhibitory pathway is destroyed, so the LES stays shut despite a normal swallow signal.",
"<b>Treatment:</b> pneumatic dilation, Heller's myotomy (surgically cutting the LES muscle fibres), or botulinum toxin injection (paralyses the excitatory neurons to reduce LES tone)."
])
# ================= PART B : LAQs =================
PART("PART B - Long Answer Questions (LAQs)")
# ---- 13. Deglutition detailed ----
H("13. Deglutition (Swallowing) - Detailed Description with Diagram")
P("Deglutition is the coordinated process that transports a bolus of food or liquid from the mouth to the stomach through the pharynx and esophagus. It is a beautiful example of how a completely voluntary action (chewing, deciding to swallow) smoothly hands control over to an automatic brainstem reflex that you cannot stop halfway. It is divided into three stages: <b>oral (voluntary)</b>, <b>pharyngeal (involuntary)</b>, and <b>esophageal (involuntary)</b>.")
IMG("deglutition.png", "Fig: The three stages of swallowing - oral, pharyngeal and esophageal")
SH("1. Oral (Buccal) Stage - Voluntary")
P("The tongue is voluntarily pressed upward and backward against the hard palate, squeezing the bolus into the oropharynx. This is the <b>only voluntary part</b> of the entire swallowing act - the moment the bolus crosses the anterior faucial pillars (back of the mouth), the process becomes an automatic reflex that proceeds to completion on its own.")
SH("2. Pharyngeal Stage - Involuntary Reflex (lasts less than 2 seconds)")
P("<b>Trigger:</b> the bolus stimulates touch/pressure receptors around the pharyngeal opening (tonsillar pillars, posterior pharyngeal wall).")
P("<b>Afferent path:</b> impulses travel via the <b>glossopharyngeal (IX)</b> and <b>vagus (X)</b> nerves to the <b>deglutition (swallowing) centre</b>, located bilaterally in the medulla and lower pons (nucleus tractus solitarius and nucleus ambiguus).")
P("<b>Efferent path and sequence of events</b> (carried by cranial nerves V, IX, X, XII):")
NUM([
"The <b>soft palate</b> is pulled upward and the palatopharyngeal folds are pulled medially towards each other, forming a slit that stops food from entering the nasopharynx and \"strains\" larger boluses.",
"The <b>vocal cords approximate strongly</b>, the larynx is pulled up and forward, and the <b>epiglottis swings back</b> to cover the laryngeal opening - together these protect the airway from food entering the trachea.",
"The upward movement of the larynx also widens the entrance to the esophagus.",
"The <b>upper esophageal sphincter (cricopharyngeus)</b> relaxes, allowing the bolus to move rapidly into the upper esophagus.",
"A fast, powerful <b>pharyngeal peristaltic wave</b> pushes the bolus onward into the esophagus."
])
P("During this stage, breathing is momentarily and reflexively halted - called <b>deglutition apnoea</b> - because the swallowing centre directly inhibits the medullary respiratory centre.")
SH("3. Esophageal Stage - Involuntary")
P("Two types of peristalsis carry the bolus down the ~25 cm esophagus into the stomach:")
BUL([
"<b>Primary peristalsis</b> - simply the continuation of the pharyngeal peristaltic wave spreading into the esophagus; takes about 8-10 seconds to reach the stomach.",
"<b>Secondary peristalsis</b> - a backup mechanism; if the primary wave fails to clear all the food (e.g. a bolus lodges and distends the esophagus), the local stretch triggers a new peristaltic wave through the esophagus's own myenteric plexus (reinforced by vagal reflexes), which repeats until the esophagus is empty."
])
P("<b>Receptive relaxation of the LES:</b> just before the peristaltic wave reaches the lower end of the esophagus, the <b>lower esophageal sphincter (LES)</b> relaxes ahead of it (via vagal inhibitory fibres releasing nitric oxide and VIP), letting the bolus pass easily into the stomach. The LES then closes again, maintaining a resting tonic barrier pressure that normally prevents reflux of acidic gastric contents (loss of this barrier causes GERD; failure of its relaxation causes achalasia - see Part A, Q12).")
SH("Nervous control - summary")
BUL([
"<b>Deglutition centre:</b> bilateral, medulla and lower pons.",
"<b>Afferents:</b> IX, X.",
"<b>Efferents:</b> V (trigeminal), IX (glossopharyngeal), X (vagus), XII (hypoglossal).",
"It is a classic <b>all-or-none brainstem reflex</b> - once triggered, it always runs to completion and cannot be voluntarily interrupted."
])
SH("Applied/Clinical correlation")
P("Damage to cranial nerves IX/X or to the medullary swallowing centre (e.g. bulbar palsy, brainstem stroke) causes <b>dysphagia</b> with a high risk of nasal regurgitation and aspiration into the airway, because the protective reflexes of the pharyngeal stage fail.")
# ---- 14. Gastric glands ----
H("14. Gastric Glands - Enumerate Secretions and Functions")
P("The stomach lining is not uniform - different regions have different glands, and even within one gland, different cells sit at different depths and each makes a different product. Picture the gastric (oxyntic) gland as a test-tube-shaped pit going down into the mucosa, with a different \"factory\" at each level.")
BUL([
"<b>Oxyntic (gastric/fundic) glands</b> - in the fundus and body (~80% of the stomach); secrete acidic gastric juice.",
"<b>Pyloric glands</b> - in the antrum; secrete mainly mucus and gastrin.",
"<b>Cardiac glands</b> - near the esophagogastric junction; secrete only mucus."
])
IMG("gastric_gland.png", "Fig: Structure of an oxyntic (gastric) gland and its cell types")
SH("Cell types of the oxyntic gland and what they secrete")
TBL(
["Cell type", "Location", "Secretion", "Function"],
[
["Surface mucous cells", "Gastric pit/surface", "Alkaline visible mucus", "Protects mucosa from acid & injury"],
["Mucous neck cells", "Neck of gland", "Thin soluble mucus", "Lubrication"],
["Parietal (oxyntic) cells", "Body of gland", "HCl + Intrinsic Factor", "Acidifies lumen, activates pepsin, kills bacteria; IF needed for B12 absorption"],
["Chief (peptic) cells", "Base of gland", "Pepsinogen + gastric lipase", "Protein & minor fat digestion"],
["ECL cells", "Base, near parietal cells", "Histamine", "Paracrine - potentiates HCl secretion via H2 receptors"],
["G cells", "Antral/pyloric glands", "Gastrin", "Stimulates HCl secretion; trophic to mucosa"],
["D cells", "Body & antral glands", "Somatostatin", "Inhibits gastrin, HCl, and other GI hormones"],
],
col_widths=[3.4*cm, 3.2*cm, 3.4*cm, 4*cm]
)
SH("Integrated functions of the gastric glands")
NUM([
"<b>Protein digestion</b> - pepsin (activated from pepsinogen) starts breaking proteins into smaller peptides.",
"<b>Acid environment</b> - HCl gives pepsin its optimum pH, sterilizes food, and denatures proteins.",
"<b>Vitamin B12 absorption</b> - intrinsic factor from parietal cells protects B12 until it is absorbed in the terminal ileum (its lack, e.g. in pernicious anaemia or after gastrectomy, causes B12 deficiency).",
"<b>Mucosal protection</b> - the mucus-bicarbonate barrier from mucous cells shields the stomach's own lining from autodigestion.",
"<b>Hormonal/paracrine fine-tuning</b> - gastrin, histamine and somatostatin from the gland's own endocrine cells regulate the rate of secretion moment to moment.",
"<b>Minor fat digestion</b> - gastric lipase (more important in infants)."
])
# ---- 15. Gastric juice composition ----
H("15. Gastric Juice - Composition")
P("Gastric juice is simply the combined output of every cell type in the gastric glands, mixed together - about 1.5 to 2.5 litres are produced every day.")
SH("Physical characters")
BUL([
"Volume: <b>1500-2500 mL/day</b>.",
"pH: <b>1.5-3.5</b> during active secretion (can rise toward neutral between meals when secretion is low and mucus/alkaline components dominate).",
])
SH("Components")
NUM([
"<b>Water</b> - about 99% of the juice.",
"<b>Hydrochloric acid (HCl)</b> - from parietal cells; can reach concentrations up to ~150-160 mEq/L in the canaliculus.",
"<b>Electrolytes</b> - Na⁺, K⁺, Cl⁻, HCO3⁻ (their proportions change with the rate of secretion - at high flow, H⁺ dominates and Na⁺ falls).",
"<b>Pepsinogen (I & II)</b> - from chief cells; converted to active <b>pepsin</b> by HCl at pH below ~5 (an autocatalytic step - pepsin can activate more pepsinogen); pepsin works best at pH 1.8-3.5 and is inactivated in the alkaline duodenum.",
"<b>Gastric lipase</b> - from chief cells; digests a small amount of triglycerides (more important in infants).",
"<b>Mucus</b> - from surface mucous and mucous neck cells; forms a protective gel layer (~1 mm) over the mucosa.",
"<b>Intrinsic factor</b> - glycoprotein from parietal cells, essential for vitamin B12 absorption in the terminal ileum."
])
SH("Regulation - the 3 phases (recap)")
BUL([
"<b>Cephalic phase (~30%)</b> - via vagus; sight/smell/taste/thought of food.",
"<b>Gastric phase (~60%)</b> - the largest contributor; distension + gastrin release.",
"<b>Intestinal phase (~10%)</b> - briefly stimulatory, then mainly inhibitory as chyme fills the duodenum."
])
SH("Functions of gastric juice (summary)")
P("Protein digestion (pepsin), minor fat digestion (lipase), bactericidal action (HCl), activation of pepsinogen, B12 absorption support (intrinsic factor), mucosal protection (mucus), and converting solid food into a semi-liquid <b>chyme</b> ready for the small intestine.")
# ---- 16. Pancreatic juice ----
H("16. Pancreatic Juice - Composition, Function and Regulation")
P("The pancreas is the most powerful digestive gland in the body - given enough time, its juice alone can digest almost 100% of the carbohydrate, protein, and fat we eat. About 1000-1500 mL is produced daily, made of two very different components working as a team.")
SH("A) Aqueous (electrolyte) component - from duct/centroacinar cells")
BUL([
"Rich in <b>bicarbonate (HCO3-)</b> - can reach 110-150 mEq/L at high flow, giving pancreatic juice a pH of about <b>8.0-8.3</b> (strongly alkaline).",
"<b>Function:</b> neutralises the acidic chyme arriving from the stomach, raising duodenal pH to 6-7 - the range pancreatic enzymes need to work, and protects the duodenal mucosa from acid injury.",
"Na⁺ and K⁺ are close to plasma levels; Cl⁻ falls and HCO3⁻ rises as the secretory rate increases."
])
SH("B) Enzymatic component - from acinar cells")
NUM([
"<b>Proteolytic enzymes</b> (secreted as inactive zymogens, to protect the pancreas from self-digestion): Trypsinogen → <b>Trypsin</b> (activated by enterokinase from the duodenal brush border; trypsin then activates the rest); Chymotrypsinogen → Chymotrypsin; Procarboxypeptidase → Carboxypeptidase; Proelastase → Elastase.",
"<b>Amylolytic enzyme:</b> Pancreatic amylase - digests starch/glycogen into maltose and dextrins (secreted already active).",
"<b>Lipolytic enzymes:</b> Pancreatic lipase (with co-lipase) - the major fat-digesting enzyme, splits triglycerides into monoglycerides + free fatty acids; also cholesterol esterase and phospholipase A2.",
"<b>Nucleolytic enzymes:</b> Ribonuclease and deoxyribonuclease, digesting RNA/DNA."
])
P("A <b>trypsin inhibitor</b> is also present in pancreatic tissue/secretion to prevent premature activation of trypsin inside the pancreas - failure of this safeguard is one mechanism behind acute pancreatitis.")
SH("Regulation of pancreatic secretion - 3 phases")
NUM([
"<b>Cephalic phase (~20%)</b> - vagal stimulation from sight/smell/taste of food directly causes acinar cells to secrete a small volume of enzyme-rich juice.",
"<b>Gastric phase (~5-10%)</b> - gastric distension triggers a vagovagal reflex with mild stimulation; gastrin also weakly stimulates acinar cells.",
"<b>Intestinal phase (~70-80%, the major phase)</b> - acidic chyme and fat/protein digestion products in the duodenum release two key hormones:"
])
BUL([
"<b>Secretin</b> (from S cells, released by duodenal acid, pH <4.5) - acts on <b>duct cells</b> to produce a copious, watery, HCO3--rich but enzyme-poor secretion; also stimulates biliary HCO3- secretion.",
"<b>Cholecystokinin (CCK)</b> (from I cells, released by fatty acids/amino acids in the duodenum) - acts on <b>acinar cells</b> to produce a small-volume, enzyme-rich secretion; also contracts the gallbladder so bile arrives at the same time as the enzymes.",
"Secretin and CCK <b>potentiate</b> each other - together they produce a much larger combined (watery + enzyme-rich) secretion than either alone. Vagal stimulation further potentiates both hormones' actions on the pancreas."
])
SH("Functions of pancreatic juice (summary)")
P("Digests essentially every class of food - carbohydrates (amylase), proteins (trypsin, chymotrypsin, carboxypeptidase, elastase), fats (lipase), and nucleic acids (nucleases) - while its bicarbonate protects the duodenum from acid. Without it, up to 60-70% of ingested fat would pass undigested into the stool, as seen clinically in chronic pancreatitis or cystic fibrosis (steatorrhoea).")
# ================= PART C : CHEAT SHEET =================
story.append(PageBreak())
story.append(Paragraph("PART C - ONE-PAGE CHEAT SHEET (Night-Before Revision)", part_style))
story.append(Spacer(1,6))
cheat_intro = ParagraphStyle("CheatIntro", parent=styles["Normal"], fontSize=9, textColor=colors.HexColor("#555555"), spaceAfter=8, alignment=TA_CENTER)
story.append(Paragraph("Dense, bullet~/gi-physiology-notes/build_pdf.py
Successfully replaced 1 instance(s) of the string in '/tmp/workspace/gi-physiology-notes/build_pdf.py'
cd /tmp/workspace/gi-physiology-notes && python3 build_pdf.py
"activated <pH5" in ~/gi-physiology-notes
~/gi-physiology-notes/build_pdf.py
Successfully replaced 1 instance(s) of the string in '/tmp/workspace/gi-physiology-notes/build_pdf.py'
cd /tmp/workspace/gi-physiology-notes && python3 build_pdf.py
/tmp/workspace/gi-physiology-notes/GI_Physiology_MBBS_Notes.pdf with all your topics. But since I've hit the time limit for this turn, let me summarize where things stand rather than continue building.- Functions and composition of saliva
- Regulation of salivary secretion
- Deglutition reflex (short)
- HCl secretion by parietal cells + regulating factors
- Peptic ulcer - etiology and treatment
- Bile salts - functions and bile composition
- Defecation reflex
- GI hormones enumerated
- Note on gastrin
- Note on CCK
- Regulation of gastric motility
- Achalasia cardia
/tmp/workspace/gi-physiology-notes/GI_Physiology_MBBS_Notes.pdf - I just haven't been able to do a final verification pass (checking page count/rendering) or hand you the confirmed link in this turn.- Just verify the PDF renders correctly and give you the final download link
- Re-check/expand any specific topic before finalizing
- Something else
Verify and deliver the final GI Physiology PDF link
cd /tmp/workspace/gi-physiology-notes && ls -la GI_Physiology_MBBS_Notes.pdf && python3 -c " from pypdf import PdfReader r = PdfReader('GI_Physiology_MBBS_Notes.pdf') print('Pages:', len(r.pages)) for i,p in enumerate(r.pages[:3]): t = p.extract_text() or '' print('--- page', i+1, 'chars:', len(t)) "
- Part A: 12 SAQs (saliva, deglutition reflex, HCl/parietal cells, peptic ulcer, bile salts, defecation reflex, GI hormones, gastrin, CCK, gastric motility, achalasia)
- Part B: 4 LAQs in full detail (deglutition, gastric glands, gastric juice, pancreatic juice) with 4 embedded diagrams
- Part C: one-page cheat sheet condensing all 16 topics for night-before revision
GI Physiology MBBS Notes
PDF Document · PDF