
Hormones
Hormones
What aspect of hormones are you interested in? · What level of detail do you need?
hormone mechanism of action receptor signaling diagram
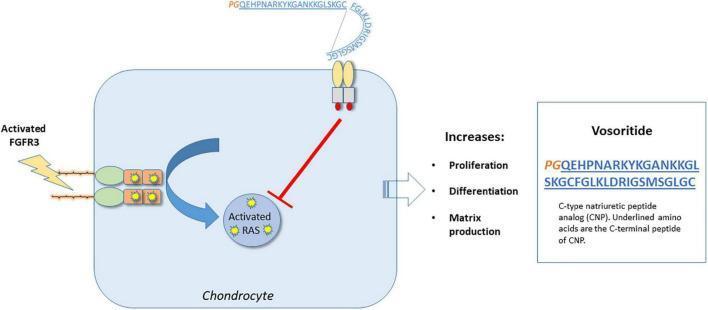
A pathophysiology diagram illustrating the molecular mechanism of action of Vosoritide within a chondrocyte. The diagram depicts two primary transmembrane signaling pathways: the constitutively activated Fibroblast Growth Factor Receptor 3 (FGFR3) pathway and the Natriuretic Peptide Receptor 2 (NPR2) pathway. Activated FGFR3 is shown stimulating the intracellular RAS protein, represented by a blue arrow pointing to 'Activated RAS'. Concurrently, Vosoritide, a C-type natriuretic peptide (CNP) analog, is shown binding to the NPR2 receptor. This binding event triggers an inhibitory signal, visually represented by a red T-bar line, which blocks the activation of RAS. The amino acid sequence of Vosoritide is detailed, highlighting a stabilizing proline-glycine (PG) N-terminus in orange and the underlined C-terminal peptide of CNP in blue. The downstream physiological effects of this inhibition are listed as increased chondrocyte proliferation, differentiation, and matrix production. This visual describes the therapeutic mechanism used to treat achondroplasia by counteracting overactive FGFR3 signaling.
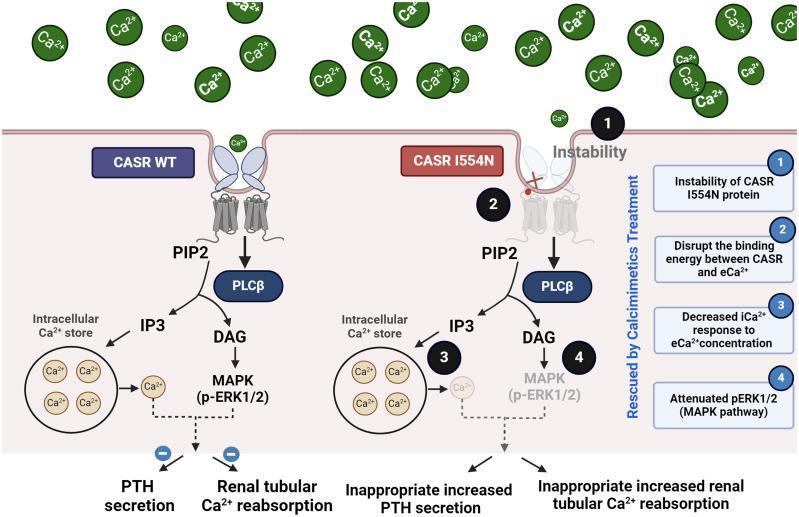
This pathophysiology diagram illustrates the molecular mechanism of the Calcium-Sensing Receptor (CASR) wild-type (WT) compared to the pathogenic I554N mutation. The left side (CASR WT) depicts normal signaling: extracellular calcium (eCa2+) binds to the intact receptor, activating the PLC̠ pathway (PIP2 to IP3 and DAG), which triggers intracellular calcium release and the MAPK (p-ERK1/2) pathway to inhibit Parathyroid Hormone (PTH) secretion and renal tubular calcium reabsorption. The right side (CASR I554N) highlights four pathological consequences: (1) protein instability, (2) disrupted binding energy between CASR and eCa2+, (3) decreased intracellular calcium (iCa2+) response, and (4) attenuated MAPK signaling. These defects lead to clinical manifestations of Familial Hypocalciuric Hypercalcemia type 1 (FHH1), specifically inappropriate increased PTH secretion and increased renal tubular calcium reabsorption. A vertical label indicates that this dysfunctional state can be 'Rescued by Calcimimetics Treatment.' The diagram serves as an educational tool for understanding G-protein coupled receptor (GPCR) dysfunction and calcium homeostasis disorders.
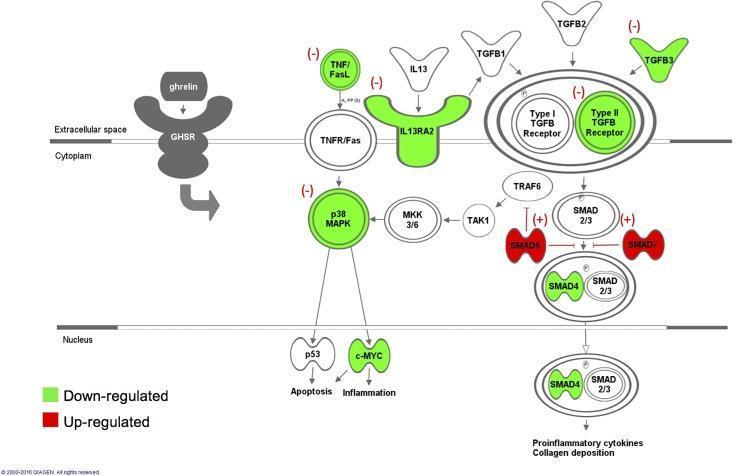
A pathophysiology diagram illustrating the ghrelin-induced signaling pathways involved in anti-inflammatory and anti-fibrotic responses. The diagram is divided into three compartments: extracellular space, cytoplasm, and nucleus. The primary entry point is ghrelin binding to the growth hormone secretagogue receptor (GHSR) on the cell membrane. The visualization uses a color-coding system where green indicates down-regulation and red indicates up-regulation. Key downregulated components (green) include TNF/FasL, IL13RA2, TGFB3, Type II TGFB Receptor, p38 MAPK, SMAD4, and c-MYC. Key upregulated components (red) include the inhibitory proteins SMAD6 and SMAD7. The diagram shows ghrelin's inhibitory effect (-) on the TGF-̢/Smads and p38-MAPK pathways. In the cytoplasm, SMAD6 and SMAD7 inhibit the progression of the SMAD2/3 complex toward the nucleus. Nuclear translocation of these factors leads to final biological outcomes, specifically the regulation of apoptosis, inflammation, proinflammatory cytokine production, and collagen deposition. This model explains the molecular mechanism by which ghrelin administration may reduce post-operative intra-abdominal adhesions.
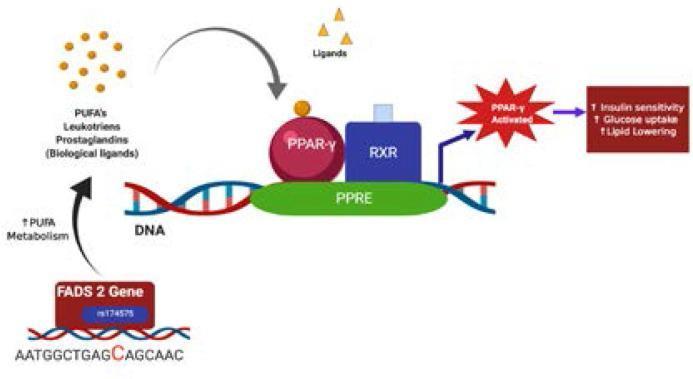
This pathophysiology diagram illustrates the suggestive molecular mechanism of action for the FADS2 gene variant rs174575 (CC homozygote) in relation to metabolic health. The diagram shows a DNA strand containing the FADS2 gene, which promotes increased Polyunsaturated Fatty Acid (PUFA) metabolism. This metabolic process yields biological ligands including PUFAs, leukotrienes, and prostaglandins. These biological ligands, along with other exogenous ligands, bind to and activate the Peroxisome Proliferator-Activated Receptor-gamma (PPAR-γ). The activated PPAR-γ forms a heterodimer with the Retinoid X Receptor (RXR), which then binds to the Peroxisome Proliferator Response Element (PPRE) on the DNA. This nuclear signaling pathway leads to specific physiological outcomes: increased insulin sensitivity, enhanced glucose uptake, and lipid lowering. The visual uses standard biochemical notation to represent the transcriptional regulation involved in lipid and glucose homeostasis, emphasizing the protective role of the wild-type FADS2 genotype against insulin resistance.
steroid hormone nuclear receptor gene transcription mechanism
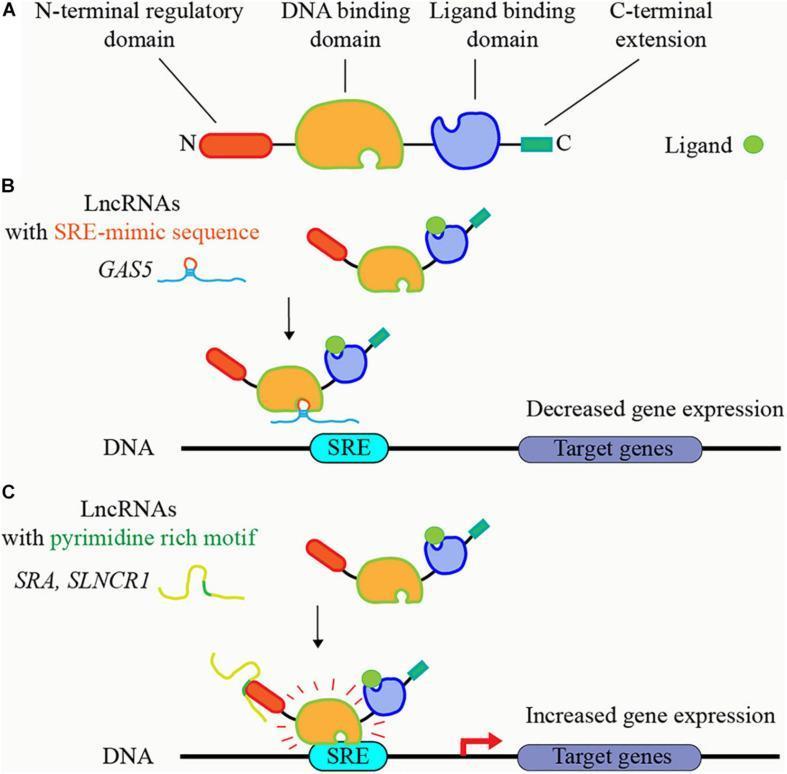
This pathophysiology diagram illustrates the regulatory mechanisms of long non-coding RNAs (lncRNAs) on steroid receptor signaling pathways. Part A depicts the domain architecture of a typical steroid receptor, showing the N-terminal regulatory domain, a central DNA-binding domain (DBD), a ligand-binding domain (LBD), and a C-terminal extension. Part B demonstrates a mechanism of transcriptional repression where lncRNAs containing steroid receptor responsive element (SRE)-mimic sequences, such as GAS5, competitively bind to the receptor's DBD. This prevents the receptor from docking at the genomic SRE site on DNA, leading to decreased target gene expression. Part C illustrates transcriptional activation where lncRNAs with pyrimidine-rich motifs, such as SRA and SLNCR1, bind to the N-terminal regulatory domain. This interaction facilitates or stabilizes the binding of the steroid receptor-ligand complex to the DNA SRE site, resulting in increased expression of downstream target genes. The diagram utilizes color-coded shapes and arrows to map molecular interactions and their resulting genomic outcomes, serving as an educational resource for molecular biology and endocrinology.
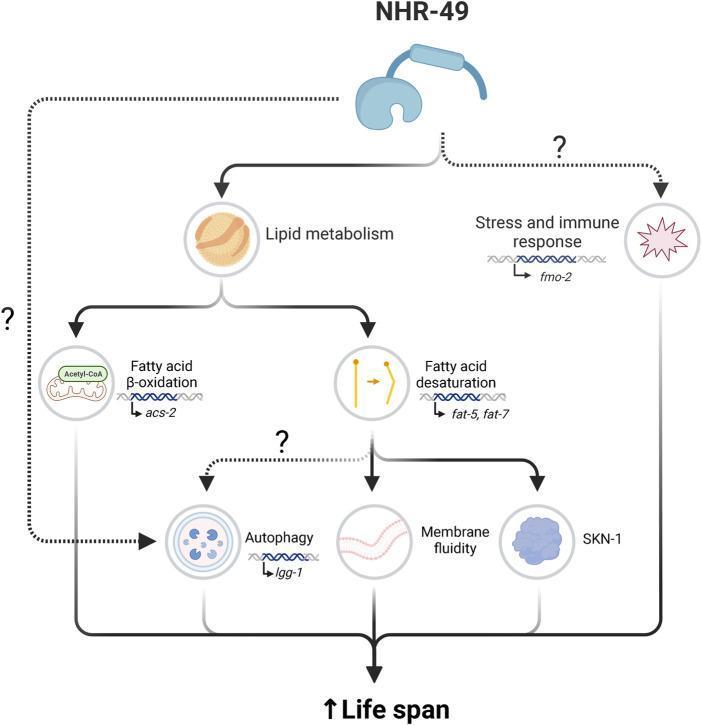
This pathophysiology diagram illustrates the signaling pathways through which the nuclear hormone receptor NHR-49 regulates longevity in C. elegans, serving as a model for metabolic control of lifespan. At the apex, NHR-49 initiates two primary downstream branches: lipid metabolism and stress/immune response. Under the lipid metabolism pathway, NHR-49 upregulates the 'acs-2' gene to facilitate fatty acid beta-oxidation and the 'fat-5' and 'fat-7' genes to promote fatty acid desaturation. These metabolic shifts contribute to membrane fluidity and may interact with the SKN-1 pathway. Additionally, NHR-49 influences the stress and immune response by upregulating 'fmo-2'. The diagram further shows a link to autophagy, indicated by 'lgg-1' regulation. Solid arrows denote established direct pathways, while dotted lines with question marks indicate hypothesized or indirect connections between NHR-49, beta-oxidation, and autophagy. Collectively, these coordinated cellular processes—metabolic homeostasis, enhanced proteostasis (autophagy), and stress resistance—converge to promote an increased lifespan.
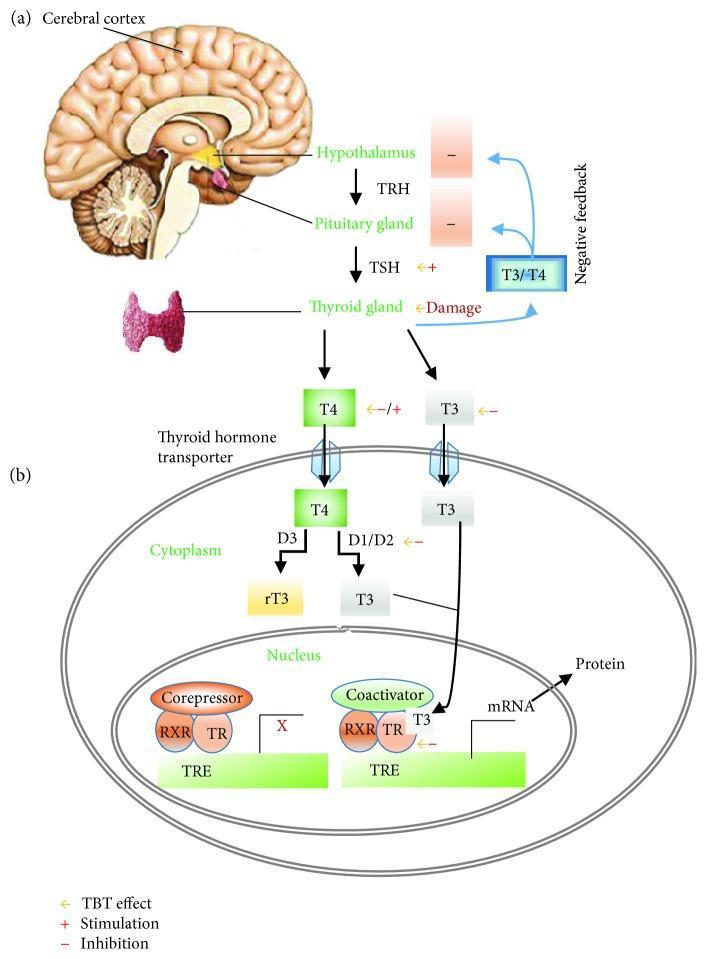
A two-part medical illustration depicting the pathophysiology of the Hypothalamic-Pituitary-Thyroid (HPT) axis and cellular thyroid hormone action. Section (a) shows the systemic HPT axis, beginning with the cerebral cortex and hypothalamus. The hypothalamus releases thyrotropin-releasing hormone (TRH), which stimulates the pituitary gland to secrete thyroid-stimulating hormone (TSH). TSH subsequently acts on the thyroid gland to stimulate the production of T4 and T3 hormones, which exert negative feedback on the hypothalamus and pituitary. Section (b) details the intracellular mechanism of action within a target cell. T4 and T3 enter the cell via thyroid hormone transporters. In the cytoplasm, deiodinases (D1/D2) convert T4 to T3, while D3 converts T4 to inactive reverse T3 (rT3). T3 enters the nucleus, binding to the thyroid hormone receptor (TR) which heterodimerizes with the retinoid X receptor (RXR). This complex binds to the thyroid hormone response element (TRE) on DNA, displacing corepressors and recruiting coactivators to initiate gene transcription (mRNA) and subsequent protein synthesis. The diagram also highlights potential sites of endocrine disruption (e.g., by Tributyltin/TBT), including receptor inhibition and deiodinase interference.
Hormones: Physiology and Mechanisms of Action
1. What Is a Hormone?
2. Receptor Regulation: Up- and Down-Regulation
Down-Regulation
- Decreased synthesis of new receptors
- Increased degradation of existing receptors
- Receptor inactivation
Up-Regulation
- Prolactin up-regulates its own receptors in the breast
- Growth hormone up-regulates its receptors in skeletal muscle and liver
- Estrogen up-regulates its own receptors in the uterus and up-regulates LH receptors in the ovaries
3. The Five Mechanisms of Hormone Action
Mechanism 1 - Adenylyl Cyclase / cAMP (Most Common Peptide Hormones)
- Hormone binds to a membrane receptor
- The receptor couples to a Gs protein (stimulatory) or Gi protein (inhibitory) - a heterotrimeric protein with α, β, and γ subunits
- On the Gs protein: GDP is exchanged for GTP on the αs subunit → G protein becomes active
- The αs subunit activates adenylyl cyclase, which converts ATP → cAMP (second messenger)
- cAMP activates protein kinase A (PKA), which phosphorylates specific intracellular proteins to produce the physiologic effect
- The response is terminated when phosphodiesterase degrades cAMP → AMP
- G proteins are "molecular switches" - GTP-bound = active; GDP-bound = inactive
- Gs = stimulatory (activates adenylyl cyclase)
- Gi = inhibitory (inhibits adenylyl cyclase)
- GRFs (guanosine nucleotide-releasing factors) speed activation; GAPs (GTPase-activating factors) speed inactivation via GTP hydrolysis
Mechanism 2 - Phospholipase C / IP3/Ca2+ Pathway
- Hormone binds to membrane receptor
- A Gq protein is activated
- Gq activates phospholipase C (PLC), which cleaves PIP2 into two second messengers:
- IP3 (inositol 1,4,5-trisphosphate) - diffuses to the endoplasmic/sarcoplasmic reticulum (ER/SR) and opens Ca²⁺ channels, releasing Ca²⁺ into the cytoplasm
- DAG (diacylglycerol) - remains in the membrane and activates protein kinase C (PKC)
- Ca²⁺ binds to calmodulin → activates calmodulin-dependent kinases → physiologic effects
- The combination of IP3/Ca²⁺ and DAG/PKC together orchestrates the full hormonal response
Mechanism 3 - Steroid and Thyroid Hormone Mechanism (Nuclear Receptors)
- The lipid-soluble hormone diffuses through the plasma membrane into the cytoplasm
- It binds to a cytoplasmic or nuclear receptor protein (often complexed with heat-shock protein hsp90 in the inactive state - hsp90 prevents normal receptor folding)
- Hormone binding causes a conformational change, releases hsp90, and activates the receptor
- The hormone-receptor complex acts as a transcription factor - it translocates to the nucleus and binds to specific hormone response elements (HREs) on DNA
- This directly stimulates or inhibits gene transcription → altered mRNA → altered protein synthesis → physiologic effect
Mechanism 4 - Tyrosine Kinase Mechanism
- Hormone binds to a receptor that has intrinsic tyrosine kinase activity (or is associated with JAK tyrosine kinases)
- Receptor dimerization and autophosphorylation of tyrosine residues
- Phosphorylated receptor recruits intracellular signaling proteins (e.g., IRS-1 for insulin) → activates downstream cascades (MAPK, PI3K/Akt pathways)
- These cascades regulate cell growth, glucose uptake, protein synthesis, and proliferation
Mechanism 5 - Guanylate Cyclase / cGMP
- ANP binds a receptor with intrinsic guanylate cyclase activity → converts GTP → cGMP → activates protein kinase G (PKG)
- NO diffuses into cells and activates soluble guanylate cyclase directly → cGMP → vasodilation
4. Summary Table of Mechanisms
| Mechanism | Second Messenger | Key Enzymes/Proteins | Example Hormones |
|---|---|---|---|
| Adenylyl cyclase | cAMP | Adenylyl cyclase, PKA | ACTH, TSH, LH, FSH, PTH, glucagon |
| Phospholipase C | IP3/Ca²+, DAG | PLC, PKC, calmodulin-kinases | GnRH, TRH, oxytocin, Ang II |
| Steroid/nuclear | None (direct gene regulation) | Nuclear receptors, transcription factors | Cortisol, estrogen, testosterone, aldosterone, T3 |
| Tyrosine kinase | None (direct phosphorylation) | Receptor-TK, JAK, IRS proteins | Insulin, GH, prolactin, IGF-1 |
| Guanylate cyclase | cGMP | Guanylate cyclase, PKG | ANP, NO |
5. Amplification and Signal Termination
- Phosphodiesterases - degrade cAMP and cGMP
- Phosphoprotein phosphatases - reverse PKA-mediated phosphorylation
- Receptor internalization - receptor is taken into the cell and degraded (contributes to down-regulation)
- GTPase activity of the αs subunit - hydrolyzes GTP → GDP, returning the G protein to its inactive state
Visual: Thyroid Hormone Mechanism
- Costanzo Physiology, 7th Ed., Chapter 9 - Endocrine Physiology, pp. 403-420
- Katzung's Basic and Clinical Pharmacology, 16th Ed., Chapter 2 - Intracellular Receptors
- Harrison's Principles of Internal Medicine, 22E, Thyroid Hormone Action