


Describe the structure of human cell with labelled diagram the function of organelles and cellular transportation in 2000 words tell me where to add a structure of what in the answer
labelled diagram of human cell organelles nucleus mitochondria
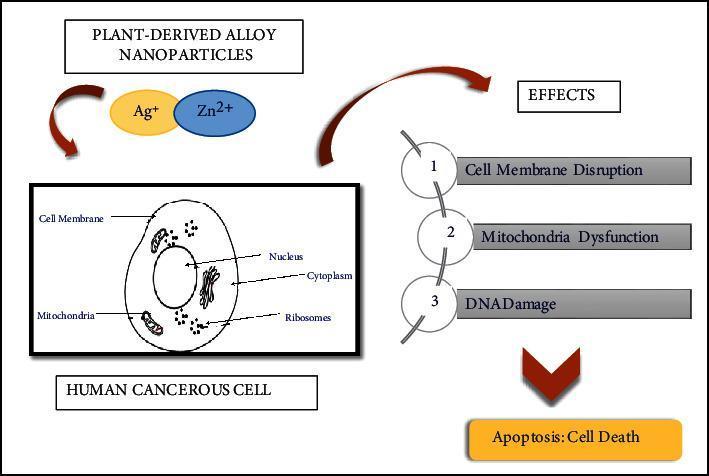
This pathophysiology diagram illustrates the mechanism of action of plant-derived silver (Ag+) and zinc (Zn2+) alloy nanoparticles on human cancerous cells. The flow chart begins with the bimetallic nanoparticles interacting with a depicted human cancerous cell containing labeled organelles, including the nucleus, mitochondria, ribosomes, cytoplasm, and cell membrane. The diagram delineates a three-step cascade of adverse effects: (1) Cell Membrane Disruption, (2) Mitochondria Dysfunction, and (3) DNA Damage. These interconnected cellular stressors lead to a final pathological outcome: Apoptosis (programmed cell death). The visual serves as an educational resource to explain the cytotoxic potential of green-synthesized nanotechnology in oncology, specifically demonstrating how metal-ion combinations induce intracellular damage and systemic cell death in malignant lines.
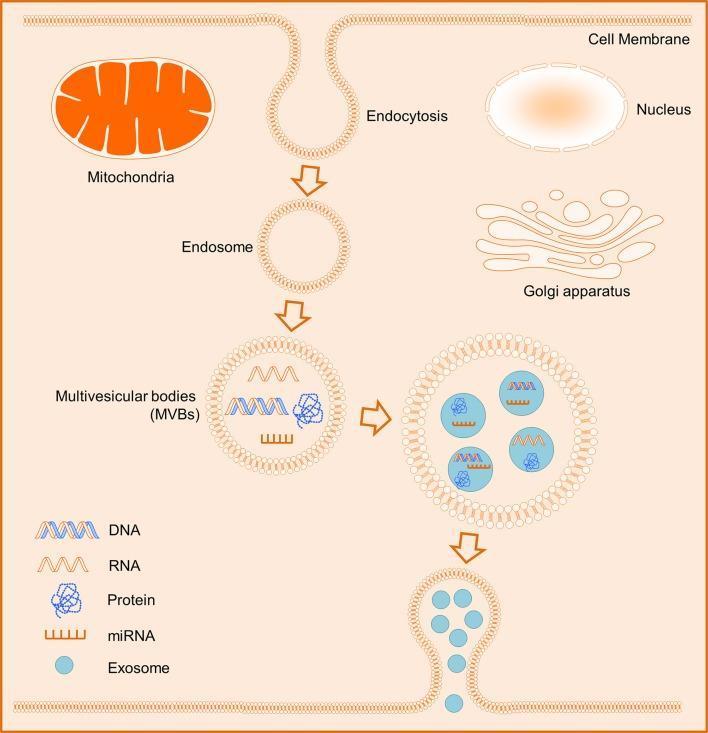
This medical pathophysiology diagram illustrates the biogenesis of exosomes within a human cell. The schematic depicts key organelles including the nucleus, mitochondria with distinct cristae, and the Golgi apparatus. The process of exosome formation begins at the plasma membrane via endocytosis, leading to the creation of an early endosome. This endosome matures into a multivesicular body (MVB) through inward budding of the endosomal membrane. The MVB is shown encapsulating diverse molecular cargo, specifically DNA, RNA, miRNA, and proteins, which are organized into intraluminal vesicles. The final stage demonstrates the MVB fusing with the cell membrane, releasing these internal vesicles into the extracellular space as exosomes. The diagram serves as an educational tool for understanding cellular signaling pathways, paracrine communication, and the transport of genetic and proteomic material between cells. Key labels and a legend identify the molecular components and structural stages of the endocytic pathway.
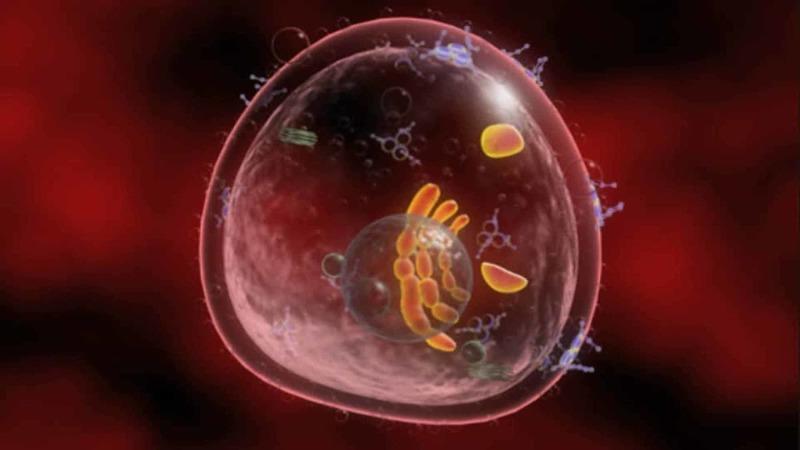
This computer-processed optical coherence tomography (OCT) image provides a detailed anatomical diagram of a T lymphocyte. The cell is depicted as a three-dimensional, semi-spherical structure enclosed by a transparent plasma membrane. Small, blue filamentous structures, representing surface receptors or protein chains, extend from the membrane into the dark reddish extracellular environment. Internally, the cytoplasm contains a distinct, centrally located spherical nucleus containing orange-colored tubular chromatin or nucleolar components. Various other organelles are visible within the cytoplasmic space, including yellow bean-shaped structures likely representing mitochondria and smaller vesicular bodies. The visual focus is on the spatial relationship between the intracellular compartments and the surrounding fluid environments, illustrating the biological concept of cellular mechanotransduction and the influence of hydrostatic pressure on cell morphology. This pedagogical material is designed for advanced immunology or cellular biology contexts, specifically highlighting the T cell's structural adaptation to fluidic dynamics.
phospholipid bilayer plasma membrane structure diagram
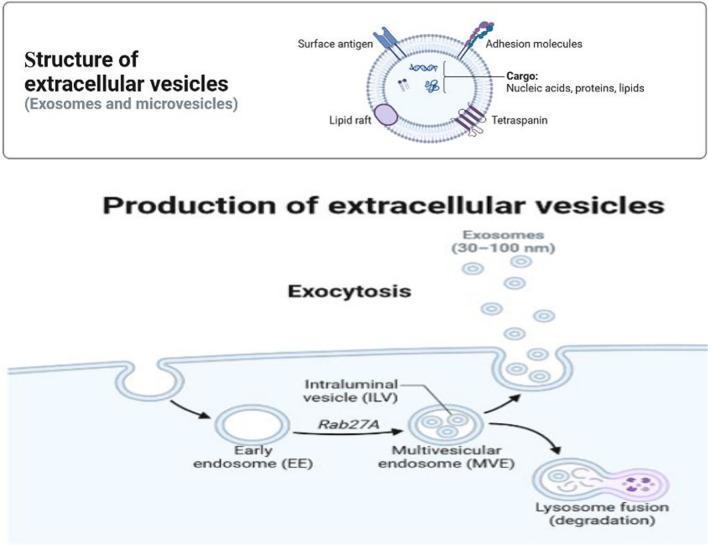
A medical educational diagram illustrating the structure and biogenesis of extracellular vesicles (exosomes and microvesicles). The top panel shows a high-magnification cross-section of an individual vesicle, highlighting its phospholipid bilayer membrane containing surface antigens, adhesion molecules, tetraspanins, and lipid rafts. The internal lumen is shown carrying cargo such as nucleic acids, proteins, and lipids. The bottom panel depicts the cellular production pathway. It begins with the internalization of the plasma membrane to form an early endosome (EE), which matures into a multivesicular endosome (MVE) or multivesicular body (MVB) containing intraluminal vesicles (ILV). This maturation step is annotated with the regulatory protein Rab27A. The diagram shows two possible fates for the MVE: fusion with the plasma membrane to release exosomes (30–100 nm) into the extracellular space via exocytosis, or fusion with a lysosome for cargo degradation. The illustration uses standard biomedical iconography to teach cellular signaling and transport mechanisms.
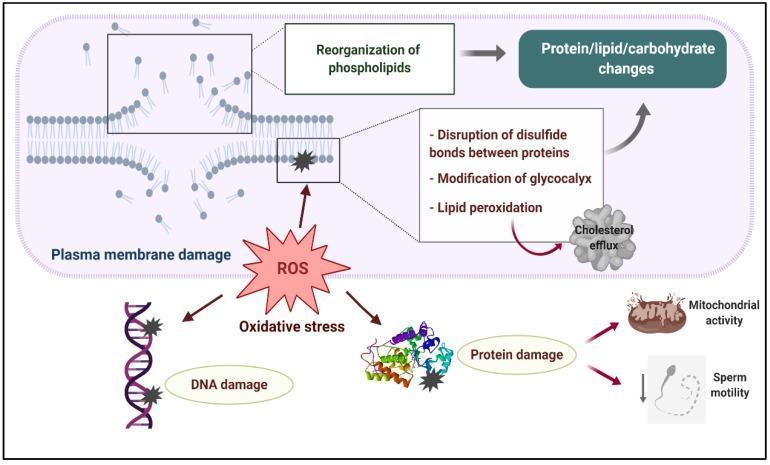
This pathophysiology diagram illustrates the cellular mechanisms of oxidative stress-induced damage in human sperm cells, specifically during cryopreservation processes. The central element is a Reactive Oxygen Species (ROS) starburst indicating the initiation of oxidative stress. The diagram branches into two main pathways of cellular injury. The upper section details 'Plasma membrane damage', showing a phospholipid bilayer undergoing structural disruption. Specific molecular processes highlighted include the reorganization of phospholipids, lipid peroxidation leading to cholesterol efflux, disruption of protein disulfide bonds, and modification of the glycocalyx. These changes result in generalized protein, lipid, and carbohydrate alterations. The lower section illustrates 'Oxidative stress' impacting deeper cellular structures: genomic DNA damage (depicted as a double helix with lesion markers) and protein damage (shown as a misfolded tertiary structure). The functional consequences of protein damage are shown as impaired mitochondrial activity and decreased sperm motility, visually represented by an axoneme/flagellum with a downward arrow. This visual aid is intended for advanced medical education in reproductive physiology and andrology.
cellular transport diffusion osmosis active transport diagram
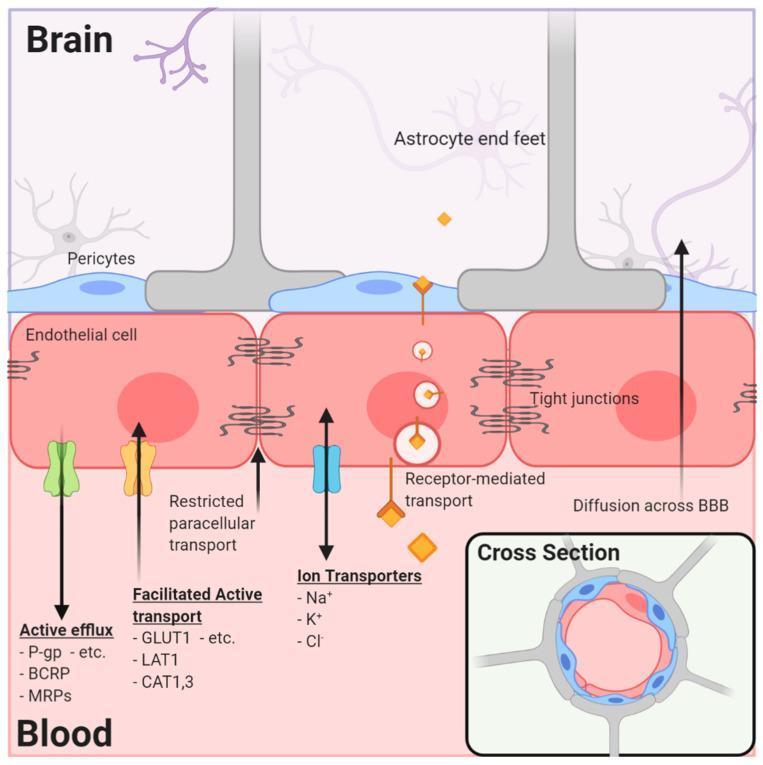
An anatomical and pathophysiology diagram of the human Neurovascular Unit (NVU) and Blood-Brain Barrier (BBB), illustrating cellular architecture and molecular transport mechanisms. The diagram depicts the specialized endothelial cells with their abluminal surface covered by pericytes and astrocytic endfeet. A cross-sectional inset shows the circumferential arrangement of these cells around the vessel lumen. Key structural features include tight junctions, which restrict paracellular transport. Five primary transport mechanisms are detailed: 1. Active Efflux (P-gp, BCRP, MRPs) moving substances from endothelial cells to the blood; 2. Facilitated Active Transport (GLUT1, LAT1, CAT1,3) for nutrient influx; 3. Ion Transporters (Na+, K+, Cl-); 4. Receptor-Mediated Transport involving vesicle trafficking; and 5. Passive Diffusion across the BBB. The illustration highlights the complex signaling and physical barriers required to maintain cerebral homeostasis and presents significant implications for neuro-oncology and CNS drug delivery pharmacology.
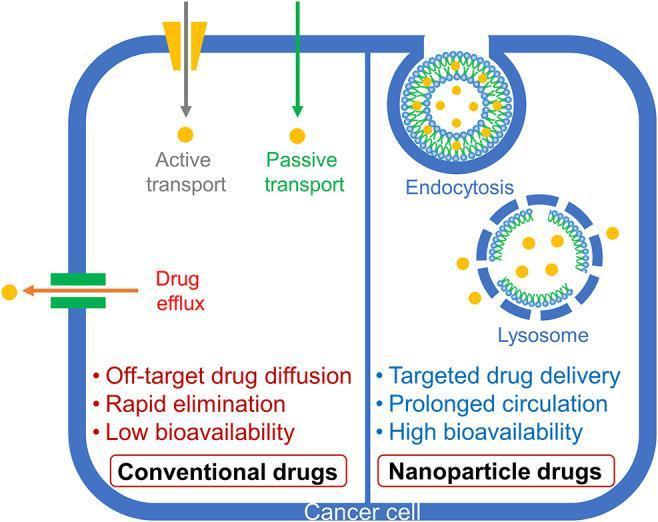
A comparative medical schematic illustrating the cellular uptake and pharmacokinetics of conventional versus nanoparticle-based drug delivery within a cancer cell. The diagram is divided into two sections. The left side depicts 'Conventional drugs' utilizing active transport and passive transport for cellular entry, while also highlighting mechanisms of drug efflux. This delivery method is associated with clinical challenges such as off-target drug diffusion, rapid elimination, and low bioavailability. The right side depicts 'Nanoparticle drugs' entering the cell via endocytosis. The illustration shows a nanoparticle encapsulated within a lysosome, facilitating intracellular release. This method is characterized by therapeutic advantages including targeted drug delivery, prolonged systemic circulation, and high bioavailability. The diagram serves as an educational tool in pharmacology and oncology to demonstrate how nanotechnology can overcome biological barriers and improve drug efficacy while minimizing systemic toxicity.
Structure of the Human Cell, Functions of Organelles, and Cellular Transportation
1. Introduction to the Human Cell
[INSERT DIAGRAM HERE - Figure 3.1: The Simple Cell] Draw a labelled diagram of the human cell showing: plasma membrane, cytoplasm, nucleus, nuclear envelope, nucleolus, chromatin, ribosomes, rough endoplasmic reticulum (with ribosomes), smooth endoplasmic reticulum, Golgi apparatus, mitochondria, lysosomes, centrosome, and centrioles. This should be placed at the start of this section as it provides the reader with an overview of all organelles before they are described individually.
2. The Plasma Membrane
Structure
- A head that is electrically charged and hydrophilic (water-loving)
- A tail that has no charge and is hydrophobic (water-hating)
[INSERT DIAGRAM HERE - Figure 3.2A: The Phospholipid Bilayer] Draw a labelled diagram showing: phospholipid bilayer with heads facing outward and tails facing inward, membrane protein molecules spanning the bilayer, cholesterol molecules embedded in the membrane, and carbohydrate chains attached to the outer surface. Place this diagram immediately after explaining the phospholipid bilayer structure above.
Membrane Proteins
- Some have branched carbohydrate molecules attached to the outside of the cell, giving the cell its immunological identity - these are 'self' markers
- They act as receptors (specific recognition sites) for hormones and other chemical messengers
- Some are enzymes
- Transmembrane proteins form channels filled with water that allow very small, water-soluble ions to cross the membrane
- Some are involved in pumps that actively transport substances across the membrane
3. Organelles
3.1 Nucleus
[INSERT DIAGRAM HERE - Nucleus close-up] Draw a labelled close-up of the nucleus showing: nuclear envelope, nuclear pores, chromatin/DNA, nucleolus, and surrounding cytoplasm. Place this diagram within the nucleus section to help the reader visualise the internal structure separately from the whole-cell diagram.
3.2 Mitochondria
[INSERT DIAGRAM HERE - Mitochondrion electron micrograph / diagram] Draw or reference a diagram of a mitochondrion showing its double membrane and inner folds (cristae). Your textbook Figure 3.6 is a false-colour electron micrograph showing the mitochondrion (orange) and rough endoplasmic reticulum (turquoise). Place this after the mitochondria description.
3.3 Ribosomes
- Free in the cytoplasm (in free units or small clusters) - making proteins for use within the cell, including enzymes required for metabolism
- On the outer surface of the nuclear envelope
- On the rough endoplasmic reticulum - making proteins for export from the cell
3.4 Endoplasmic Reticulum (ER)
- Smooth ER: synthesises lipids and steroid hormones; associated with detoxification of some drugs. Some of its lipids replace and repair the plasma membrane and membranes of organelles
- Rough ER: studded with ribosomes; the site of synthesis of proteins - particularly enzymes and hormones - that are 'exported' from cells by exocytosis
3.5 Golgi Apparatus
[INSERT DIAGRAM HERE - Golgi apparatus electron micrograph] Reference Figure 3.7 from your textbook: the coloured transmission electron micrograph showing the Golgi apparatus in green. Place this image alongside the Golgi apparatus description to show its characteristic stacked, flattened appearance.
3.6 Lysosomes
3.7 Cytoskeleton
- Microfilaments: tiny fibres made of actin, anchored to the inside of the cell membrane, giving the cell support and shape. Actin is also involved in the contractile process in muscle cells
- Microtubules: large, rigid proteins that give the cell mechanical support and provide guidance tracks for internal movement of organelles and chromosomes during cell division
3.8 Centrosome
3.9 Cell Extensions
- Microvilli: tiny projections containing microfilaments that cover the exposed surface of certain cells (e.g. absorptive cells lining the small intestine). They greatly increase surface area, maximising absorption of nutrients
- Cilia: microscopic hair-like projections lying along the free borders of some cells. They beat in unison to move substances along a surface - e.g. moving mucus upwards in the respiratory tract
- Flagella: single, long, whip-like projections containing microtubules, forming the 'tail' of spermatozoa to propel them through the female reproductive tract
4. Transport of Substances Across Cell Membranes
[INSERT DIAGRAM HERE - Figure 3.3: Selective Permeability] Draw three panels showing: (A) particle size - large particles excluded, small ones pass; (B) specific pores/channels - only particles matching the channel size allowed through; (C) pumps and carriers - active export of specific particles. Place this diagram at the start of the transport section to visually establish the principle of selective permeability.
4.1 Passive Transport
- Lipid-soluble materials (e.g. oxygen, carbon dioxide, fatty acids, steroids) cross the membrane by dissolving in the lipid part of the membrane
- Water-soluble materials (e.g. sodium, potassium, calcium) cross the membrane by passing through water-filled channels
[INSERT DIAGRAM HERE - Figure 3.4: Facilitated Diffusion / Active Transport Carrier Proteins] Draw a diagram showing a carrier protein molecule spanning the plasma membrane with extracellular fluid above and intracellular fluid below. Show the molecule changing shape to transport a substance across. Place this here to illustrate facilitated diffusion and then refer to the same diagram again for active transport (below), since the same carrier proteins are used.
4.2 Active Transport
4.3 Bulk Transport
- Pinocytosis ('cell-drinking'): the cell engulfs fluid
- Phagocytosis ('cell-eating'): larger particles (e.g. cell fragments, foreign materials, microbes) are taken into the cell. Lysosomes adhere to the vacuole membrane and release enzymes that digest the contents
[INSERT DIAGRAM HERE - Figure 3.5: Bulk Transport / Phagocytosis and Exocytosis] Draw a 6-step sequence showing: (A) particle outside cell with lysosomes visible; (B) particle engulfed by plasma membrane; (C) formation of a vacuole; (D) fusion of lysosomes with vacuole; (E) digestion of particle by lysosomal enzymes; (F) exocytosis - vesicle fusing with plasma membrane to expel waste. Place this diagram at the end of the bulk transport section.
5. Summary of Diagram Placement
| Diagram | Where to Place |
|---|---|
| Fig 1: Labelled whole cell | Beginning of essay (Section 1) - overview of all structures |
| Fig 2: Phospholipid bilayer | Section 2 after explaining membrane structure |
| Fig 3: Nucleus close-up | Section 3.1 to show nuclear envelope, pores, chromatin |
| Fig 4: Mitochondrion | Section 3.2 to show internal cristae structure |
| Fig 5: Golgi apparatus micrograph | Section 3.5 to show stacked sac appearance |
| Fig 6: Selective permeability (3 panels) | Start of Section 4 - establishes transport principles |
| Fig 7: Carrier protein / active transport | Section 4.1-4.2 - used for both facilitated diffusion and active transport |
| Fig 8: Bulk transport sequence | End of Section 4.3 - phagocytosis to exocytosis steps |
Make it point wise answer and make the answer which source i have given to you for bsc nursing 1st sem
Structure of the Human Cell, Functions of Organelles & Cellular Transportation
(BSc Nursing 1st Semester - Anatomy & Physiology)
PART 1 - INTRODUCTION TO THE HUMAN CELL
- The human body develops from a single cell called the zygote
- The zygote results from fusion of the ovum (female egg cell) and the spermatozoon (male sex cell)
- Cell division follows and cells with different structural and functional specialisations develop
- All individual cells carry the same genetic make-up as the zygote
- Individual cells are too small to be seen with the naked eye
- They can be seen when thin slices of tissue are stained in the laboratory and magnified using a microscope
- A cell consists of a plasma membrane enclosing a number of organelles
- Organelles are suspended in a watery fluid called the cytosol
- Cell contents excluding the nucleus = cytoplasm (cytosol + organelles)
📌 [INSERT DIAGRAM HERE - Fig 3.1: The Simple Cell] A labelled diagram of the whole cell showing all organelles - place this here as an overview before reading further Label: Plasma membrane, Cytoplasm, Nucleus, Nuclear envelope, Nucleolus, Chromatin, Ribosomes, Rough ER (with ribosomes), Smooth ER, Golgi apparatus, Mitochondria, Lysosomes, Centrosome, Centrioles
PART 2 - THE PLASMA MEMBRANE
Structure:
- Consists of two layers of phospholipids (phospholipid bilayer)
- Proteins and sugars are embedded in the bilayer
- Cholesterol (a lipid) is also present
Phospholipid molecule has two parts:
- Head - electrically charged and hydrophilic (water-loving)
- Tail - has no charge and is hydrophobic (water-hating)
Arrangement:
- Arranged like a sandwich
- Hydrophilic heads are aligned on the outer surfaces of the membrane
- Hydrophobic tails form a central water-repelling layer
- These differences influence the transfer of substances across the membrane
📌 [INSERT DIAGRAM HERE - Fig 3.2A: Phospholipid Bilayer] Draw the bilayer sandwich structure showing heads outward, tails inward Label: Head (hydrophilic), Tail (hydrophobic), Membrane protein molecules, Cholesterol molecule, Carbohydrate chains
Membrane Proteins - Functions:
- Proteins that extend all the way through the membrane provide channels that allow passage of electrolytes and non-lipid soluble substances
- Some membrane proteins have branched carbohydrate molecules attached to the outside - these give the cell its immunological identity ('self' markers)
- They act as receptors (specific recognition sites) for hormones and other chemical messengers
- Some are enzymes
- Transmembrane proteins form channels filled with water - allow very small water-soluble ions to cross the membrane
- Some are involved in pumps that transport substances across the membrane
PART 3 - ORGANELLES
- Organelles literally mean 'small organs'
- They have individual and highly specialised functions
- Often enclosed by their own membrane within the cytosol
- Main organelles: nucleus, mitochondria, ribosomes, endoplasmic reticulum, Golgi apparatus, lysosomes, cytoskeleton
3.1 NUCLEUS
- All body cells have a nucleus - except mature erythrocytes (red blood cells)
- Skeletal muscle fibres contain several nuclei
- The nucleus is the largest organelle in the cell
- Contained within the nuclear envelope - a membrane similar to the plasma membrane but with tiny pores through which some substances can pass between it and the cytoplasm
- Contains the body's genetic material in the form of DNA (deoxyribonucleic acid)
- DNA directs all metabolic activities of the cell
- In a non-dividing cell, DNA is present as a fine network of threads called chromatin
- When the cell prepares to divide, chromatin forms distinct structures called chromosomes
- RNA (ribonucleic acid) is also found in the nucleus - involved in protein synthesis
- Within the nucleus is the nucleolus - a roughly spherical structure involved in synthesis and assembly of ribosome components
📌 [INSERT DIAGRAM HERE - Nucleus close-up] Draw a magnified diagram of the nucleus Label: Nuclear envelope, Nuclear pores, Chromatin (DNA), Nucleolus, Cytoplasm surrounding
3.2 MITOCHONDRIA
- Membranous, sausage-shaped structures in the cytoplasm
- Described as the 'power house' of the cell
- Central to aerobic respiration - the process by which chemical energy is made available in the cell
- Energy is released in the form of ATP (adenosine triphosphate)
- Synthesis of ATP is most efficient in the final stages of aerobic respiration
- This process requires oxygen
- The most active cell types have the greatest number of mitochondria - e.g. liver cells, muscle cells, spermatozoa
📌 [INSERT DIAGRAM HERE - Fig 3.6: Mitochondrion] Draw or reference the electron micrograph showing the sausage-shaped mitochondrion with its internal folds (cristae) Label: Outer membrane, Inner membrane, Cristae (inner folds)
3.3 RIBOSOMES
- Tiny granules composed of RNA and protein
- Synthesise proteins from amino acids using RNA as the template
- Found in two locations:
- Free in the cytoplasm (free units or small clusters) - make proteins for use within the cell, including enzymes for metabolism
- On the outer surface of nuclear envelope and on rough endoplasmic reticulum - manufacture proteins for export from the cell
- Metabolic pathways consist of a series of steps, each driven by a specific enzyme
3.4 ENDOPLASMIC RETICULUM (ER)
- An extensive series of interconnecting membranous canals in the cytoplasm
- Two types:
- Synthesises lipids and steroid hormones
- Associated with detoxification of some drugs
- Some lipids produced are used to replace and repair the plasma membrane and organelle membranes
- Studded with ribosomes (giving it a rough appearance)
- Site of synthesis of proteins to be exported from cells - e.g. enzymes and hormones
- These proteins leave the parent cell by exocytosis
3.5 GOLGI APPARATUS
- Consists of stacks of closely folded, flattened membranous sacs
- Present in all cells but larger in cells that synthesise and export proteins
- Proteins move from the ER to the Golgi apparatus
- Proteins are 'packaged' into membrane-bound vesicles
- Vesicles are stored and when needed they move to the plasma membrane and fuse with it
- Contents are then expelled from the cell - this process is called exocytosis
📌 [INSERT DIAGRAM HERE - Fig 3.7: Golgi Apparatus] Reference the electron micrograph showing the Golgi apparatus (green, stacked sac appearance) Label: Stacked flattened sacs, Vesicles budding off, Direction of protein movement from ER
3.6 LYSOSOMES
- Small membranous vesicles pinched off from the Golgi apparatus
- Contain a variety of enzymes
- Break down fragments of organelles and large molecules - e.g. RNA, DNA, carbohydrates, proteins - inside the cell into smaller particles
- These smaller particles are either recycled or exported as waste
- In white blood cells, lysosomes contain enzymes that digest foreign material such as microbes
3.7 CYTOSKELETON
- An extensive network of tiny protein fibres
- Provides an internal support system for the cell
- Also guides the movement of materials around the cell interior
- Tiny fibres made of actin
- Anchored to the inside of the cell membrane
- Give the cell support and shape
- Also involved in the contractile process in muscle cells
- Large, rigid proteins
- Give the cell mechanical support
- Provide guidance tracks for internal movement of:
- Organelles
- Chromosomes during cell division
3.8 CENTROSOME
- Directs organisation of microtubules within the cell
- Consists of a pair of centrioles (small clusters of microtubules)
- Plays an important role in cell division
3.9 CELL EXTENSIONS
- Tiny projections containing microfilaments
- Cover the exposed surface of certain cell types
- e.g. absorptive cells lining the small intestine
- Greatly increase the surface area - maximising absorption of nutrients
- Microscopic hair-like projections containing microtubules
- Lie along the free borders of some cells
- Beat in unison to move substances along the surface
- e.g. move mucus upwards in the respiratory tract
- Single, long, whip-like projections containing microtubules
- Form the 'tails' of spermatozoa
- Propel spermatozoa through the female reproductive tract
PART 4 - TRANSPORT OF SUBSTANCES ACROSS CELL MEMBRANES
- Each cell is enclosed by its plasma membrane - provides a selective barrier
- This property is called selective permeability
- Allows the cell to control entry or exit of many substances
- Regulates the composition of its internal environment
- Small molecules (e.g. water) can pass freely across the membrane by simple diffusion
- Large molecules cannot cross and are confined to interstitial or intracellular fluid
- Specific pores or channels admit certain substances but not others
- The membrane is also studded with specialised pumps or carriers that import or export specific substances
📌 [INSERT DIAGRAM HERE - Fig 3.3: Selective Permeability (3 panels)] Draw 3 panels side by side: Panel A - Particle size: large particles excluded, small ones pass through Panel B - Specific pores/channels: only matching particles allowed through Panel C - Pumps/carriers: active import and export of specific particles Place at start of the transport section
4.1 PASSIVE TRANSPORT
- Occurs when substances cross the semipermeable membrane and move down their concentration gradient (downhill)
- No energy required
4.2 DIFFUSION
- Small molecules diffuse down their concentration gradient
- Two pathways:
- Lipid-soluble materials (e.g. oxygen, carbon dioxide, fatty acids, steroids) - cross by dissolving in the lipid part of the membrane
- Water-soluble materials (e.g. sodium, potassium, calcium) - cross by passing through water-filled channels
4.3 FACILITATED DIFFUSION
- A passive process - no energy required
- Used by substances unable to diffuse unaided through the membrane - e.g. glucose, amino acids
- Specialised protein carrier molecules in the membrane have specific sites that attract and bind the substance
- Works like a lock and key mechanism
- Carrier changes its shape and deposits the substance on the other side of the membrane
- Carrier sites are specific - can be used by only one substance
- There are a finite number of carriers - so there is a limit to the amount transported at any time
- This limit is known as the transport maximum
📌 [INSERT DIAGRAM HERE - Fig 3.4: Carrier Protein Molecule] Draw a diagram showing: carrier protein spanning the plasma membrane, substance binding on extracellular side, carrier changing shape, substance released on intracellular side Label: Extracellular fluid, Plasma membrane, Intracellular fluid, Carrier protein molecule Use this same diagram for Active Transport in the next section
4.4 OSMOSIS
- Passive movement of water down its concentration gradient
- Movement is towards equilibrium
- Occurs across a semipermeable membrane
- No energy required
4.5 ACTIVE TRANSPORT
- Transport of substances up their concentration gradient (uphill)
- i.e. from a lower to a higher concentration
- Requires chemical energy in the form of ATP (adenosine triphosphate)
- ATP drives specialised protein carrier molecules that transport substances across the membrane
- Carrier sites are specific - only one substance can use each carrier
- Rate of transfer depends on the number of sites available
- All cells possess this pump
- Maintains unequal concentrations of Na+ and K+ on either side of the plasma membrane
- May use up to 30% of cellular ATP
- Potassium (K+) - levels are much higher inside the cell (principal intracellular cation)
- Sodium (Na+) - levels are much higher outside the cell (principal extracellular cation)
- These ions tend to diffuse down their concentration gradients - K+ outwards, Na+ inwards
- To maintain their gradients: excess Na+ is constantly pumped out across the membrane in exchange for K+
- This pump indirectly supports other transport mechanisms such as glucose uptake
- It is essential in maintaining the electrical gradient needed to generate action potentials in nerve and muscle cells
4.6 BULK TRANSPORT
- Transfer of particles too large to cross cell membranes by other means
- Occurs by pinocytosis or phagocytosis
- Particles are engulfed by extensions of the cytoplasm, enclosing them in a membrane-bound vacuole
- Allows the cell to bring in fluid
- Larger particles (e.g. cell fragments, foreign materials, microbes) are taken into the cell
- Lysosomes adhere to the vacuole membrane
- Lysosomes release enzymes that digest the contents
- Extrusion of waste material by the reverse process
- Vesicles formed by the Golgi apparatus move to the plasma membrane
- Fuse with plasma membrane and expel their contents
- Any indigestible residues of phagocytosis leave the cell this way
📌 [INSERT DIAGRAM HERE - Fig 3.5: Bulk Transport Sequence] Draw a 6-step sequence (A to F): A - Particle outside cell near lysosomes B - Particle being engulfed by plasma membrane C - Formation of a vacuole D - Fusion of lysosomes with vacuole E - Digestion of the particle by lysosomal enzymes F - Exocytosis - vesicle fusing with plasma membrane, waste expelled Place at end of bulk transport section
QUICK REFERENCE: DIAGRAM PLACEMENT GUIDE
| Diagram No. | What to Draw | Where to Place |
|---|---|---|
| Diagram 1 | Whole cell - all organelles labelled | Part 1 - Introduction |
| Diagram 2 | Phospholipid bilayer structure | Part 2 - Plasma Membrane |
| Diagram 3 | Nucleus close-up (envelope, pores, chromatin) | Part 3.1 - Nucleus |
| Diagram 4 | Mitochondrion with cristae | Part 3.2 - Mitochondria |
| Diagram 5 | Golgi apparatus stacked sacs | Part 3.5 - Golgi Apparatus |
| Diagram 6 | 3-panel selective permeability | Part 4 - Introduction to Transport |
| Diagram 7 | Carrier protein / facilitated diffusion | Part 4.3 - Facilitated Diffusion |
| Diagram 8 | Bulk transport A-F sequence | Part 4.6 - Bulk Transport |
Source: All content is based directly on your textbook - Section 1: The Body and Its Constituents, Chapter 3: Cells and Tissues, pages 42-45 (as shown in the 5 images you provided). This is the standard recommended textbook (Ross and Wilson - Anatomy and Physiology in Health and Illness) used in BSc Nursing 1st Semester.
Make it little bit shorter
Structure of the Human Cell, Functions of Organelles & Cellular Transportation
(BSc Nursing 1st Semester)
PART 1 - INTRODUCTION
- The human body develops from a single cell called the zygote (fusion of ovum + spermatozoon)
- All cells carry the same genetic make-up as the zygote
- Cells are too small to see with the naked eye - visible only under microscope after staining
- A cell = plasma membrane + organelles suspended in cytosol
- Everything inside the cell excluding the nucleus = cytoplasm (cytosol + organelles)
📌 [DIAGRAM 1 HERE - Whole Cell] Label: Plasma membrane, Nucleus, Nuclear envelope, Nucleolus, Chromatin, Ribosomes, Rough ER, Smooth ER, Golgi apparatus, Mitochondria, Lysosomes, Centrosome, Centrioles, Cytoplasm
PART 2 - PLASMA MEMBRANE
Structure:
- Made of two layers of phospholipids (phospholipid bilayer)
- Contains embedded proteins, sugars, and cholesterol
- Each phospholipid has:
- Head - hydrophilic (water-loving), electrically charged
- Tail - hydrophobic (water-hating), no charge
- Arranged like a sandwich - heads face outward, tails face inward (central water-repelling layer)
📌 [DIAGRAM 2 HERE - Phospholipid Bilayer] Label: Hydrophilic head, Hydrophobic tail, Membrane proteins, Cholesterol, Carbohydrate chains
Membrane Proteins - Functions:
- Form channels for passage of electrolytes and non-lipid-soluble substances
- Carry carbohydrate molecules on outer surface - give cell its immunological identity ('self' markers)
- Act as receptors for hormones and chemical messengers
- Some are enzymes
- Some involved in pumps that transport substances across the membrane
PART 3 - ORGANELLES
3.1 NUCLEUS
- Largest organelle; absent in mature RBCs; skeletal muscle has several nuclei
- Enclosed in nuclear envelope with tiny pores for substance exchange
- Contains DNA - directs all metabolic activities
- In non-dividing cells, DNA exists as chromatin; before division forms chromosomes
- Contains RNA - involved in protein synthesis
- Nucleolus - synthesises and assembles ribosome components
📌 [DIAGRAM 3 HERE - Nucleus Close-up] Label: Nuclear envelope, Nuclear pores, Chromatin, Nucleolus
3.2 MITOCHONDRIA
- Sausage-shaped structures; 'power house' of the cell
- Central to aerobic respiration - produce energy as ATP
- Require oxygen for ATP synthesis
- Most numerous in highly active cells - e.g. liver, muscle, spermatozoa
📌 [DIAGRAM 4 HERE - Mitochondrion] Label: Outer membrane, Inner membrane, Cristae (inner folds)
3.3 RIBOSOMES
- Tiny granules of RNA + protein
- Synthesise proteins from amino acids using RNA as template
- Free in cytoplasm - make proteins for use within the cell (e.g. enzymes)
- On rough ER and nuclear envelope - make proteins for export from the cell
3.4 ENDOPLASMIC RETICULUM (ER)
- Interconnecting membranous canals in the cytoplasm; two types:
| Type | Function |
|---|---|
| Smooth ER | Synthesises lipids and steroid hormones; drug detoxification; repairs membranes |
| Rough ER | Studded with ribosomes; synthesises proteins for export (e.g. enzymes, hormones) via exocytosis |
3.5 GOLGI APPARATUS
- Stacks of flattened membranous sacs; present in all cells
- Receives proteins from ER, packages them into vesicles
- Vesicles move to plasma membrane, fuse with it, and expel contents = exocytosis
📌 [DIAGRAM 5 HERE - Golgi Apparatus] Label: Stacked sacs, Vesicles, Direction of protein flow from ER
3.6 LYSOSOMES
- Small membranous vesicles from Golgi apparatus
- Contain digestive enzymes that break down large molecules (DNA, RNA, proteins, carbohydrates)
- Broken particles are either recycled or expelled as waste
- In white blood cells - digest foreign material (microbes)
3.7 CYTOSKELETON
- Network of protein fibres; gives cell support and guides movement of materials
| Component | Structure | Function |
|---|---|---|
| Microfilaments | Actin fibres | Support, cell shape, muscle contraction |
| Microtubules | Large rigid proteins | Mechanical support, guides organelles + chromosomes during division |
3.8 CENTROSOME
- Pair of centrioles (clusters of microtubules)
- Directs organisation of microtubules; key role in cell division
3.9 CELL EXTENSIONS
| Type | Description | Function |
|---|---|---|
| Microvilli | Tiny projections with microfilaments | Increase surface area - maximise nutrient absorption (small intestine) |
| Cilia | Hair-like projections with microtubules | Beat in unison to move substances (e.g. mucus up respiratory tract) |
| Flagella | Long whip-like projections | Propel spermatozoa through female reproductive tract |
PART 4 - TRANSPORT ACROSS CELL MEMBRANES
- Plasma membrane = selectively permeable barrier
- Controls entry and exit of substances, regulating internal environment
- Small molecules (e.g. water) pass freely; large molecules cannot cross
📌 [DIAGRAM 6 HERE - Selective Permeability, 3 panels] Panel A: Particle size | Panel B: Specific channels | Panel C: Pumps and carriers
4.1 PASSIVE TRANSPORT (no energy needed)
- Movement down concentration gradient
- Lipid-soluble substances (O₂, CO₂, fatty acids) - dissolve through lipid part of membrane
- Water-soluble substances (Na+, K+, Ca2+) - pass through water-filled channels
- For substances that cannot diffuse unaided (e.g. glucose, amino acids)
- Uses protein carrier molecules - lock and key mechanism
- Carrier changes shape and deposits substance on the other side
- Carrier is specific to one substance only
- Has a transport maximum (finite number of carriers)
- Passive movement of water only, down its concentration gradient across a semipermeable membrane
📌 [DIAGRAM 7 HERE - Carrier Protein] Label: Extracellular fluid, Carrier protein, Plasma membrane, Intracellular fluid - show shape change
4.2 ACTIVE TRANSPORT (energy required)
- Movement up concentration gradient (low to high concentration)
- Requires ATP energy
- Uses protein carrier molecules specific to one substance
- Present in all cells
- Pumps Na+ out and K+ in against their concentration gradients
- Uses up to 30% of cellular ATP
- Maintains electrical gradient needed for nerve and muscle action potentials
- Also supports glucose uptake
4.3 BULK TRANSPORT
| Process | Meaning | How it works |
|---|---|---|
| Pinocytosis | 'Cell-drinking' | Cell engulfs fluid into a vacuole |
| Phagocytosis | 'Cell-eating' | Large particles (microbes, cell fragments) engulfed; lysosomes digest contents |
| Exocytosis | Reverse process | Vesicles fuse with plasma membrane and expel waste/secretions out of cell |
📌 [DIAGRAM 8 HERE - Bulk Transport Sequence A to F] A: Particle outside cell → B: Engulfed by membrane → C: Vacuole formed → D: Lysosomes fuse → E: Enzymes digest contents → F: Exocytosis - waste expelled
DIAGRAM PLACEMENT SUMMARY
| Diagram | Topic | Location in Answer |
|---|---|---|
| 1 - Whole Cell | All organelles labelled | Part 1 - Introduction |
| 2 - Phospholipid Bilayer | Membrane structure | Part 2 - Plasma Membrane |
| 3 - Nucleus Close-up | Nuclear contents | Part 3.1 - Nucleus |
| 4 - Mitochondrion | Cristae structure | Part 3.2 - Mitochondria |
| 5 - Golgi Apparatus | Stacked sacs | Part 3.5 - Golgi Apparatus |
| 6 - Selective Permeability | 3-panel transport intro | Part 4 - Transport Introduction |
| 7 - Carrier Protein | Facilitated diffusion | Part 4.1 - Facilitated Diffusion |
| 8 - Bulk Transport | Phagocytosis to Exocytosis | Part 4.3 - Bulk Transport |
Source: Directly based on your textbook - Ross & Wilson: Anatomy and Physiology in Health and Illness, Chapter 3: Cells and Tissues, Pages 42-45 - standard BSc Nursing 1st Semester reference.