
Gi notes
What kind of GI notes are you looking for?
What level should the notes be pitched at?
gastrointestinal tract anatomy layers wall diagram
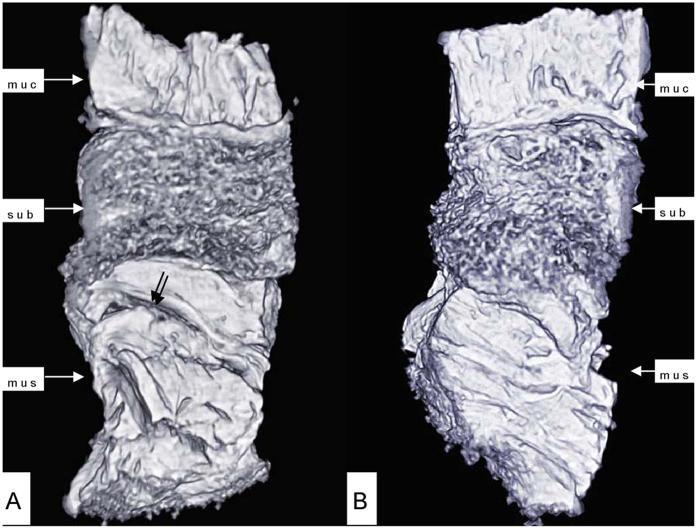
A 3D reconstruction of the human esophagogastric junction (EGJ) wall, obtained via synchrotron-radiation X-ray phase-contrast imaging. The image displays the distinct anatomical layering of the gastrointestinal tract in high detail. Three primary layers are labeled: the mucosa (muc), characterized by a relatively smooth surface; the submucosa (sub), exhibiting a highly textured, honeycomb-like appearance; and the muscular layer (mus), which shows longitudinal strips and folds. Panel A reveals a deep crevice within the muscular layer, indicated by a double arrow, likely representing a fixation artifact. The 3D model demonstrates clear demarcation and spatial arrangement between these tissue planes. This imaging modality provides superior soft-tissue contrast compared to conventional CT or barium studies, allowing for the precise visualization of the internal architecture of the EGJ. It serves as an educational tool for advanced anatomy and diagnostic radiology students to understand the micro-structure of the esophageal wall.
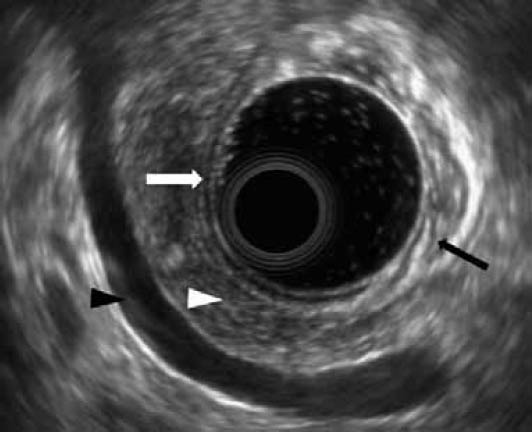
**Imaging Modality:** Electronic radial Endoscopic Ultrasound (EUS). **Anatomical Region:** Upper gastrointestinal tract, specifically the stomach lumen and gastric wall, with visualization of the retroperitoneal space. **Key Landmarks and Visual Features:** * **Gastric Wall:** The image demonstrates the characteristic five-layer sonographic architecture of the gastric wall. These layers include the hyperechoic superficial mucosa, hypoechoic deep mucosa (muscularis mucosae), hyperechoic submucosa, hypoechoic muscularis propria, and the outer hyperechoic serosa/adventitia. * **Gastric Folds:** Intraluminal protrusions of the gastric wall are visible, representing normal rugae. * **Extraluminal Structures:** Adjacent to the gastric wall, the pancreatic body is identified by its homogeneous, finely granular, salt-and-pepper echotexture. The splenic vein is visible as an anechoic, tubular vascular structure positioned posterior to the pancreas. **Clinical Context/Pathology:** The image shows a normal physiological appearance of the gastric wall and surrounding pancreaticosplenic anatomy without evidence of wall thickening, masses, or lymphadenopathy. **Diagnostic Features:** Preservation of the five-layer wall stratification is a key diagnostic indicator used to exclude transmural infiltration by malignancy or deep inflammatory processes.
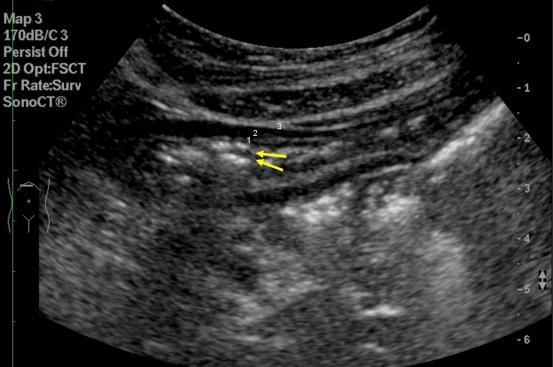
This diagnostic ultrasound image presents a transverse scan of the upper abdomen, specifically illustrating the normal wall stratification of the stomach. The visual demonstrates the characteristic 'gut signature' through three distinct echogenic layers: a hyperechoic inner layer representing the mucosa and submucosa (labeled 1), a middle hypoechoic layer representing the muscularis propria (labeled 2), and a hyperechoic outer layer corresponding to the subserosa (labeled 3). Additionally, the image displays prominent ring-down artifacts, indicated by yellow arrows, which are classic ultrasonographic signs of intraluminal gas. This comparison is useful in gastroenterology and radiology for differentiating normal gastric anatomy from pathological wall thickening or loss of stratification. The image serves as an educational reference for transabdominal sonographic evaluation of the gastrointestinal tract.
small intestine villi absorption histology
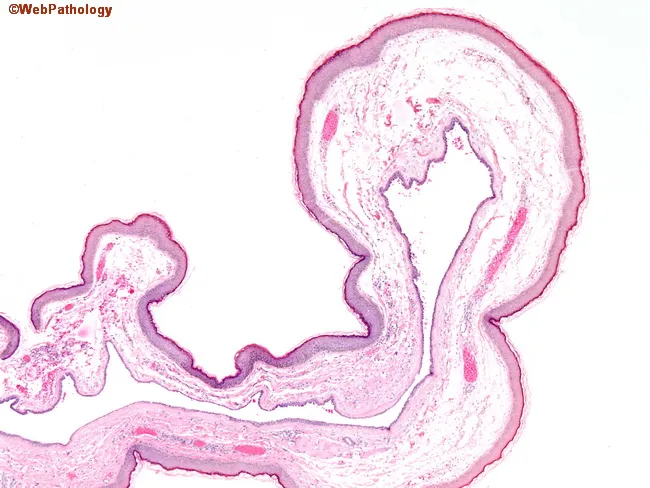
This histopathology image depicts a paraffin-embedded small intestinal mucosa section stained with Hematoxylin and Eosin (H&E), captured at a low-to-mid magnification to emphasize overall villous architecture. The tissue shows finger-like villi emanating from the lamina propria, with closely apposed, tall mucosal folds consistent with villous mucosa of the small intestine. The surface epithelium appears as simple columnar enterocytes with scattered goblet cells, and the absorptive cell brush border is not resolved at this scale. The lamina propria contains loose connective tissue with a sparse vascular network, and the muscularis mucosae is present as a thin boundary beneath the mucosal layer. No overt architectural distortion, crypt branching, or dysplastic glands are evident in the visible fields; there is no clear inflammatory infiltrate or edema highlighted at this magnification. The image emphasizes normal or near-normal mucosal pattern, suitable as a baseline reference for comparison with samples showing villous atrophy, blunting, or neoplastic villiform growth. This slide is relevant for routine evaluation of malabsorption syndromes, celiac disease workups, polyps with villous features, or educational demonstrations of normal intestinal histology. Accurate interpretation requires correlating endoscopy findings, patient history, and additional sections to differentiate normal variants from pathology.
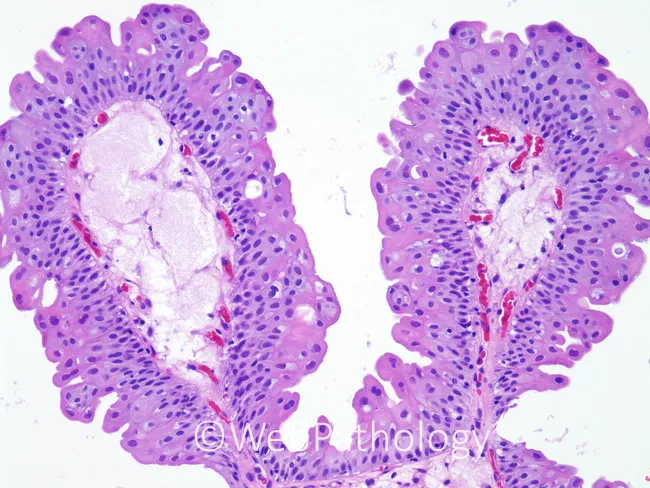
Light microscopy of hematoxylin and eosin stained small intestinal mucosa, prepared as longitudinal sections, displaying the mucosal folds or villi characteristic of the jejunal/ileal region. Each villus presents a tall, brush-border–bearing epithelium with basally positioned nuclei in enterocytes and scattered goblet cells producing mucin. The apical surface is densely stained, while goblet cells appear pale to vacuolated. The villous cores comprise loose lamina propria with scant capillaries and occasional lymphocytes, and a thin muscularis mucosae underneath is not readily resolved at this magnification. The overall architecture is preserved, with uniform crypts at the base, no crypt hyperplasia, and no plasmacytosis or lymphocytic infiltrate. There is no submucosal edema or inflammatory exudate; vessels and stromal tissue appear normal, and there is no evidence of villous blunting or villous atrophy. These features correspond to normal mucosal histology of the small intestine in health or in control specimens. This image serves as a reference standard for educational comparison, enabling recognition of normal mucosal architecture and the distinction from enteropathies such as celiac disease, inflammatory bowel disease, infectious enteritis, or malabsorption syndromes. It can assist in diagnostic training, multidisciplinary case discussions, and slide-based pathology curricula, and provides a baseline for morphologic correlation with clinical symptoms and laboratory tests.
stomach anatomy gastric glands peptic ulcer
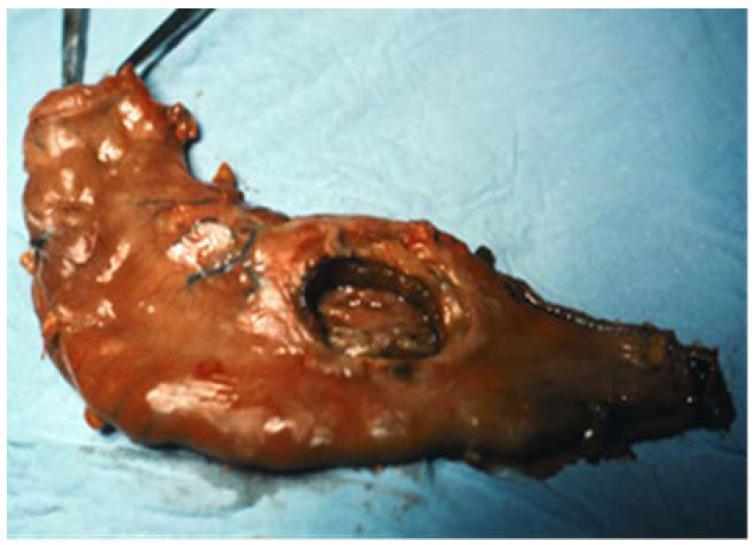
Clinical photograph of a macro-surgical specimen following a quasi-total gastrectomy. The specimen displays the gross anatomy of the stomach, characterized by a predominantly reddish-brown, glistening serosal surface with irregular texture. Centrally located in the median third of the gastric body is a prominent, large, benign chronic giant ulcer, measuring approximately 5 cm in diameter. The ulcer is deeply excavating and penetrative, exhibiting well-defined but irregular, slightly raised borders and a dark, necrotic-appearing base. The surrounding gastric wall shows signs of secondary inflammatory changes. This visual demonstrates a severe complication of peptic ulcer disease where the depth of the lesion indicated penetration into adjacent structures, such as the liver, necessitating radical surgical intervention for management. The specimen serves as an educational example of macroscopic pathology in chronic gastric ulceration and the indications for extensive gastric resection.
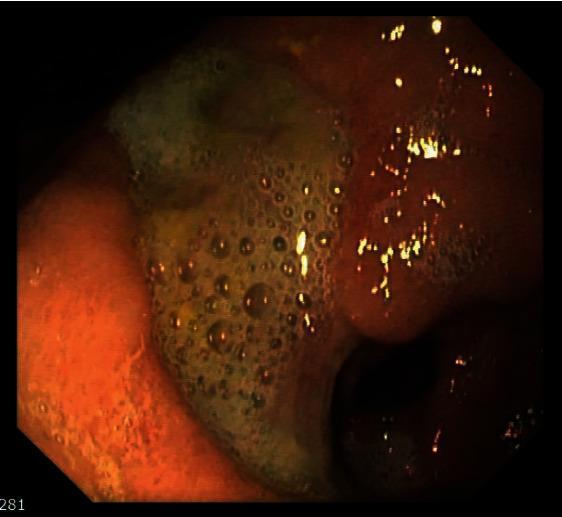
This endoscopic image shows the internal surface of the stomach, specifically focusing on the gastric antrum and prepyloric region. The central feature is a large, irregularly shaped, deep gastric ulcer. The ulcer bed is covered with a yellowish-white fibrinous exudate and exhibits numerous air bubbles, which are common in gastric secretions. The surrounding gastric mucosa is erythematous and edematous, indicating active inflammation (chronic active gastritis). In the background, the pylorus is visible but appears distorted and narrowed, suggestive of a potential stricture or functional obstruction caused by the proximity of the large ulcer and associated inflammatory swelling. This clinical photograph is highly relevant for teaching about Peptic Ulcer Disease (PUD), gastroduodenal anatomy during esophagogastroduodenoscopy (EGD), and the visual manifestations of severe gastric infections such as Cytomegalovirus (CMV) in the gastrointestinal tract.
Gastrointestinal System - Complete Notes
1. OVERVIEW AND FUNCTIONS
- Movement of food through the tract (motility)
- Secretion of digestive juices
- Digestion of food into absorbable molecules
- Absorption of water, electrolytes, and digestion products
- Regulation by local, nervous, and hormonal systems
2. ANATOMY OF THE GI WALL
| Layer | Key Features |
|---|---|
| Serosa | Outermost; connective tissue + mesothelium |
| Longitudinal muscle | Outer smooth muscle; shortens gut segments |
| Circular muscle | Inner smooth muscle; narrows lumen; main layer for peristalsis |
| Submucosa | Dense connective tissue; contains submucosal (Meissner's) plexus, blood vessels, lymphatics |
| Mucosa | Innermost; epithelium + lamina propria + muscularis mucosae |
GI Smooth Muscle as a Syncytium
- Individual smooth muscle fibers: 200-500 µm long, 2-10 µm diameter
- Connected by gap junctions - low-resistance channels allowing ion flow between cells
- Functions as a syncytium: action potentials propagate throughout the muscle mass
- Travels faster longitudinally than circumferentially
- Guyton and Hall, p. 772
3. ENTERIC NERVOUS SYSTEM (ENS)
Myenteric (Auerbach's) Plexus
- Located between longitudinal and circular muscle layers
- Controls GI movements (motility)
Submucosal (Meissner's) Plexus
- Located in the submucosa
- Controls secretion and local blood flow
Autonomic Control
| Division | Origin | Effect |
|---|---|---|
| Parasympathetic (cranial) | Vagus nerve (CN X) - esophagus to mid-colon | Increases ENS activity → increases motility + secretion |
| Parasympathetic (sacral) | S2-S4 → pelvic nerves | Supplies distal colon, rectum, anus; mediates defecation reflex |
| Sympathetic | T5-L2 → celiac & mesenteric ganglia | Inhibits motility and secretion; norepinephrine release |
Key point: Strong sympathetic stimulation can block food movement through the entire GI tract. - Guyton and Hall, p. 779
4. GASTROINTESTINAL MOTILITY
Types of Movement
| Type | Description | Location |
|---|---|---|
| Peristalsis | Sequential contraction behind + relaxation ahead of a bolus; propels content aborally | Throughout GI tract |
| Segmentation | Rhythmic, non-propulsive contractions that mix content | Small intestine |
| Haustration | Slow segmenting contractions | Large intestine |
| Mass movements | Powerful propulsion 1-3x/day | Large intestine |
| Migrating Motor Complex (MMC) | "Housekeeper wave" between meals; 90-min cycles | Stomach → ileum |
Electrical Activity
- Slow waves (basic electrical rhythm): set by interstitial cells of Cajal (ICC) in the circular muscle layer
- Stomach: ~3/min
- Duodenum: ~12/min
- Ileum: ~8/min
- Spike potentials: superimposed on slow waves; trigger actual muscle contraction
- Slow waves do NOT cause contraction themselves - they only set the maximum frequency
5. HORMONAL CONTROL OF THE GI TRACT
| Hormone | Cell Type | Stimulus | Major Actions |
|---|---|---|---|
| Gastrin | G cells (antrum, duodenum) | Protein, distension, vagal (ACh); inhibited by acid | ↑ Gastric acid secretion; ↑ mucosal growth |
| Cholecystokinin (CCK) | I cells (duodenum, jejunum, ileum) | Fat, protein, acid | ↑ Pancreatic enzymes; ↑ bile release (gallbladder contraction); ↓ gastric emptying |
| Secretin | S cells (duodenum, jejunum, ileum) | Acid, fat | ↑ Pancreatic bicarbonate; ↑ biliary bicarbonate; ↓ gastric acid; ↓ gastric emptying |
| GIP (Glucose-dependent Insulinotropic Peptide) | K cells (duodenum, jejunum) | Protein, fat, carbohydrate | ↑ Insulin secretion; ↓ gastric acid; ↓ food intake |
| Motilin | M cells (duodenum, jejunum) | Fat, acid, nervous | ↑ Gastric + intestinal motility; triggers MMC |
| GLP-1 | L cells (duodenum → colon) | Fat, protein, carbohydrate | ↑ Insulin (glucose-dependent); ↓ gastric emptying; ↓ food intake |
6. DIGESTION
Carbohydrate Digestion
| Stage | Location | Enzyme | Substrate → Product |
|---|---|---|---|
| Salivary | Mouth | Salivary amylase (ptyalin) | Starch → dextrins, maltose |
| Gastric | Stomach | (amylase inactivated by acid) | — |
| Pancreatic | Small intestine | Pancreatic amylase | Starch → maltose, maltotriose |
| Brush border | Small intestine | Maltase, sucrase, lactase | Disaccharides → monosaccharides |
Protein Digestion
| Stage | Location | Enzyme/Source | Notes |
|---|---|---|---|
| Gastric | Stomach | Pepsin (from pepsinogen, activated by HCl) | Endopeptidase; cleaves at aromatic AAs |
| Pancreatic | Small intestine | Trypsin, chymotrypsin, elastase (endopeptidases); carboxypeptidases A & B (exopeptidases) | Trypsin activates other zymogens |
| Brush border | Small intestine | Aminopeptidases, dipeptidases | → Free amino acids, di/tripeptides |
Fat (Lipid) Digestion
- Lingual lipase (minor, mouth/stomach)
- Emulsification by bile salts in duodenum - breaks large fat droplets into smaller ones (increases surface area)
- Pancreatic lipase (with colipase) cleaves triglycerides → 2-monoglycerides + 2 fatty acids
- Micelle formation - bile salts surround products; transport them to brush border
- Absorption into enterocytes → re-esterification → chylomicrons → lymphatics (lacteals)
7. ABSORPTION
- Circular folds (plicae circulares) - 3x increase
- Villi - 10x increase
- Microvilli (brush border) - 20x increase
Nutrient Absorption Sites
| Nutrient | Primary Site | Mechanism |
|---|---|---|
| Glucose, galactose | Duodenum, jejunum | SGLT-1 (Na-coupled active transport) |
| Fructose | Duodenum, jejunum | GLUT-5 (facilitated diffusion) |
| Amino acids | Duodenum, jejunum | Na-coupled cotransporters (multiple) |
| Fat-soluble vitamins (A, D, E, K) | Small intestine | Micellar absorption (passive) |
| Vitamin B12 | Terminal ileum | Requires intrinsic factor (from parietal cells) |
| Iron | Duodenum | Ferrous (Fe²⁺) form via DMT-1; hepcidin regulated |
| Calcium | Duodenum | Calcitriol-dependent active transport |
| Bile salts | Terminal ileum | Active transport (enterohepatic circulation) |
| Water | Small + large intestine | Osmosis following solute absorption |
Electrolyte and Water Absorption
- Small intestine absorbs ~7-8 liters/day
- Large intestine absorbs ~1.5-2 liters/day (max capacity ~5-6 L)
- Na⁺ absorption drives most water absorption osmotically
- Aldosterone increases Na⁺ absorption in the colon
8. GASTRIC SECRETION
| Cell Type | Location | Secretion | Function |
|---|---|---|---|
| Chief (peptic) cells | Fundus/body | Pepsinogen | Precursor to pepsin (activated by HCl) |
| Parietal (oxyntic) cells | Fundus/body | HCl, Intrinsic factor | Acid: kills bacteria, activates pepsin; IF: B12 absorption |
| G cells | Antrum | Gastrin | Stimulates parietal cells |
| D cells | Antrum | Somatostatin | Inhibits gastrin (paracrine) |
| Mucous cells | Neck + surface | Mucus, HCO₃⁻ | Protects mucosa from acid |
Phases of Gastric Secretion
| Phase | Trigger | Mediator | % of Total Secretion |
|---|---|---|---|
| Cephalic | Sight, smell, thought, taste of food | Vagus (ACh) | ~30% |
| Gastric | Food in stomach: distension, protein | Gastrin, ACh, histamine | ~60% |
| Intestinal | Acid/fat/hypertonic chyme in duodenum | Secretin, CCK, GIP, enterogastrone | ~10% (inhibitory) |
9. PANCREATIC AND BILIARY SECRETION
Pancreas
- Acinar cells: secrete digestive enzymes (lipase, amylase, proteases as inactive zymogens)
- Ductal cells: secrete bicarbonate-rich fluid (neutralizes duodenal acid)
- Trypsinogen activated by enterokinase (from duodenal brush border) → trypsin → activates other zymogens
- Stimulated by: CCK (enzyme secretion), secretin (bicarbonate)
Bile
- Produced by hepatocytes, stored and concentrated in gallbladder
- Contains: bile salts, lecithin, cholesterol, bilirubin, water, electrolytes
- Bile salts: emulsify fats, form micelles; recycled via enterohepatic circulation (terminal ileum)
- Released by gallbladder contraction in response to CCK
- ~95% of bile salts reabsorbed; 5% lost in feces (compensated by hepatic synthesis)
10. LARGE INTESTINE - COLON
Functions
- Water and electrolyte absorption
- Compaction of feces
- Microbial fermentation (short-chain fatty acids from fiber)
- Storage and controlled evacuation
Motility
- Haustrations: segmental contractions; mix content; slow
- Mass movements: strong propulsive contractions, 1-3x/day; triggered by gastrocolic reflex (eating → colonic activity)
Defecation Reflex
- Rectal distension → afferent signals via pelvic nerves
- Reflex relaxation of internal anal sphincter (smooth muscle, involuntary)
- Voluntary relaxation of external anal sphincter (skeletal muscle)
- Valsalva maneuver + levator ani contraction expels feces
11. GI BLOOD FLOW
- GI tract receives ~20-25% of cardiac output postprandially
- Splanchnic circulation: celiac artery (stomach, liver, spleen, duodenum), superior mesenteric artery (small intestine, proximal colon), inferior mesenteric artery (distal colon, rectum)
- Local metabolic factors (↓O₂, ↑CO₂, adenosine) cause functional hyperemia after a meal
- Sympathetic stimulation causes vasoconstriction → can divert blood away from gut in "fight or flight"
12. GI MICROBIOTA
- ~100 trillion microorganisms; predominantly in large intestine
- Composition: ~1000 species; mainly Firmicutes and Bacteroidetes
- Functions:
- Ferment undigested carbohydrates → short-chain fatty acids (SCFAs: butyrate, propionate, acetate)
- Synthesize vitamin K and some B vitamins
- Competitively inhibit pathogens
- Train and modulate immune system (70% of immune cells in gut-associated lymphoid tissue [GALT])
- Influence gut-brain axis
- Disruption (dysbiosis): linked to IBD, IBS, obesity, diabetes, liver disease
13. PATHOPHYSIOLOGY OF COMMON GI DISORDERS
Achalasia
- Failure of lower esophageal sphincter (LES) to relax during swallowing
- Cause: damage to myenteric plexus neurons in the distal esophagus → loss of inhibitory innervation
- Features: dysphagia (solids + liquids), megaesophagus, regurgitation, aspiration risk
- Treatment: LES dilation, botulinum toxin injection, Heller myotomy, POEM
Gastroesophageal Reflux Disease (GERD)
- LES incompetence → acid reflux into esophagus
- Symptoms: heartburn, regurgitation, water brash, chronic cough
- Complications: erosive esophagitis, Barrett's esophagus (metaplasia: squamous → columnar), adenocarcinoma risk
- Treatment: lifestyle changes, PPIs (omeprazole, lansoprazole), anti-reflux surgery
Peptic Ulcer Disease (PUD)

- Ulceration of mucosa due to imbalance between aggressive (HCl, pepsin) and protective (mucus, HCO₃⁻, prostaglandins) factors
- H. pylori (most common cause - 80-90% of duodenal ulcers): urease-producing gram-negative rod; damages mucosal barrier
- NSAIDs: inhibit COX-1 → ↓ prostaglandin synthesis → ↓ mucus/HCO₃⁻ production
- Gastric ulcers: usually on lesser curvature; pain worsened by food
- Duodenal ulcers: most common; pain relieved by food (antacids); nocturnal pain
- Complications: bleeding, perforation, gastric outlet obstruction
- Treatment: PPI + clarithromycin + amoxicillin (triple therapy for H. pylori)
Gastritis
- Type A (autoimmune): anti-parietal cell antibodies; fundus/body involved; leads to pernicious anemia (no IF → no B12 absorption); risk of gastric carcinoma
- Type B (H. pylori): antrum predominant; most common type; risk of MALT lymphoma, gastric carcinoma
Inflammatory Bowel Disease (IBD)
| Feature | Crohn's Disease | Ulcerative Colitis |
|---|---|---|
| Distribution | Anywhere mouth to anus; skip lesions | Rectum upward; continuous |
| Depth | Transmural | Mucosal/submucosal only |
| Gross appearance | Cobblestone; "string sign" on barium; fistulae, strictures | Pseudopolyps; lead-pipe colon |
| Histology | Non-caseating granulomas | Crypt abscesses, goblet cell depletion |
| Bowel involvement | Terminal ileum most common | Colon only |
| Complications | Fistulae, abscesses, strictures, malabsorption | Toxic megacolon, colon cancer (risk ↑ with pancolitis and duration) |
| Treatment | Steroids, azathioprine, anti-TNF (infliximab), vedolizumab | 5-ASA (mesalazine), steroids, anti-TNF, surgery (curative) |
Celiac Disease
- Immune-mediated enteropathy triggered by gluten (gliadin fraction) in genetically susceptible individuals (HLA-DQ2/DQ8)
- Villous atrophy, crypt hyperplasia, increased intraepithelial lymphocytes
- Symptoms: malabsorption, steatorrhea, weight loss, bloating, iron-deficiency anemia, fatigue
- Extraintestinal: dermatitis herpetiformis, osteoporosis, infertility, peripheral neuropathy
- Diagnosis: anti-tissue transglutaminase (anti-tTG) IgA antibodies; confirmed by duodenal biopsy
- Treatment: strict lifelong gluten-free diet
Irritable Bowel Syndrome (IBS)
- Functional disorder: altered gut motility + visceral hypersensitivity (no structural pathology)
- Rome IV criteria: recurrent abdominal pain ≥1 day/week for 3 months, associated with ≥2 of: change in stool frequency, change in stool form, relief/change with defecation
- Subtypes: IBS-C (constipation predominant), IBS-D (diarrhea predominant), IBS-M (mixed)
- Treatment: dietary (low-FODMAP diet), antispasmodics, loperamide (for IBS-D), linaclotide (IBS-C)
Colorectal Cancer (CRC)
- Second most common cancer death in Western countries
- Adenoma-carcinoma sequence: normal mucosa → hyperplastic polyp → tubular adenoma → villous adenoma → carcinoma
- Key mutations: APC (familial adenomatous polyposis), KRAS, p53, SMAD4
- Symptoms: change in bowel habit, rectal bleeding, abdominal pain, iron-deficiency anemia, weight loss
- Right-sided: occult bleeding, anemia, bulky tumors; Left-sided: obstruction, change in stool caliber
- Screening: colonoscopy from age 45 (or 40-45 in high-risk groups); fecal occult blood test (FOBT)
- Treatment: surgery ± adjuvant chemotherapy (FOLFOX, FOLFIRI); targeted: bevacizumab, cetuximab
14. QUICK REFERENCE: LAYERS & NERVE PLEXUSES
Lumen
  ↓
Mucosa         ← Epithelium + Lamina propria + Muscularis mucosae
Submucosa      ← Meissner's plexus (secretion + blood flow)
Circular muscle
  ↕             ← Auerbach's (myenteric) plexus (motility)
Longitudinal muscle
Serosa
15. KEY FORMULAS AND MNEMONICS
- Gastrin - G cells - antrum
- Secretin - S cells - duodenum
- CCK - I cells - duodenum/jejunum
- Motilin - M cells - duodenum/jejunum
- Barrett's esophagus
- Erosive esophagitis
- Adenocarcinoma
- Protective: Cyclin (prostaglandins), Alcaline mucus, Mucus, Prostaglandins
- Aggressive: HCl, Encyme (pepsin), P. pylori/NSAIDs
Summary Table: Digestive Enzymes
| Enzyme | Source | Substrate | Product |
|---|---|---|---|
| Salivary amylase | Parotid glands | Starch | Dextrins, maltose |
| Pepsin | Chief cells (pepsinogen + HCl) | Proteins | Polypeptides |
| Pancreatic amylase | Pancreatic acini | Starch | Maltose |
| Trypsin | Pancreas (trypsinogen + enterokinase) | Proteins | Polypeptides |
| Chymotrypsin | Pancreas | Proteins | Polypeptides |
| Pancreatic lipase | Pancreas | Triglycerides | Fatty acids + 2-monoglyceride |
| Lactase | Brush border | Lactose | Glucose + galactose |
| Sucrase | Brush border | Sucrose | Glucose + fructose |
| Maltase | Brush border | Maltose | Glucose + glucose |
| Enterokinase | Duodenal brush border | Trypsinogen | Trypsin (activates cascade) |
Gi physiology
parietal cell HCl secretion mechanism proton pump
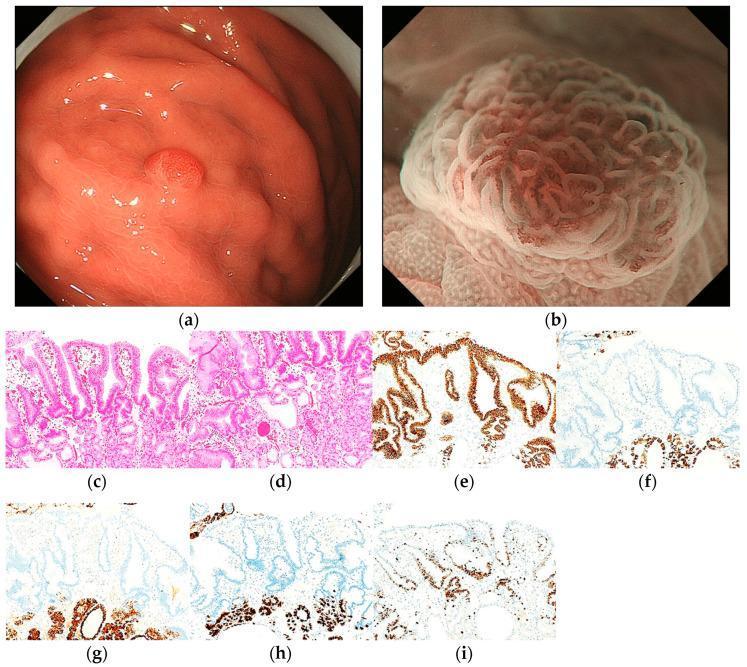
This composite figure illustrates the endoscopic and histopathological features of a proton pump inhibitor-related lesion (PPI-L) with low-grade dysplasia. (a) White-light imaging (WLI) reveals a 6 mm, homogenous reddish, protruded lesion located on the greater curvature of the upper gastric third. (b) Magnifying endoscopy with narrow-band imaging (ME-NBI) demonstrates a regular microvascular (MV) pattern and a regular microsurface (MS) pattern, bordered by a distinct demarcation line. (c, d) H&E stained sections at 100x magnification show parietal cell hyperplasia, foveolar epithelial dilation and elongation, and stromal vascularity. (e–i) Immunohistochemical analysis (100x) displays strong MUC5AC positivity in foveolar epithelial cells, while MUC6 (f), pepsinogen-I (g), and H+/K+-ATPase (h) are negative. (i) Ki-67 immunostaining reveals a high labeling index (80%), indicating significant cellular proliferation. The image serves as an educational reference for differentiating benign-appearing gastric protruded lesions from early gastric cancer using the MESDA-G diagnostic algorithm.
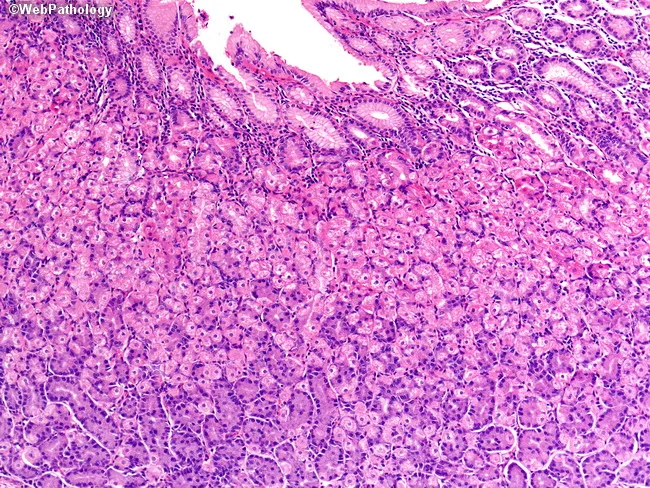
This is a bright-field light microscopy image of fixed gastric mucosa section stained with Hematoxylin and Eosin (H&E). The tissue shows gastric pits with an isthmus and neck populated by conspicuous parietal (oxyntic) cells with abundant eosinophilic cytoplasm and central nuclei. Parietal cells secrete hydrochloric acid and intrinsic factor, essential for digestion and B12 absorption. Deeper in the gland, chief (peptic) cells possess basophilic cytoplasm and secrete pepsinogen. Interspersed neuroendocrine cells release hormones; a stem cell zone resides at the neck, supporting constant epithelial renewal. The overall architecture corresponds to fundic-type oxyntic mucosa with tubular glands arranged in distinct isthmus/neck and base compartments. No overt inflammatory infiltrate or architectural distortion is evident, consistent with normal histology. This image is valuable for teaching gastric histology, differentiating mucous neck cells, parietal cells, chief cells, enteroendocrine cells, and stem cell niches, and for contextualizing pathologies affecting acid secretion, intrinsic factor production, or gastric carcinogenesis in educational and research settings.
intestinal absorption glucose amino acid sodium cotransport enterocyte
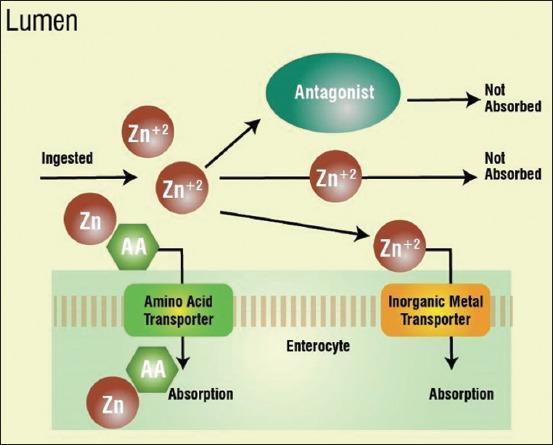
A pathophysiology diagram illustrating the mineral absorption mechanisms within the intestinal lumen and enterocyte, specifically focusing on zinc (Zn/Zn+2). The diagram delineates three primary pathways for ingested minerals. 1) Organic absorption: Zinc (Zn) complexed with amino acids (AA) utilizes a specific Amino Acid Transporter on the enterocyte membrane, leading to successful absorption. 2) Inorganic absorption: Free ionic zinc (Zn+2) utilizes a dedicated Inorganic Metal Transporter to enter the enterocyte. 3) Non-absorption: Ionic zinc (Zn+2) that remains free or interacts with dietary antagonists (e.g., phytates or oxalates, labeled as 'Antagonist') fails to be transported, resulting in a 'Not Absorbed' outcome. The visual contrasts the efficiency of chelated organic minerals versus inorganic forms and highlights the role of competitive inhibition by antagonists. Key anatomical landmarks include the lumen and the apical membrane of the enterocyte. This illustration serves educational purposes in gastroenterology and clinical nutrition regarding bioavailability and trace element metabolism.
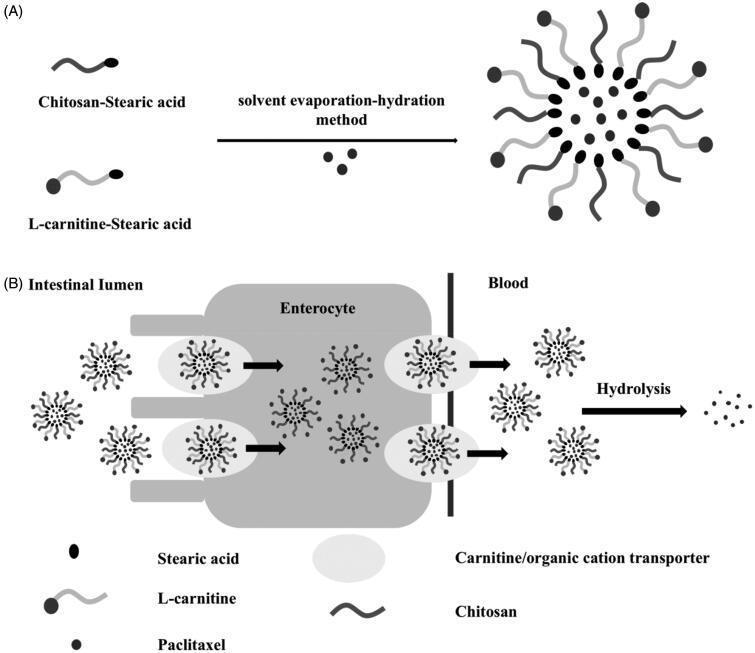
A two-part schematic diagram detailing the preparation and absorption mechanism of paclitaxel-loaded polymeric micelles for oral delivery. (A) Preparation phase: Illustrates the synthesis of PTX-loaded LC-SA/CS-SA micelles using the solvent evaporation-hydration method. Individual components including Chitosan-Stearic acid (CS-SA), L-carnitine-Stearic acid (LC-SA), and paclitaxel molecules are shown self-assembling into a spherical micelle structure with a hydrophobic core and a functionalized outer shell. (B) Absorption mechanism: Depicts the intestinal transport of intact micelles from the intestinal lumen across the enterocyte membrane. The process is facilitated by carnitine/organic cation transporters (OCTN2), represented by oval docking sites on the brush border. Following transepithelial transport, the micelles enter the bloodstream where they undergo hydrolysis, releasing the encapsulated paclitaxel along with stearic acid, L-carnitine, and chitosan components. This illustration demonstrates a targeted drug delivery strategy to improve the bioavailability of lipophilic drugs like paclitaxel via the carnitine transporter pathway.
GI Physiology - Detailed Notes
MODULE 1: GI WALL STRUCTURE & SMOOTH MUSCLE
Wall Layers (Outer → Inner)
Serosa
Longitudinal smooth muscle  ─┐
  [Myenteric / Auerbach's plexus]  ← between these two layers
Circular smooth muscle     ─┘
  [Submucosal / Meissner's plexus]
Submucosa
Mucosa (muscularis mucosae + lamina propria + epithelium)
GI Smooth Muscle - Key Properties
- Fiber dimensions: 200-500 µm long, 2-10 µm diameter
- Bundled in groups of up to 1000 parallel fibers
- Connected by gap junctions → low-resistance ion movement between cells
- Behaves as a functional syncytium: action potential anywhere spreads through entire muscle mass
- Longitudinal layer: propulsion; Circular layer: narrows lumen, drives peristalsis
Electrical Activity
- Not action potentials - undulating changes in resting membrane potential
- Generated by Interstitial Cells of Cajal (ICC) - the "pacemaker cells" of the gut
- Set the maximum frequency of contraction - do NOT cause contraction by themselves
- Region-specific frequencies:
- Stomach: ~3/min
- Duodenum: ~12/min (fastest - generates duodenal-jejunal gradient)
- Ileum: ~8/min
- Colon: ~6/min
- Superimposed on slow waves when they reach threshold (~-40 mV)
- Triggered by stretch, ACh, parasympathetic stimulation, hormones
- Cause actual smooth muscle contraction
- Inhibited by norepinephrine, epinephrine, secretin
Clinical pearl: The slow wave frequency sets the maximum peristaltic rate in each region. Ectopic pacemakers or slow wave disruptions can cause dysmotility. - Guyton & Hall, p. 776
MODULE 2: ENTERIC NERVOUS SYSTEM (ENS)
Two Plexuses
| Plexus | Location | Primary Function |
|---|---|---|
| Myenteric (Auerbach's) | Between longitudinal & circular muscle | Controls motility (peristalsis, segmentation) |
| Submucosal (Meissner's) | Within submucosa | Controls secretion and local blood flow |
Enteric Neurotransmitters
| Function | Transmitter |
|---|---|
| Excitatory (contraction above bolus) | ACh, Substance P |
| Inhibitory (relaxation ahead of bolus) | NO, VIP (vasoactive intestinal peptide) |
Autonomic Control
| System | Origin | Mediator | Effect |
|---|---|---|---|
| Parasympathetic cranial | Vagus (CN X) → esophagus to mid-colon | ACh → ENS activation | ↑ Motility, ↑ secretion |
| Parasympathetic sacral | S2-S4 → pelvic nerves → distal colon, rectum, anus | ACh | Defecation reflex |
| Sympathetic | T5-L2 → celiac + mesenteric ganglia | Norepinephrine (NE) → inhibits ENS | ↓ Motility, ↓ secretion; vasoconstriction |
Note: ~80% of vagal nerve fibers are afferent (gut-to-brain), not efferent. The gut constantly informs the brain. - Guyton & Hall, p. 779
- Mucosal irritation
- Excessive distension
- Specific chemicals in the gut
MODULE 3: GASTROINTESTINAL MOTILITY
Types of Movements
Peristalsis
- The law of the intestine: contraction behind the bolus + relaxation ahead
- Initiated by gut wall distension → myenteric plexus activation
- Travels aborally (mouth → anus) at 2-25 cm/sec
- Depends on intact myenteric plexus; interrupted by nerve damage
Segmentation (Mixing Contractions)
- Rings of circular muscle contract and relax rhythmically
- No net propulsion - mixes chyme with digestive juices
- Dominant movement in small intestine after a meal
- Frequency set by slow waves
Migrating Motor Complex (MMC) - "Housekeeper Wave"
- Occurs during fasting (between meals)
- Cycle every 90-120 minutes
- Phases: I (quiescence) → II (irregular contractions) → III (intense "activity front" sweeping from stomach to ileum)
- Function: sweeps undigested debris, bacteria, and secretions aborally
- Initiated by motilin from duodenum/jejunum
- Interrupted by eating (→ switches to segmentation)
Gastric Motility
- Receptive relaxation: fundus relaxes to accommodate food (mediated by vagus → NO/VIP)
- Tonic contractions: fundus maintains pressure to push food toward antrum
- Antral peristalsis: strong peristaltic waves grind food and push chyme through pylorus
- Pyloric sphincter controls gastric emptying rate
- Gastric emptying: accelerated by gastrin, motilin; slowed by CCK, secretin, GIP, fat/acid/hyperosmotic chyme in duodenum
Large Intestine Motility
- Haustrations: segmental mixing contractions; slow (<1 cm/hr)
- Mass movements: 1-3/day; triggered by gastrocolic reflex (food entering stomach → colonic propulsion)
- Defecation reflex: rectal distension → involuntary relaxation of internal anal sphincter (IAS) + voluntary relaxation of external anal sphincter (EAS)
MODULE 4: GASTRIC SECRETION
Glands of the Stomach
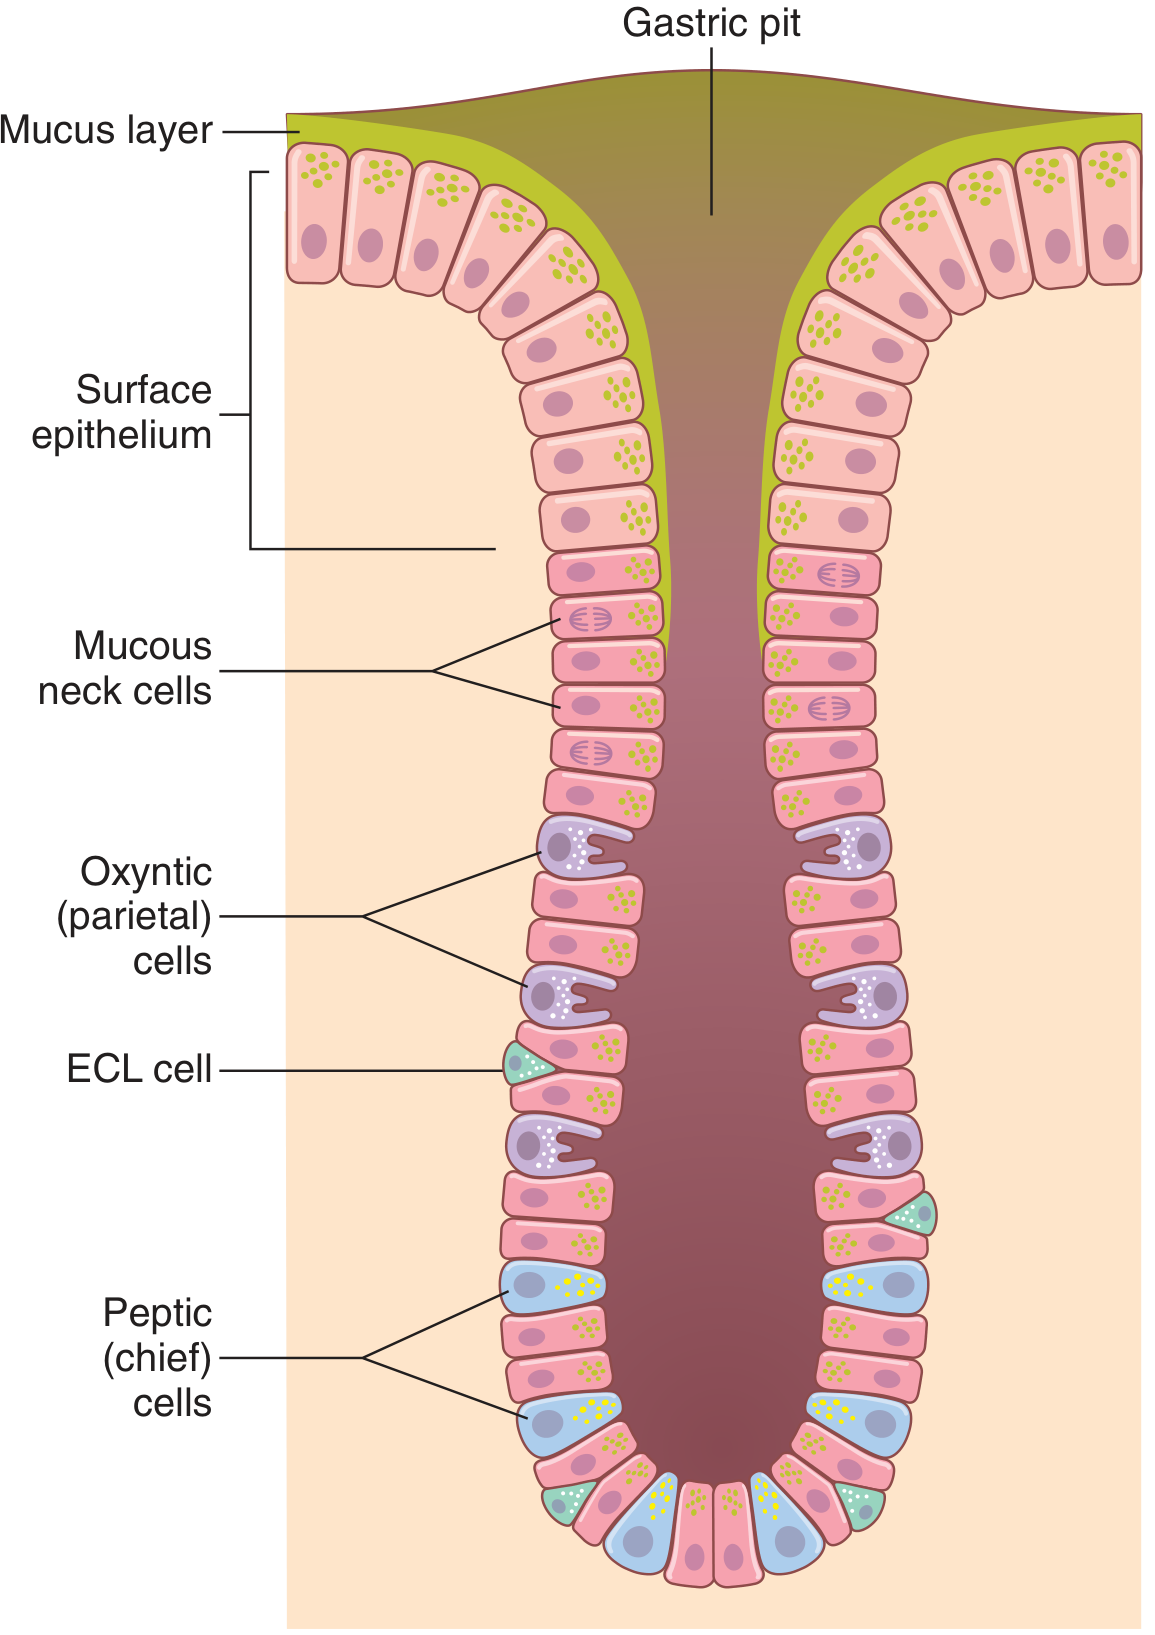
| Cell Type | Location | Secretion | Function |
|---|---|---|---|
| Surface mucous cells | Entire gastric surface | Mucus + HCO₃⁻ | Mucosal protection |
| Mucous neck cells | Upper gland (neck) | Mucus | Mucosal protection |
| Parietal (oxyntic) cells | Fundus/body glands | HCl + Intrinsic Factor | Acid environment; B12 absorption |
| Chief (peptic) cells | Base of fundus/body glands | Pepsinogen | Protein pre-digestion |
| ECL cells | Fundus/body glands | Histamine | Paracrine stimulation of parietal cells |
| G cells | Antral glands | Gastrin | Stimulates acid secretion |
| D cells | Antral/fundus glands | Somatostatin | Inhibits G cells (paracrine) |
HCl Secretion Mechanism (Parietal Cell)
- CO₂ + H₂O → H₂CO₃ (carbonic anhydrase) → H⁺ + HCO₃⁻
- H⁺ is actively pumped into the canaliculus in exchange for K⁺ via H⁺-K⁺ ATPase (proton pump) on the apical membrane
- K⁺ recycled back into cell via the same pump; Na⁺ reabsorbed via Na⁺-K⁺ ATPase on basolateral membrane
- HCO₃⁻ exits via basolateral Cl⁻/HCO₃⁻ exchanger → enters blood ("alkaline tide")
- Cl⁻ enters cell and is secreted through apical Cl⁻ channels → combines with H⁺ in canaliculus → HCl
- Water follows osmotically → final secretion: HCl 150-160 mEq/L + KCl 15 mEq/L
Drug target: PPIs (omeprazole, lansoprazole) irreversibly block H⁺-K⁺ ATPase. H2 blockers (ranitidine, famotidine) block histamine H2 receptors on parietal cells.
Stimulation of Parietal Cells
| Stimulus | Receptor on Parietal Cell | Second Messenger |
|---|---|---|
| Histamine (from ECL cells) | H2 receptor | cAMP ↑ |
| Gastrin (from G cells) | CCK-B (gastrin) receptor | Ca²⁺ ↑ |
| Acetylcholine (from vagus/ENS) | M3 receptor | Ca²⁺ ↑ |
Pepsinogen
- Secreted by chief cells; inactive zymogen
- Activated by HCl → pepsin (molecular weight drops from 42,500 to ~35,000)
- Pepsin itself can then autocatalytically activate more pepsinogen
- Optimal activity: pH 1.5-3.5; inactivated above pH 5
Phases of Gastric Secretion
| Phase | Trigger | Mediator | % of Total |
|---|---|---|---|
| Cephalic | Sight, smell, taste, thought of food | Vagus (ACh) → direct parietal + ECL cell stimulation | ~30% |
| Gastric | Food in stomach (distension + protein products) | Local myenteric reflexes + gastrin + histamine | ~60% |
| Intestinal | Chyme enters duodenum (acid + fat + protein) | Initially small stimulation by intestinal gastrin; then inhibited by secretin, CCK, GIP, GLP-1 | ~10% (net inhibitory) |
- Low antral pH (<2) → D cells release somatostatin → suppresses G cells (feedback loop)
- Fat + acid in duodenum → secretin + CCK + GIP → "enterogastric reflex" → ↓ gastric motility + ↓ acid
- Distension of duodenum → ↓ gastric emptying
MODULE 5: GI HORMONES SUMMARY TABLE
| Hormone | Secreting Cell | Location | Stimulus | Actions |
|---|---|---|---|---|
| Gastrin | G cells | Gastric antrum, duodenum | Protein, distension, vagal/ACh; inhibited by pH<2 | ↑ HCl, ↑ mucosal growth, ↑ gastric motility |
| CCK | I cells | Duodenum, jejunum | Fat, protein, acid | ↑ Pancreatic enzymes, ↑ gallbladder contraction, ↓ gastric emptying, ↑ sphincter of Oddi relaxation |
| Secretin | S cells | Duodenum, jejunum | Acid (pH <4.5), fat | ↑ Pancreatic HCO₃⁻, ↑ biliary HCO₃⁻, ↓ gastric acid, ↓ gastric emptying |
| GIP | K cells | Duodenum, jejunum | Fat, protein, carbs | ↑ Insulin (incretin), ↓ gastric acid |
| Motilin | M cells | Duodenum, jejunum | Fat, acid, nerve | ↑ Gastric + intestinal motility, initiates MMC |
| GLP-1 | L cells | Ileum, colon | Fat, carbs, protein | ↑ Insulin (incretin), ↓ glucagon, ↓ gastric emptying, ↓ appetite |
| VIP | ENS neurons | Entire gut | Nerve stimulation | Relaxes smooth muscle, ↑ pancreatic/intestinal secretion |
| Somatostatin | D cells | Stomach, pancreas | Acid, fat, protein | ↓ Gastrin, ↓ secretin, ↓ acid, ↓ pancreatic enzymes, ↓ motility (broad inhibitor) |
MODULE 6: PANCREATIC SECRETION
Two Functional Components
| Component | Cell | Secretion | Stimulated by |
|---|---|---|---|
| Enzymatic | Acinar cells | Digestive enzymes (as zymogens) | ACh (vagus + ENS), CCK |
| Aqueous (bicarbonate) | Ductal cells | Large volume of NaHCO₃-rich fluid | Secretin |
Pancreatic Digestive Enzymes
- Trypsinogen → trypsin (activated by enterokinase from duodenal brush border; also autocatalytic)
- Chymotrypsinogen → chymotrypsin (activated by trypsin)
- Procarboxypeptidase → carboxypeptidase A and B (activated by trypsin)
- Proelastase → elastase (activated by trypsin)
Safety mechanism: Trypsin inhibitor is co-secreted by acinar cells to prevent autodigestion. Failure = acute pancreatitis.
- Pancreatic amylase (active, not a zymogen) → starch + glycogen → disaccharides + trisaccharides
- Pancreatic lipase (+ colipase) → triglycerides → fatty acids + 2-monoglycerides
- Cholesterol esterase → cholesterol esters → free cholesterol + FA
- Phospholipase A2 → phospholipids → lysophospholipids + FA
Regulation of Pancreatic Secretion
- ACh (vagal + ENS) → acinar cells → enzymes
- CCK (I cells, duodenum/jejunum; stimulated by fat + protein) → acinar cells → large enzyme secretion
- Secretin (S cells; stimulated by acid pH <4.5) → ductal cells → large volume of HCO₃⁻
Phases of Pancreatic Secretion
| Phase | % of Total | Notes |
|---|---|---|
| Cephalic | ~20% | Vagal ACh → enzyme secretion; little fluid |
| Gastric | ~5-10% | Continued vagal stimulation; still little fluid |
| Intestinal | ~70-80% | Secretin-driven HCO₃⁻ flood; CCK-driven enzyme release |
Key point: The intestinal phase dominates. Secretin release is triggered when duodenal pH drops below 4.5-5.0, which triggers HCO₃⁻ secretion to neutralize the acid. This is a classic negative feedback loop. - Guyton & Hall, p. 807
MODULE 7: BILIARY SECRETION
Bile Production and Composition
- Hepatocytes continuously produce ~600-1000 mL bile/day
- Stored and concentrated (~10-fold) in the gallbladder
- Released into duodenum via common bile duct through sphincter of Oddi in response to CCK
| Component | Function |
|---|---|
| Bile salts (bile acids + glycine/taurine) | Emulsification of fats; micelle formation |
| Lecithin (phosphatidylcholine) | Enhances fat emulsification |
| Cholesterol | Metabolic waste product |
| Bilirubin (conjugated) | Breakdown product of heme |
| Ions (Na⁺, Cl⁻, HCO₃⁻) | Buffering |
Enterohepatic Circulation of Bile Salts
- Bile salts secreted into duodenum
- Aid fat digestion throughout small intestine
- 95% reabsorbed at terminal ileum (active transport)
- Transported back to liver via portal vein
- Re-secreted by hepatocytes
- 5% lost in feces → replaced by new hepatic synthesis from cholesterol
Clinical: Resection of terminal ileum (e.g., Crohn's disease) → loss of bile salt recycling → bile salt deficiency → fat malabsorption (steatorrhea) + ↑ colonic bile salts → secretory diarrhea.
MODULE 8: SALIVARY AND INTESTINAL SECRETION
Saliva
- Volume: 1000-1500 mL/day
- Secreted by: parotid (25%), submandibular (70%), sublingual (5%) glands
- Composition: water, mucus, salivary amylase (ptyalin), lingual lipase, IgA, lysozyme
- pH: 6.0-7.4 (bicarbonate-rich at high flow rates)
- Functions: Lubrication, starch digestion (~30-40%), antimicrobial, taste, buffering dental plaque acid
Small Intestinal Secretion (Succus Entericus)
- Crypts of Lieberkühn secrete 1800 mL/day of isotonic fluid
- Mainly water + NaCl + HCO₃⁻ (no major enzymes)
- The mucus and fluid dilute and neutralize chyme
- Brush border enzymes (not secreted - bound to microvilli membrane):
- Lactase, sucrase, maltase, α-dextrinase
- Aminopeptidases, dipeptidases
- Enterokinase (trypsinogen → trypsin)
Large Intestinal Secretion
- Goblet cells secrete mucus for lubrication
- No digestive enzymes
MODULE 9: DIGESTION
Carbohydrate Digestion
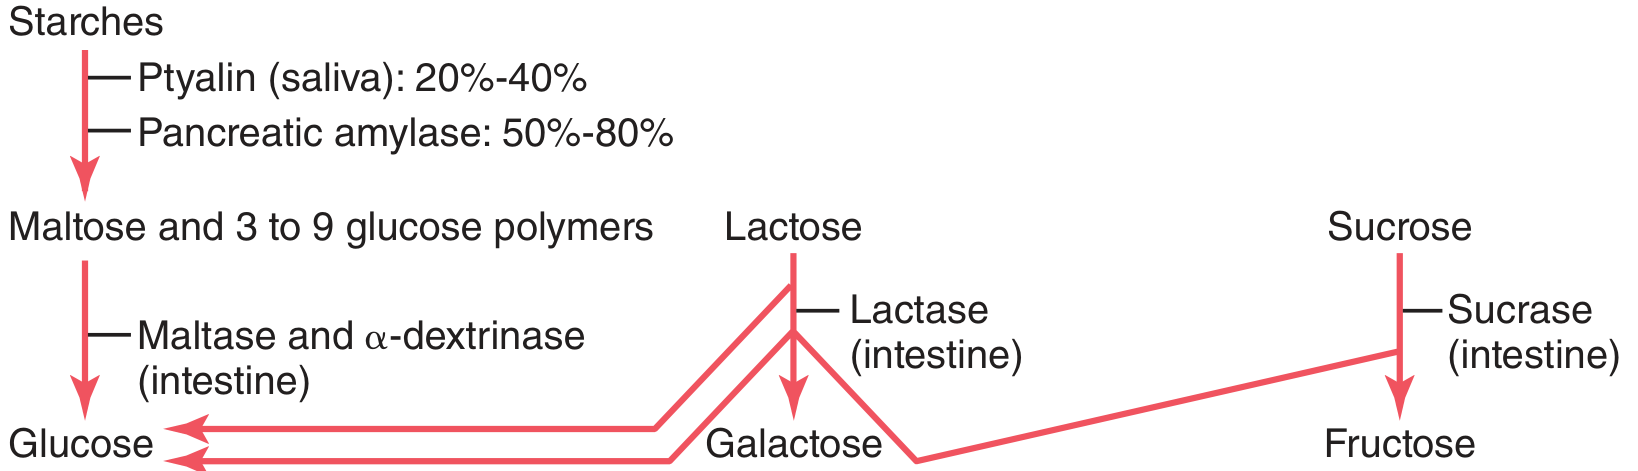
| Stage | Site | Enzyme | Product |
|---|---|---|---|
| Salivary | Mouth/fundus | Ptyalin (salivary α-amylase) | Starch → maltose + 3-9 glucose polymers (30-40% digested) |
| Pancreatic | Duodenum | Pancreatic amylase | Starch → maltose, maltotriose (nearly complete within 15-30 min) |
| Brush border | Small intestine | Maltase, sucrase, lactase, α-dextrinase | Disaccharides → monosaccharides |
Cellulose cannot be digested (no human cellulase). However, gut microbiota ferment it to short-chain fatty acids.
Protein Digestion
| Stage | Site | Enzyme | Notes |
|---|---|---|---|
| Gastric | Stomach | Pepsin (from pepsinogen + HCl) | Endopeptidase; active at pH 1.5-3.5; cleaves at aromatic AA residues |
| Pancreatic endopeptidases | Small intestine | Trypsin, chymotrypsin, elastase | Cleave internal peptide bonds |
| Pancreatic exopeptidases | Small intestine | Carboxypeptidases A + B | Cleave from C-terminus |
| Brush border | Small intestine | Aminopeptidases, dipeptidases | → Free amino acids + di/tripeptides |
Fat Digestion
| Step | Where | Mechanism |
|---|---|---|
| 1. Lingual/gastric lipase | Mouth/stomach | Minor digestion of short-chain triglycerides |
| 2. Emulsification | Duodenum | Bile salts + lecithin break large fat globules into droplets (↑ surface area for lipase) |
| 3. Pancreatic lipase + colipase | Duodenum | Triglycerides → 2-monoglycerides + 2 free fatty acids (colipase anchors lipase to emulsion droplet surface) |
| 4. Micelle formation | Duodenum/jejunum | Bile salts form cylindrical micelles (4-8 nm) carrying monoglycerides + FA → transport to brush border |
| 5. Absorption | Jejunum brush border | Lipids diffuse from micelle into enterocyte (passive, concentration gradient) |
| 6. Re-esterification | Enterocyte smooth ER | FAs + 2-MG → triglycerides; cholesterol esters re-formed |
| 7. Chylomicron packaging | Golgi | TG + cholesterol + phospholipids + apoprotein B48 → chylomicron |
| 8. Lymphatic entry | Enterocyte → lacteals | Chylomicrons too large for capillaries → enter lacteals → thoracic duct → systemic circulation |
MODULE 10: ABSORPTION
Surface Area Amplification of Small Intestine
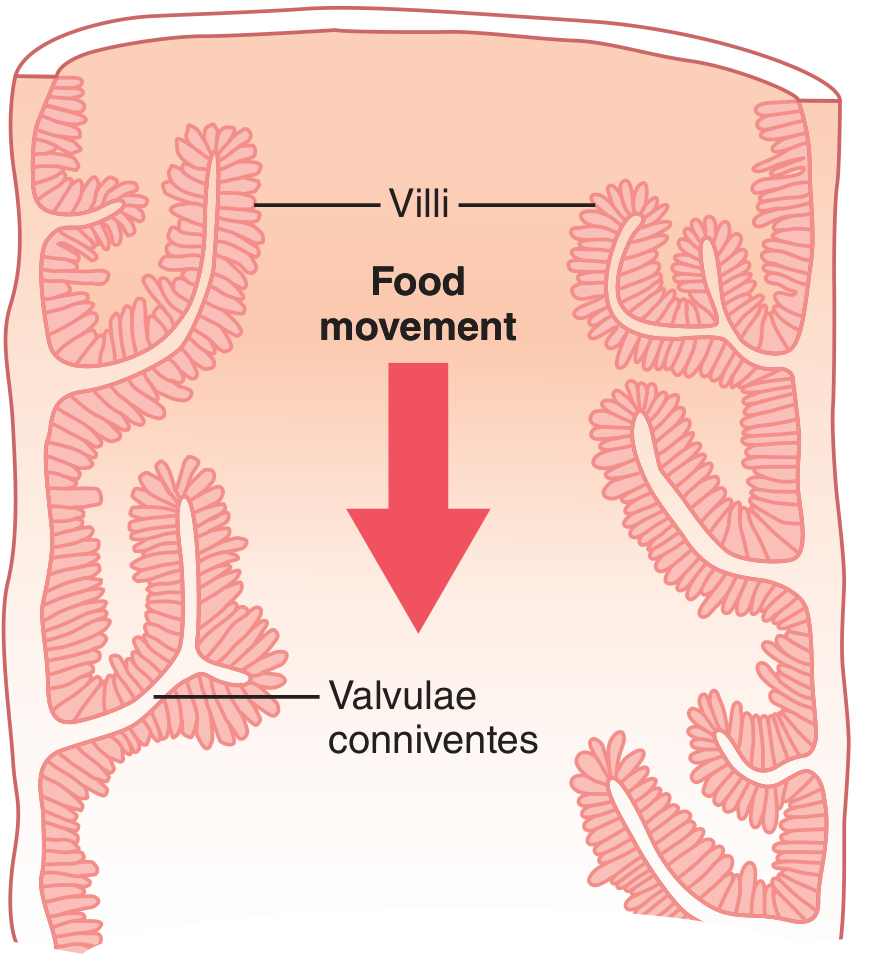
| Structure | Increase | Details |
|---|---|---|
| Valvulae conniventes (circular folds / Kerckring's folds) | 3x | Protrude 8 mm into lumen; most prominent in duodenum + jejunum |
| Villi | 10x | 1 mm tall; capillary + lacteal in each villus core |
| Microvilli (brush border) | 20x | 1000 microvilli/cell; 1 µm long; 0.1 µm diameter |
- Ingested fluid: ~1.5 L
- Secreted: ~7 L (saliva 1.5L + gastric 2L + bile 1L + pancreatic 1.5L + intestinal 1L)
- Total entering small intestine: ~8-9 L
- Small intestine absorbs ~7.5 L
- 1.5 L passes to colon; colon absorbs 1.3-1.4 L
- Feces: ~100-200 mL
Absorption of Specific Nutrients
- Glucose + galactose: Na⁺-glucose cotransporter (SGLT-1) on apical membrane → secondary active transport (driven by Na⁺ gradient maintained by basolateral Na⁺-K⁺ ATPase) → exits via GLUT-2 on basolateral side
- Fructose: GLUT-5 on apical (facilitated diffusion); GLUT-2 on basolateral
- Free amino acids: Na⁺-dependent cotransporters (multiple types for different AA classes)
- Di/tripeptides: H⁺-peptide cotransporter (PepT1) → hydrolyzed intracellularly to free AAs
- Most absorbed in jejunum (faster) and ileum
- Absorbed with lipid micelles; require bile; absorbed in small intestine
- Vitamin K also produced by colonic bacteria
- Requires Intrinsic Factor (IF) from parietal cells
- IF-B12 complex absorbed by specific receptors in terminal ileum only
- Deficiency causes: pernicious anemia (lack of IF), terminal ileum disease (Crohn's), gastric bypass
- Absorbed in duodenum primarily
- Fe³⁺ (ferric) reduced to Fe²⁺ (ferrous) by duodenal cytochrome b (DcytB) - enhanced by vitamin C
- Fe²⁺ transported via DMT-1 (divalent metal transporter-1) on apical membrane
- Stored as ferritin in enterocyte; exported via ferroportin on basolateral side (regulated by hepcidin)
- Active absorption in duodenum (regulated): calcitriol (1,25-OH₂ Vit D₃) ↑ calbindin → active Ca²⁺ transport
- Passive absorption throughout small intestine
- PTH indirectly ↑ absorption by stimulating calcitriol synthesis
- Absorbed osmotically following solute absorption
- Small intestine: 7.5 L/day via both transcellular and paracellular routes
Electrolyte Absorption
- Na⁺-glucose/AA cotransport (jejunum)
- Na⁺-H⁺ exchanger (NHE) (jejunum + ileum)
- Na⁺-Cl⁻ cotransport (ileum)
- ENaC (epithelial Na⁺ channel) on apical membrane
- Aldosterone upregulates ENaC → ↑ Na⁺ and water absorption in colon
- Basis for oral rehydration therapy: glucose + Na⁺ solution stimulates coupled absorption even in diarrhea
MODULE 11: LARGE INTESTINE PHYSIOLOGY
Functions
- Absorb water + electrolytes (residual ~1.5 L → compacts to 100-200 mL feces)
- Store feces until voluntary evacuation
- Host gut microbiota
- Produce mucus (no digestive enzymes)
Bacterial Fermentation
- Gut bacteria ferment dietary fiber + undigested carbohydrates
- Products: Short-chain fatty acids (SCFAs) - butyrate, propionate, acetate
- Butyrate is the primary energy source for colonocytes (~70% of their energy)
- Gases produced: CO₂, H₂, methane (CH₄ in some individuals - basis of hydrogen breath tests)
Defecation Reflex
- Feces enter rectum → rectal distension
- Stretch receptors → afferent signals via pelvic nerves
- Rectosphincteric reflex: involuntary relaxation of internal anal sphincter (smooth muscle)
- Sensation reaches consciousness → urge to defecate
- Voluntary relaxation of external anal sphincter (skeletal; pudendal nerve, S2-S4) → defecation
- If deferred: rectum accommodates; urge subsides temporarily
- Valsalva maneuver + levator ani contraction facilitates evacuation
MODULE 12: GI BLOOD FLOW
Splanchnic Circulation
- GI tract receives ~20-25% of resting cardiac output
- Postprandially rises to ~30%
| Artery | Supply |
|---|---|
| Celiac artery | Stomach, liver, spleen, pancreas head, duodenum |
| Superior mesenteric artery (SMA) | Small intestine, cecum, ascending + transverse colon |
| Inferior mesenteric artery (IMA) | Descending + sigmoid colon, upper rectum |
Functional Hyperemia (Postprandial)
- After eating: ↑ metabolic activity in absorptive epithelium → ↓ O₂, ↑ CO₂, ↑ adenosine, ↑ bradykinin
- → Local vasodilation → ↑ mucosal blood flow to carry absorbed nutrients
- Nervous stimulation of secretion also stimulates local blood flow (secretion and blood flow always increase together)
Countercurrent Exchange in Villi
- Arterial and venous capillaries run parallel in villi
- O₂ can diffuse from arteriole to venule at villus tips → villi tips are relatively hypoxic
- Risk: in low-flow states (shock, vasoconstrictors), villus tips most vulnerable to ischemia → bacterial translocation
MODULE 13: GI PHYSIOLOGY - QUICK EXAM REFERENCE
Key Numbers to Know
| Parameter | Value |
|---|---|
| Total GI secretion/day | ~7-8 L |
| Total absorption by small intestine | ~7.5 L/day |
| Small intestine surface area | ~250 m² |
| Gastric HCl concentration | 150-160 mEq/L; pH ~0.8 |
| Gastric emptying half-time (solid meal) | ~2-4 hours |
| Small intestinal transit time | 3-5 hours |
| Large intestinal transit time | 12-72 hours |
| Slow wave frequency - stomach | 3/min |
| Slow wave frequency - duodenum | 12/min |
| MMC cycle | 90-120 min (fasting) |
Classic Hormone-Stimulant Pairs (High-Yield)
| "Give this..." | "Get this..." |
|---|---|
| Fat in duodenum | CCK (gallbladder contracts) + Secretin (HCO₃⁻) + GIP (insulin) |
| Acid in duodenum (pH <4.5) | Secretin (↑ pancreatic HCO₃⁻) |
| Protein in stomach | Gastrin (↑ HCl) |
| Eating a meal (any) | GLP-1 (↑ insulin, ↓ glucagon) |
| Fasting | Motilin (→ MMC) |
Key Enzyme Activation Cascade
Enterokinase (brush border)
    ↓
Trypsinogen → TRYPSIN
    ↓ (activates all below)
Chymotrypsinogen → Chymotrypsin
Proelastase → Elastase
Procarboxypeptidase → Carboxypeptidase A & B
Prophospholipase → Phospholipase
Mucosal Protection - Gastric Barrier
- Mucus layer: viscous gel covering surface; traps HCO₃⁻
- Bicarbonate secretion: surface mucous cells secrete HCO₃⁻ → local pH ~7 at cell surface despite luminal pH 2
- Tight junctions: prevent backleak of H⁺
- Prostaglandins (PGE₂): stimulate mucus + HCO₃⁻ production and mucosal blood flow
- NSAIDs block COX-1 → ↓ prostaglandins → breach of barrier → peptic ulcer
Biochemistry Topic: Bioenergetics and ATP
Fatty acids note