
Female reproduction
What aspect of female reproduction are you interested in? · What level of detail do you need?
female reproductive system anatomy diagram
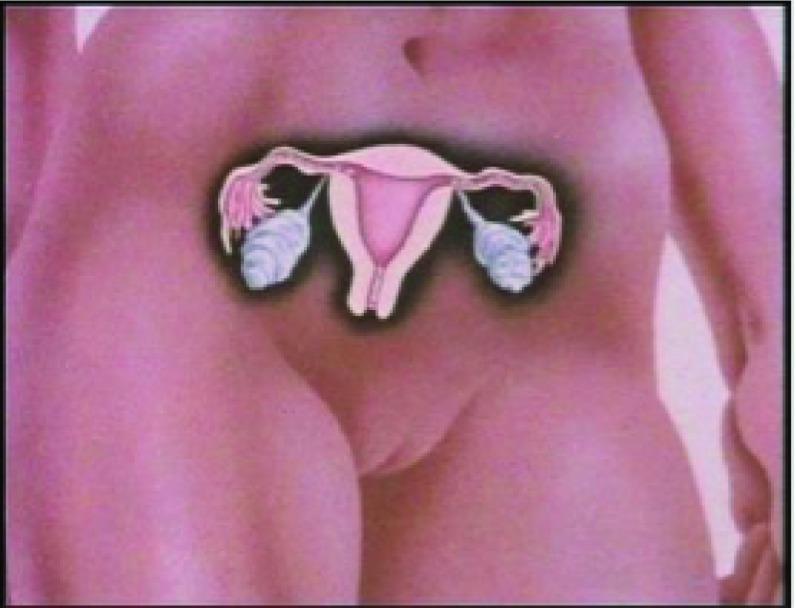
This medical illustration features an anatomical diagram of the female reproductive system superimposed onto a photographic frontal view of a female torso. The diagram focuses on the pelvic anatomy, highlighting the uterus, fallopian tubes, and ovaries in a simplified, educational style. The uterus is centrally positioned and depicted with a clear endometrial cavity and cervical canal. Extending laterally from the superior portion of the uterus (the fundus) are the fallopian tubes, which exhibit a characteristic tortuous morphology ending in finger-like fimbriae. Associated with the distal ends of the tubes are the ovaries, rendered with a textured, lobulated surface to represent follicular development. The graphic uses contrasting colors—pink for the uterine and tubal structures and a light blue-grey for the ovaries—to enhance visual differentiation. This content type serves as a primary educational tool for explaining reproductive health, infertility, and the anatomical context of procedures such as in vitro fertilization (IVF).
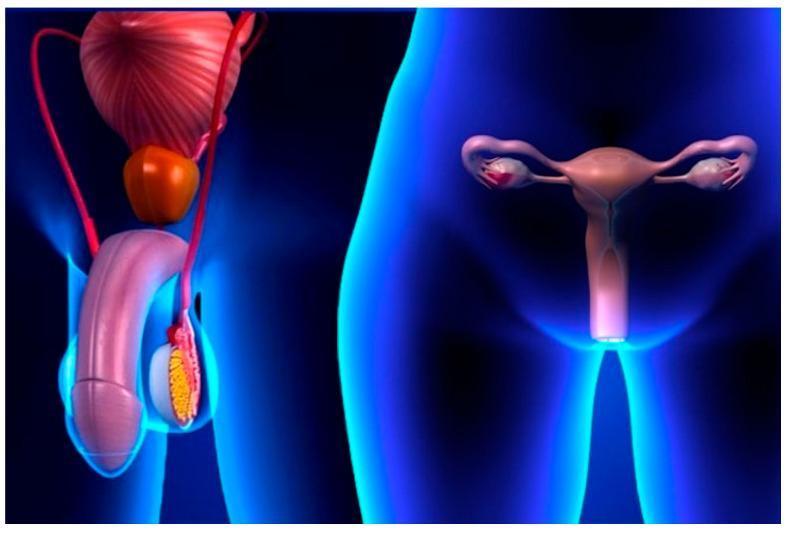
A 3D anatomical diagram illustrating the male and female reproductive systems side-by-side within stylized blue human silhouettes. On the left, the male anatomy includes the penis, a testis shown in cross-section within the scrotum, the epididymis, the vas deferens, the prostate gland, and the urinary bladder superiorly. On the right, the female anatomy depicts the uterus centrally, with the fallopian tubes extending laterally to the ovaries, and the vaginal canal positioned inferiorly. The visual highlights the pelvic location and relative spatial arrangement of primary and secondary sex organs. The image serves as an educational infographic for sexual health and reproductive anatomy, specifically in the context of public health strategies like the SAFE-S (Sexual behavior, Antibiotics, Facial cleanliness, Environmental improvement) strategy for controlling Chlamydia trachomatis and other sexually transmitted infections. The medical specialty is Urology and Gynecology, aimed at a general educational level.
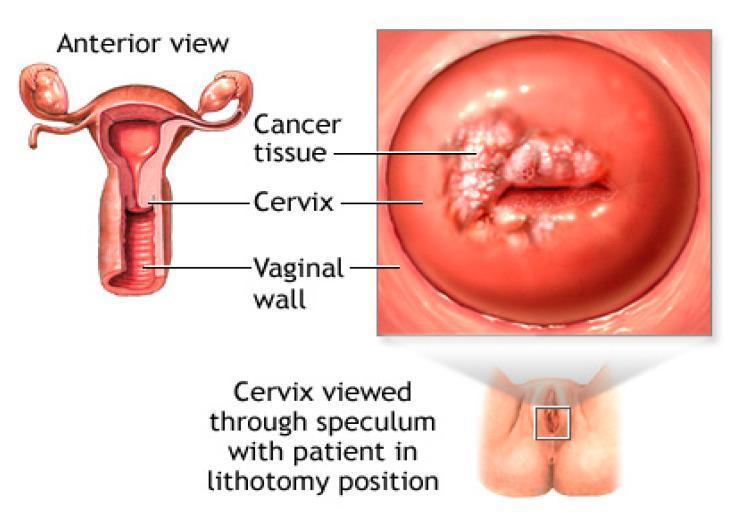
This composite educational illustration demonstrates the anatomy of the female reproductive system and the clinical presentation of cervical cancer. The left side features a frontal (anterior) cross-sectional diagram of the internal reproductive organs, labeling the uterus, bilateral fallopian tubes, ovaries, cervix, and the ribbed vaginal wall. The right side contains a detailed clinical illustration of the cervix as viewed through a speculum, with the patient in the lithotomy position (indicated by a small inset icon). This view highlights a pathological lesion labeled as 'Cancer tissue.' The malignant tissue is depicted as an irregular, exophytic, and cauliflower-like growth with a whitish-pink, granular texture, contrasting against the smooth, reddish-pink surface of the healthy ectocervix. The lesion is localized primarily on the left side of the cervical os. This resource is designed for gynecological education to assist in the identification of gross cervical abnormalities and understanding spatial anatomical relationships during pelvic examinations.
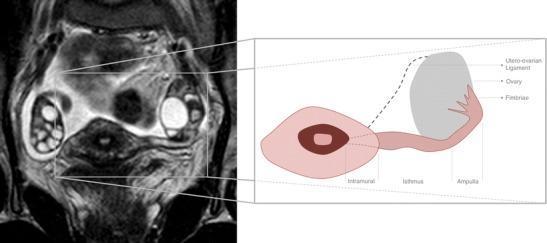
This composite educational graphic features a diagnostic MR image alongside an anatomical diagram, focusing on the female reproductive system. The left panel shows a T2-weighted coronal oblique MRI section of the pelvis from a 32-year-old female. Visible structures include a centrally positioned uterus, bilateral ovaries containing multiple high-signal intensity (bright) follicles, and the full longitudinal course of the left fallopian tube. The fallopian tube appears as a thin, convoluted, slightly hyperintense structure extending laterally toward the ovary. The right panel is a stylized anatomical illustration that maps and labels the segments of the fallopian tube based on the adjacent MRI. Labeled segments include the intramural (interstitial) portion within the uterine wall, the isthmus, the ampulla, and the fimbriae at the lateral infundibulum near the ovary. The diagram also identifies the utero-ovarian ligament. This visual is designed to teach normal pelvic anatomy and segmental division of the fallopian tubes, which are typically difficult to visualize on MRI unless surrounded by small amounts of peritoneal fluid.
menstrual cycle follicular luteal phase hormones FSH LH estrogen progesterone
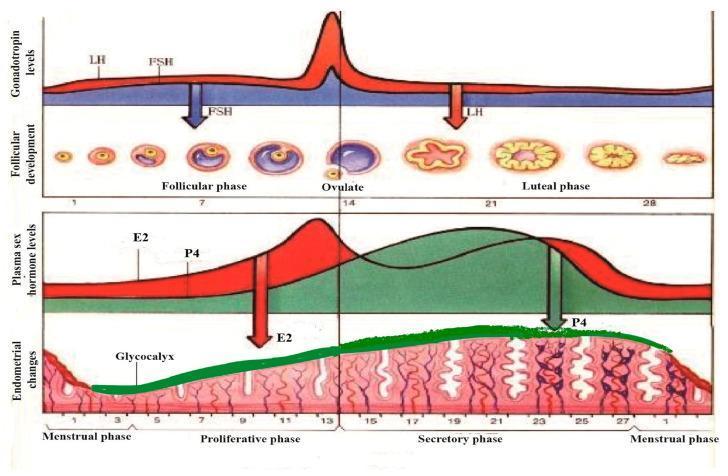
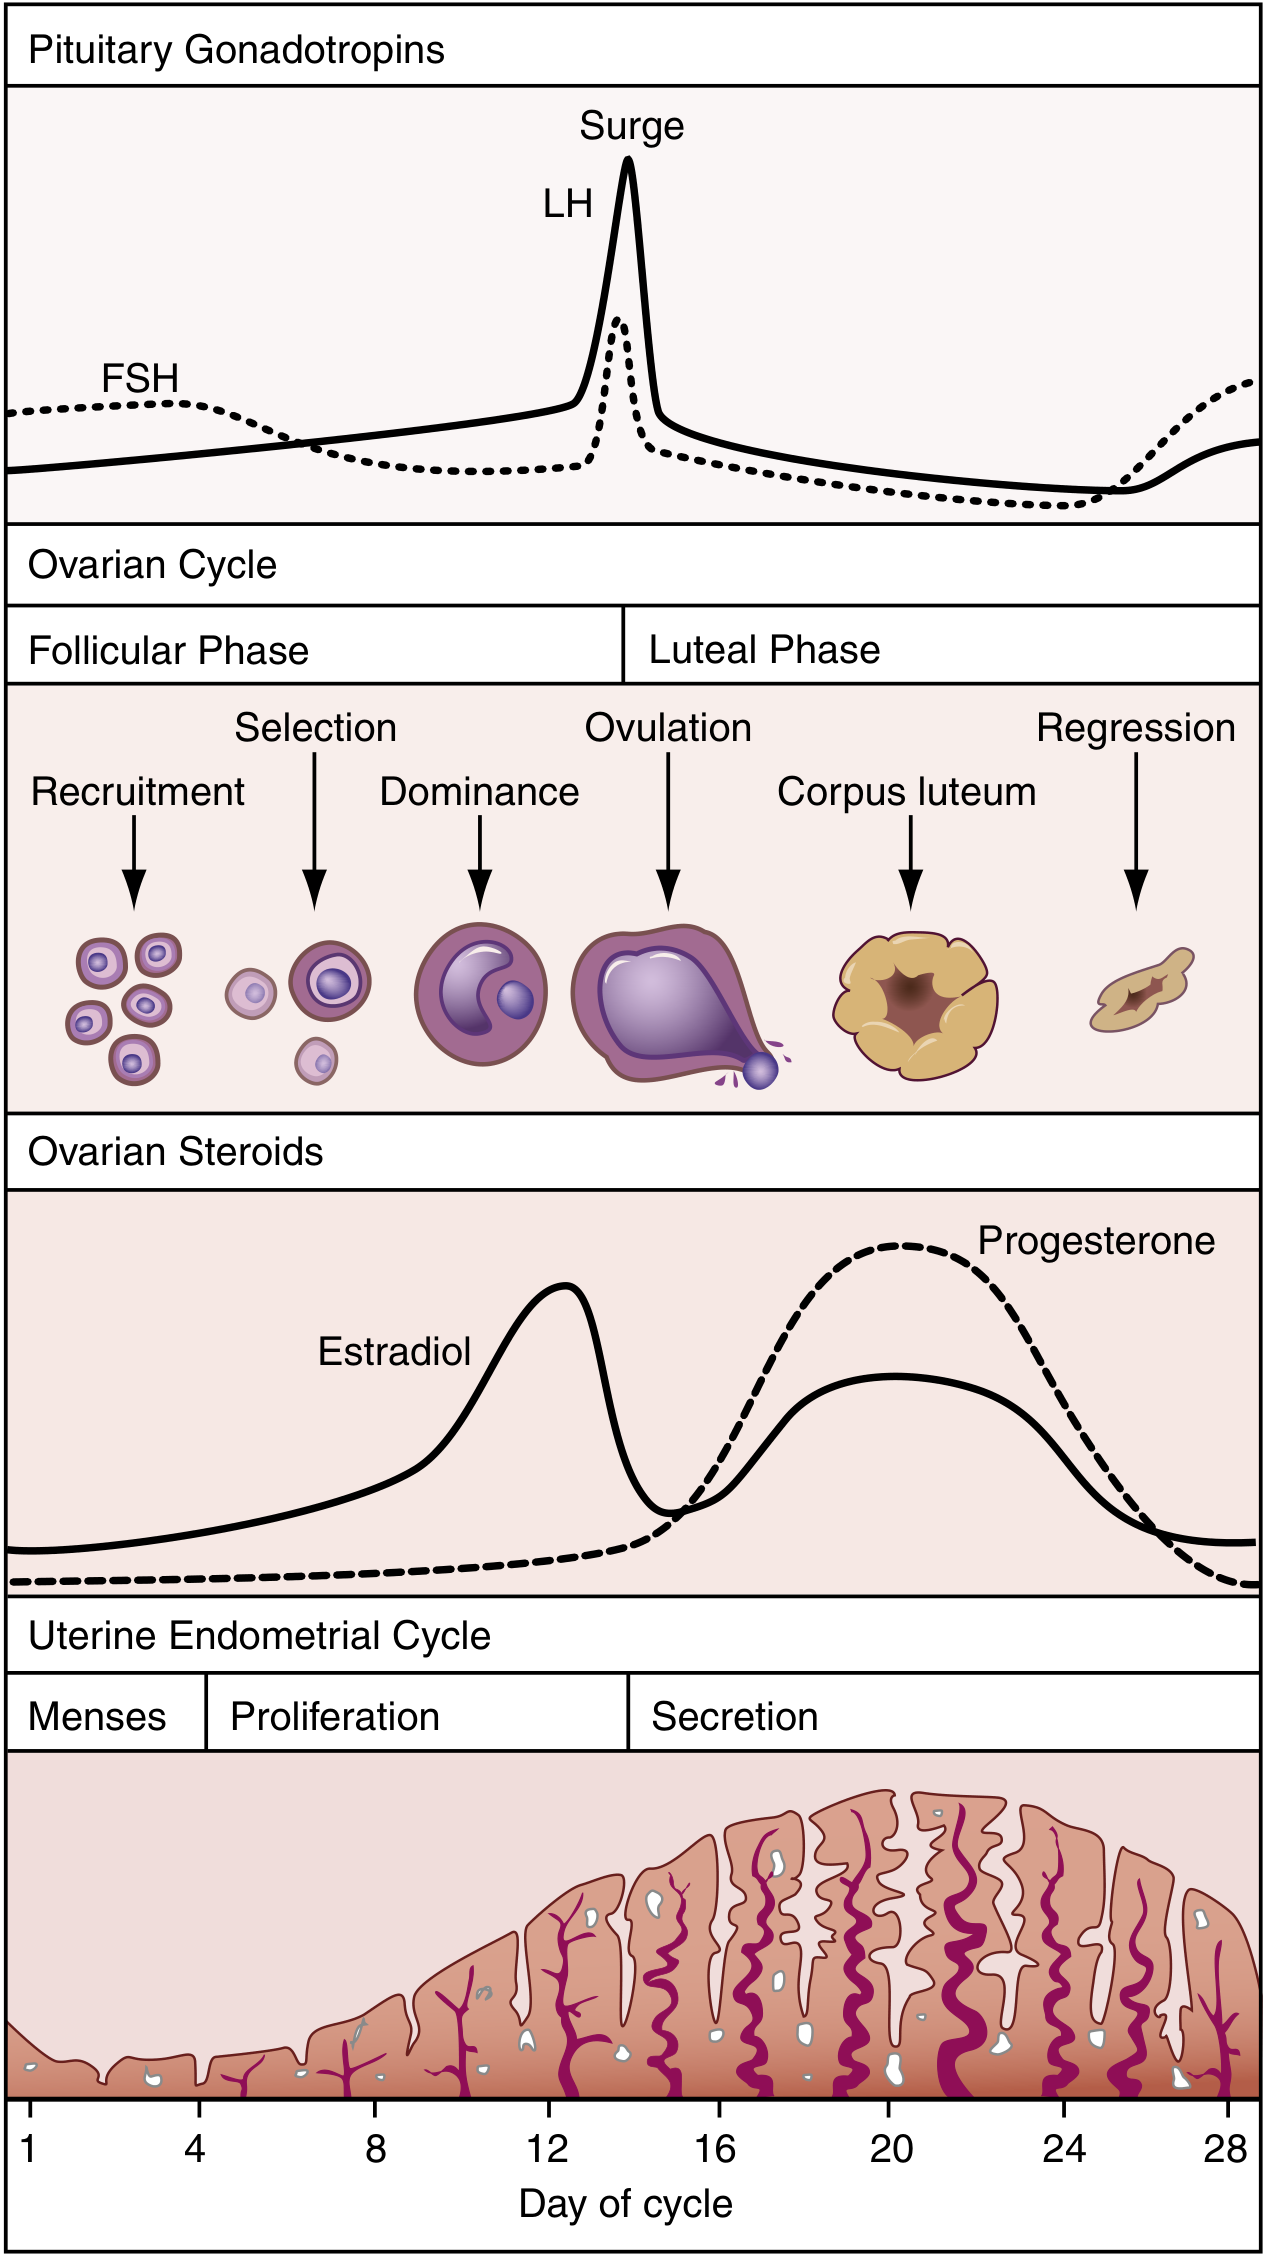
A multi-panel pathophysiology diagram illustrating the synchronous physiological changes during a standard 28-day human menstrual cycle. The top panel graphs gonadotropin levels, showing a sharp surge in Luteinizing Hormone (LH) and a moderate rise in Follicle-Stimulating Hormone (FSH) at day 14, correlating with the follicular phase, ovulation, and luteal phase stages. The corresponding follicular development shows the maturation of a primary follicle into a Graafian follicle, ovulation, and the formation of the corpus luteum and corpus albicans. The middle panel tracks plasma sex hormone levels, highlighting the mid-cycle peak of Estradiol (E2) and the post-ovulatory rise of Progesterone (P4). The bottom panel depicts endometrial morphology, transitioning from the menstrual phase to the proliferative and secretory phases. A green-shaded layer highlights the glycocalyx development, which thickens and becomes most prominent during the secretory phase under the influence of P4, before thinning during menstruation. The diagram demonstrates the hormonal regulation of the ovary and uterine lining for medical educational purposes.
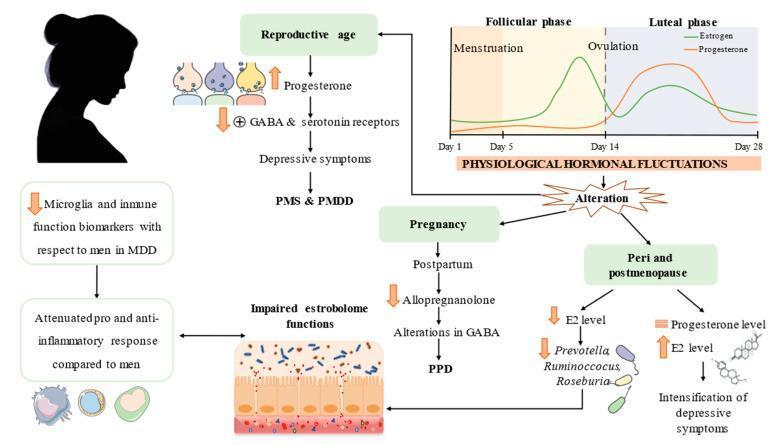
This pathophysiology diagram illustrates hallmarks of major depressive disorder (MDD) across various stages of the female reproductive lifespan, including reproductive age, pregnancy, and peri- and postmenopause. A line graph labeled 'Physiological Hormonal Fluctuations' depicts the 28-day menstrual cycle, showing estrogen peaks prior to ovulation (Day 14) and progesterone dominance during the luteal phase. A signaling pathway shows how progesterone fluctuations lead to GABA and serotonin receptor modulation, contributing to premenstrual syndrome (PMS) and premenstrual dysphoric disorder (PMDD). In the pregnancy/postpartum pathway, reduced allopregnanolone levels and GABA alterations are linked to postpartum depression (PPD). The peri- and postmenopausal section illustrates declining estradiol (E2) and progesterone, linked to the intensification of depressive symptoms. The diagram also highlights secondary factors, including impaired estrobolome function (gut-microbiome-estrogen axis) involving bacteria like Prevotella and Ruminococcus, and an immune component characterized by attenuated microglia and inflammatory responses compared to men. This visualization integrates endocrinology, neurobiology, and immunology to explain sex-specific vulnerabilities in mood disorders.
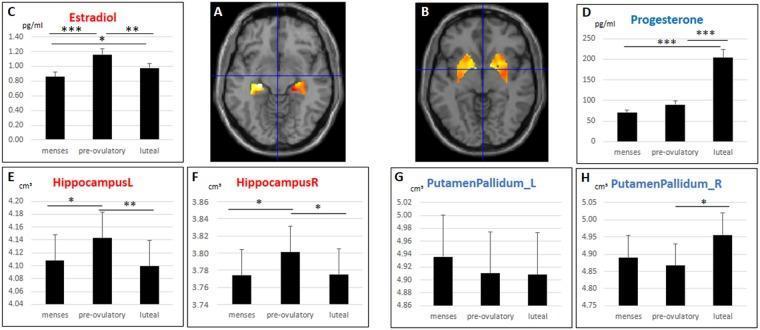
This composite educational figure illustrates structural changes in subcortical brain regions across three menstrual cycle phases: menses, pre-ovulatory, and luteal. (A) and (B) show axial structural MRI slices with heat-map overlays highlighting the regions of interest (ROIs): the bilateral hippocampus (A) and the bilateral putamen/pallidum within the basal ganglia (B). (C) and (D) are bar graphs tracking mean serum hormone levels, showing estradiol peaks during the pre-ovulatory phase and progesterone peaks during the luteal phase (p < 0.001). (E) through (H) provide longitudinal data on regional gray matter (GM) volume. Graphs E and F demonstrate that both left and right hippocampal GM volumes significantly increase during the pre-ovulatory phase compared to menses and luteal phases, correlating with estradiol peaks. Graphs G and H show volumes for the putamen/pallidum, with the right side showing a significant volume increase during the luteal phase compared to the pre-ovulatory phase, driven by progesterone. Error bars represent standard errors, and significance levels are indicated by asterisks (*p < 0.05, **p < 0.01, ***p < 0.001).
fertilization implantation embryo development uterus
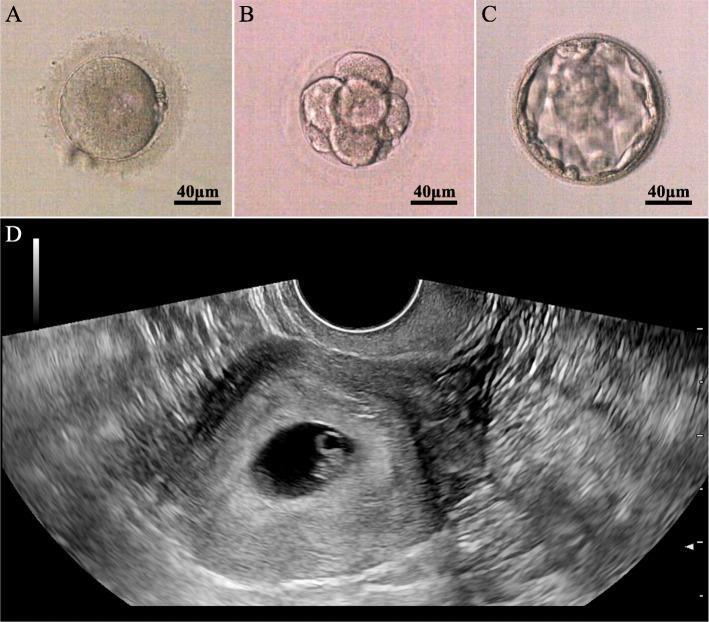
This four-panel image illustrates stages of human embryonic development following Intracytoplasmic Sperm Injection (ICSI). Panels A, B, and C are light microscopy images (scale bar 40 μm) depicting morphological progression: (A) shows a zygote with two pronuclei (2PN), indicating successful fertilization; (B) shows a cleavage-stage embryo at the 8-cell stage with distinct blastomeres; and (C) shows a blastocyst featuring an expanded blastocoel cavity, inner cell mass, and trophectoderm. Panel D is a transvaginal ultrasonogram of the uterus, demonstrating a clinical pregnancy. It shows a well-defined, anechoic gestational sac implanted within the thickened, echogenic endometrium. Inside the sac, a small echogenic structure consistent with a yolk sac or early fetal pole is visible. The composite image serves as an educational tool for reproductive medicine and embryology, highlighting the sequence from successful in vitro fertilization and embryo culture to clinical implantation in a patient with male-factor infertility.
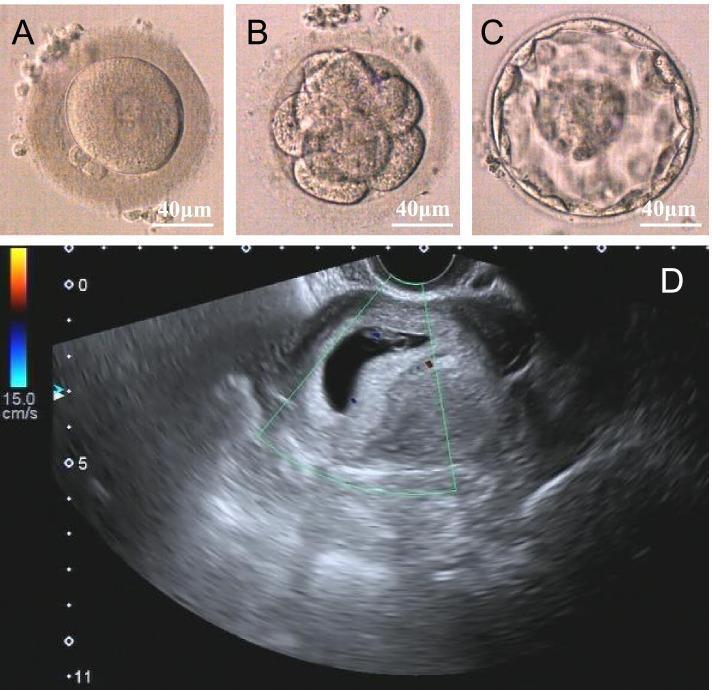
A multi-panel figure illustrating the stages of early human embryonic development and subsequent clinical pregnancy. Panels A-C are light microscopy images of an embryo at various pre-implantation stages, each with a 40 μm scale bar. Panel A shows a zygote at the 2-pronuclear (2PN) fertilization stage, with two distinct pronuclei visible within the cytoplasm. Panel B displays an 8-cell stage embryo, characterized by individual spherical blastomeres contained within the zona pellucida. Panel C depicts a high-quality blastocyst, showing a well-defined inner cell mass (ICM), a peripheral layer of trophectoderm cells, and an expanded fluid-filled blastocoel cavity. Panel D is a transvaginal ultrasound image demonstrating a successful clinical pregnancy. It reveals an intrauterine gestational sac appearing as an anechoic (dark), fluid-filled crescent-shaped structure surrounded by a hyperechoic decidual reaction. Color Doppler signaling is applied to the uterine environment to assess vascularity, with a velocity scale visible on the left. This visual sequence documents the progression from successful Intracytoplasmic Sperm Injection (ICSI) to embryo implantation and early gestation.
Female Reproduction - Student Overview
1. Anatomy of the Female Reproductive System
| Structure | Key Features |
|---|---|
| Ovaries | Paired gonads; produce oocytes and sex hormones (estrogen, progesterone); contain follicles at all stages |
| Fallopian tubes (uterine tubes) | Segments: intramural → isthmus → ampulla → infundibulum (with fimbriae); site of fertilization (ampulla) |
| Uterus | Three layers: perimetrium (outer), myometrium (smooth muscle), endometrium (inner, cyclically shed) |
| Cervix | Lower uterine segment; separates uterine cavity from vagina |
| Vagina | Muscular canal; receives penis during intercourse; birth canal |
| External genitalia (vulva) | Mons pubis, labia majora/minora, clitoris, vestibule |
2. Hormonal Axis: The HPG Axis
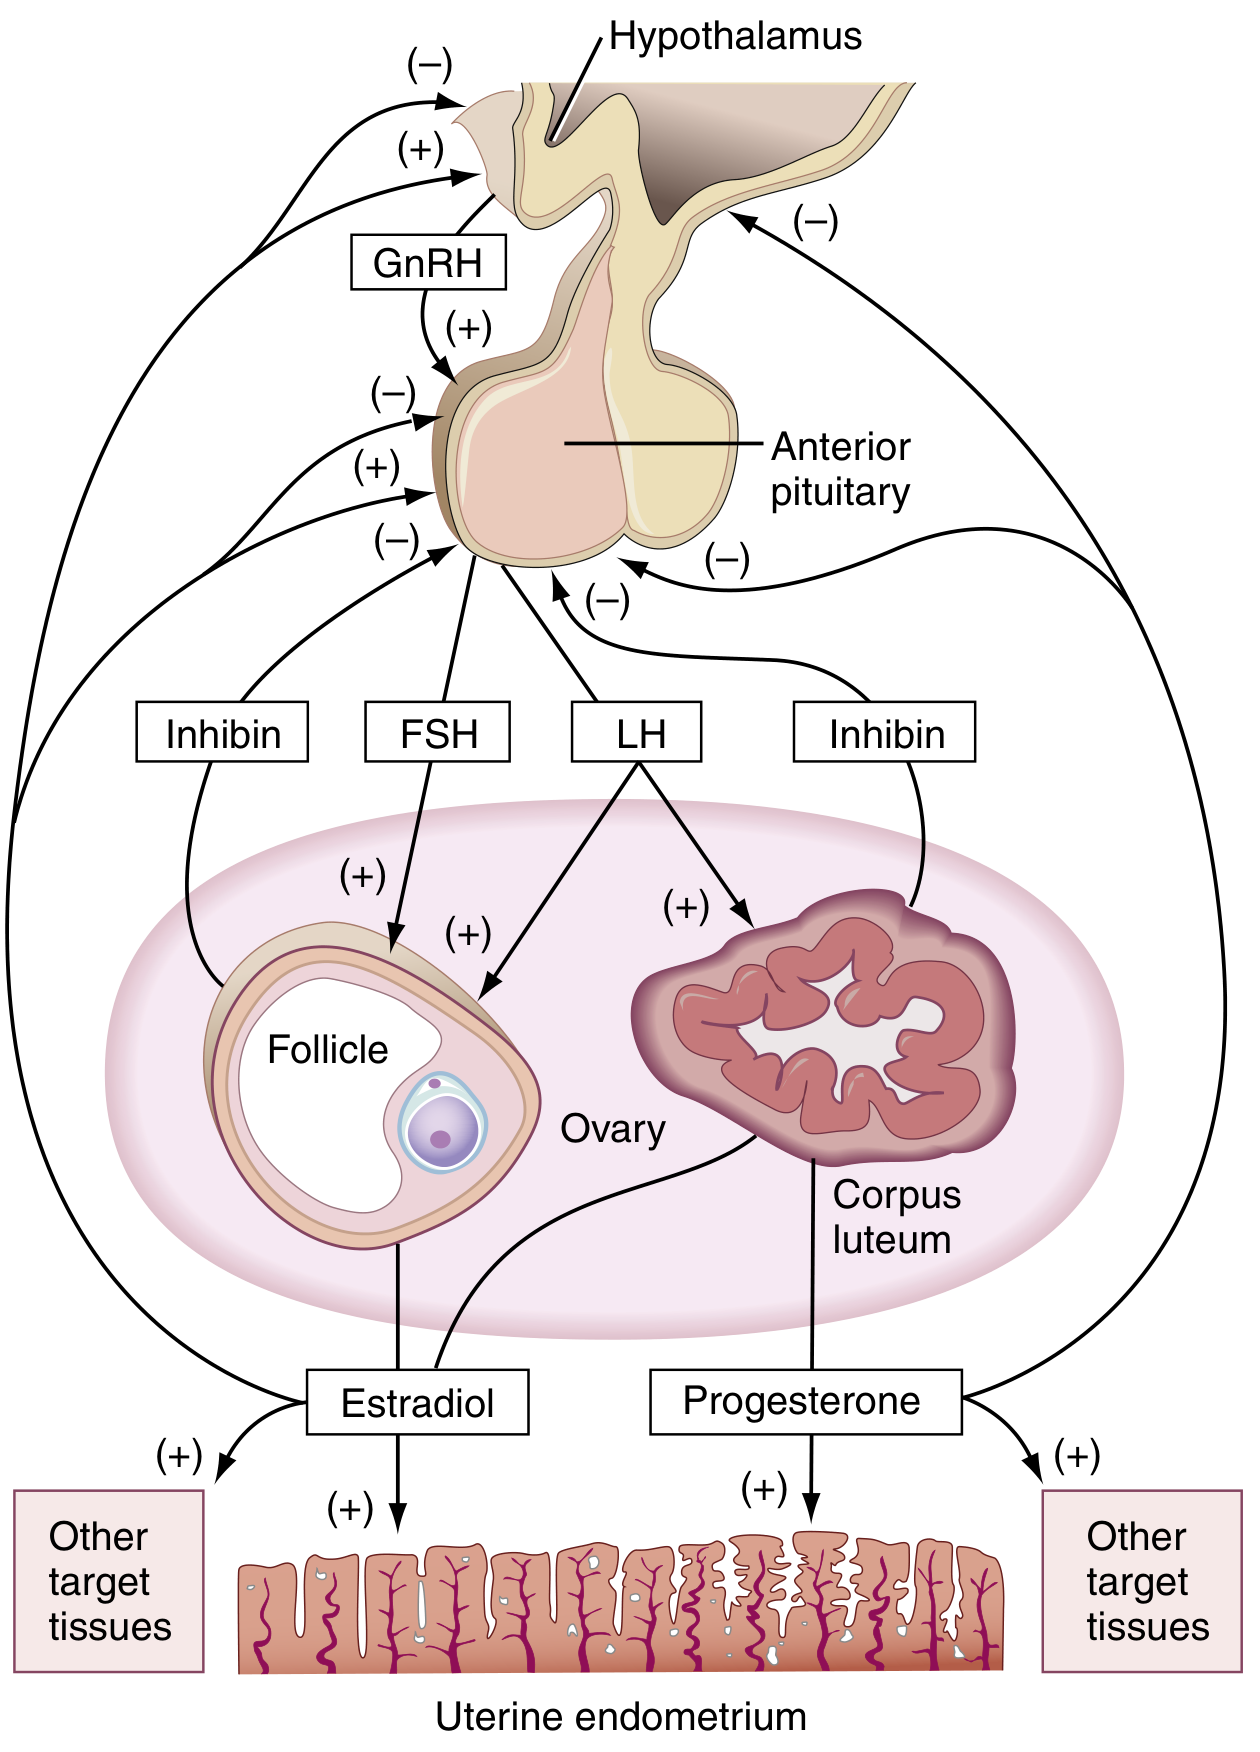
- Hypothalamus → releases GnRH (gonadotropin-releasing hormone) in pulses
- Anterior pituitary → releases FSH (follicle-stimulating hormone) and LH (luteinizing hormone) in response
- Ovaries → respond to FSH and LH; produce estradiol and progesterone
- Feedback loops: estradiol and progesterone exert negative feedback on the hypothalamus and pituitary for most of the cycle; inhibin from follicles (inhibin B) and corpus luteum (inhibin A) selectively suppresses FSH
3. The Menstrual Cycle (~28 days)
Ovarian Cycle
| Phase | Days | Events |
|---|---|---|
| Follicular phase | 1-14 | FSH recruits 10-12 antral follicles; one dominant follicle develops; rising estradiol from granulosa cells |
| Ovulation | ~Day 14 | LH surge triggered by peak estradiol (200-300 IU, positive feedback); follicle ruptures; oocyte released |
| Luteal phase | 14-28 | Ruptured follicle becomes corpus luteum; secretes estradiol + progesterone under LH support; regresses on day ~26 if no pregnancy |
Uterine (Endometrial) Cycle
| Phase | Days | Events |
|---|---|---|
| Menstruation | 1-4 | Estrogen and progesterone fall; endometrium sheds |
| Proliferative phase | 5-14 | Estradiol drives endometrial regrowth |
| Secretory phase | 14-28 | Progesterone + estradiol cause glandular development; endometrium prepared for implantation |
4. Fertilization and Implantation
Fertilization
- Occurs in the ampulla of the fallopian tube
- Sperm penetrates the zona pellucida of the secondary oocyte
- Triggers completion of meiosis II in the oocyte
- Produces a zygote (diploid, 46 chromosomes)
Cleavage and Blastocyst Formation
- Zygote undergoes mitotic cleavages → morula → blastocyst (~5 days)
- Blastocyst has two cell populations:
- Trophoblast (outer): becomes placenta and extraembryonic membranes
- Inner cell mass (embryoblast): becomes the embryo proper
Implantation (days 6-10 post-ovulation)
- Blastocyst arrives in uterine cavity ~5 days after fertilization
- Trophoblast binds glycoprotein ligands on endometrial epithelium
- Trophoblast differentiates into syncytiotrophoblast (invasive, multinucleated) and cytotrophoblast (mitotically active)
- Syncytiotrophoblast invades endometrial stroma; embryo embeds
- Cytotrophoblast secretes anti-inflammatory cytokines to prevent maternal immune rejection
- hCG (human chorionic gonadotropin) is produced by the syncytiotrophoblast - this prevents corpus luteum regression and maintains progesterone/estradiol → the basis of pregnancy tests - Junqueira's Basic Histology
5. Pregnancy
| Trimester | Key Events |
|---|---|
| 1st (wks 1-13) | hCG surges from <5 mIU/mL to >100,000 mIU/mL; corpus luteum maintained; organogenesis |
| 2nd (wks 14-26) | Placenta takes over steroid production; hCG falls; fetal growth |
| 3rd (wks 27-40) | Rapid fetal growth; placenta produces high estradiol (especially estriol from fetal DHEAS) and progesterone |
6. Common Female Reproductive Disorders (Overview)
| Disorder | Key Features |
|---|---|
| PCOS (Polycystic ovary syndrome) | Excess androgens, anovulation, polycystic ovaries; most common cause of female infertility |
| Endometriosis | Endometrial tissue outside the uterus; causes dysmenorrhea, pelvic pain, infertility |
| Fibroids (leiomyomas) | Benign smooth muscle tumors of myometrium; cause heavy bleeding, bulk symptoms |
| Ectopic pregnancy | Implantation outside uterus (usually fallopian tube); life-threatening if ruptured |
| Premature ovarian insufficiency | Ovarian failure before age 40; elevated FSH, low estrogen |
| Cervical cancer | HPV-related; screened by Pap smear; affects squamocolumnar junction |
| Endometrial cancer | Most common gynecologic cancer; linked to excess estrogen; presents with postmenopausal bleeding |
Summary: Key Hormones at a Glance
| Hormone | Source | Main Role |
|---|---|---|
| GnRH | Hypothalamus | Stimulates FSH and LH release |
| FSH | Anterior pituitary | Follicle recruitment and development |
| LH | Anterior pituitary | Triggers ovulation; stimulates corpus luteum |
| Estradiol (E2) | Granulosa cells / corpus luteum | Endometrial proliferation; LH surge trigger |
| Progesterone | Corpus luteum / placenta | Secretory endometrium; maintains pregnancy |
| Inhibin A | Corpus luteum | Inhibits FSH |
| Inhibin B | Developing follicles | Inhibits FSH |
| hCG | Syncytiotrophoblast | Maintains corpus luteum; pregnancy marker |