Top 10 heart diseases with ecg finding
Reading File
Finding Sources
Finding Sources
Searching Images
ECG electrocardiogram heart disease findings
Finding Sources
Finding Sources
Finding Sources
Searching Images
atrial fibrillation ECG tracing
Reading File
Finding Sources
Finding Sources
Searching Images
STEMI inferior myocardial infarction ST elevation ECG
Searching Images
hypertrophic cardiomyopathy ECG left ventricular hypertrophy
Searching Images
complete heart block third degree AV block ECG
Searching Images
pericarditis saddle shape ST elevation ECG
Searching Images
Wolff-Parkinson-White syndrome delta wave ECG pre-excitation
Searching Images
long QT syndrome Brugada syndrome ventricular tachycardia ECG
Searching Images
dilated cardiomyopathy heart failure ECG left bundle branch block
I now have comprehensive textbook and image data for all 10 heart diseases. Let me compile the full answer.
Top 10 Heart Diseases with ECG Findings
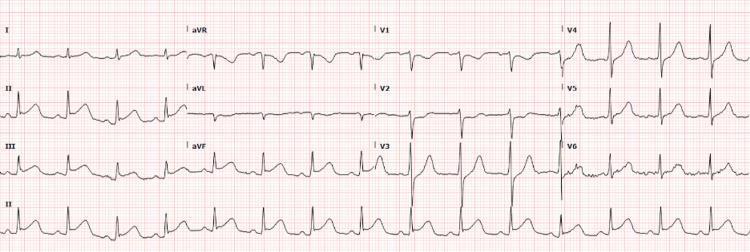
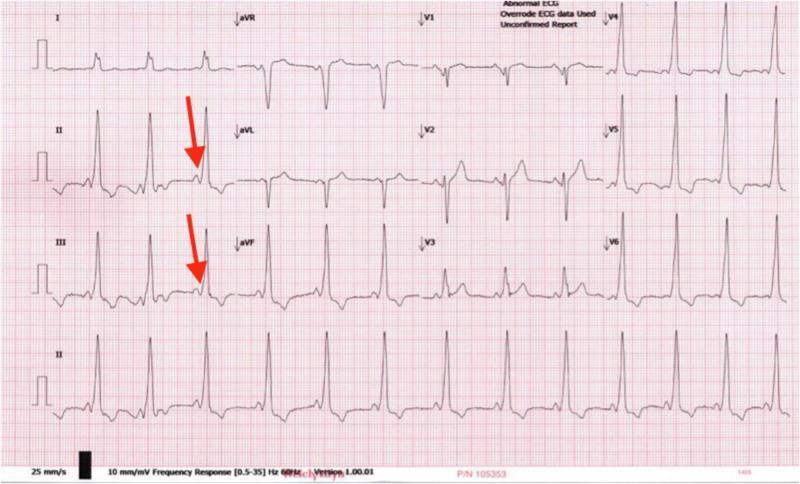
1. 🫀 ST-Elevation Myocardial Infarction (STEMI)
ECG Findings:
- ST-segment elevation ≥1 mm in ≥2 contiguous limb leads or ≥2 mm in precordial leads
- Tombstone/convex (upwardly domed) morphology of ST segment
- Reciprocal ST depression in mirror leads (e.g., elevation in II, III, aVF → depression in I, aVL)
- Hyperacute T waves (early phase)
- Pathological Q waves (>40 ms wide, >25% of R-wave height) develop within hours
- T-wave inversion in the evolutionary phase
Territory Localisation:
| Territory | Leads with ST elevation | Artery |
|---|---|---|
| Inferior | II, III, aVF | RCA / LCx |
| Anterior | V1–V4 | LAD |
| Lateral | I, aVL, V5–V6 | LCx |
| Posterior | ST depression V1–V3 (reciprocal) | RCA |
2. 💓 Atrial Fibrillation (AF)
ECG Findings:
- Absence of P waves — replaced by fine, chaotic fibrillatory (f) waves (most visible in V1)
- Irregularly irregular RR intervals — hallmark finding
- Narrow QRS (unless aberrant conduction or bundle branch block present)
- Ventricular rate varies (typically 100–160 bpm if uncontrolled)
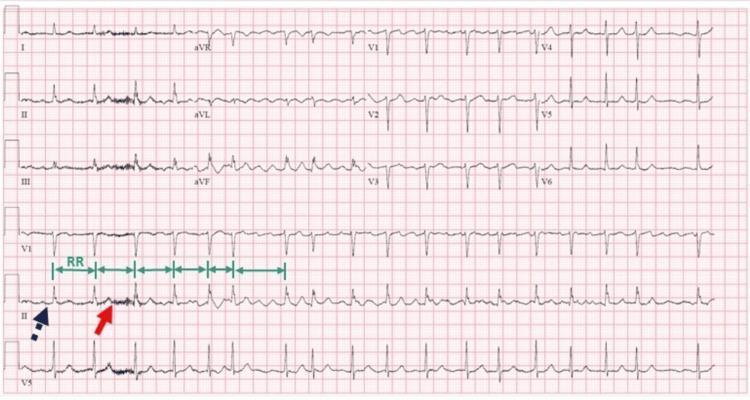
Source: Guyton and Hall Textbook of Medical Physiology; Tintinalli's Emergency Medicine
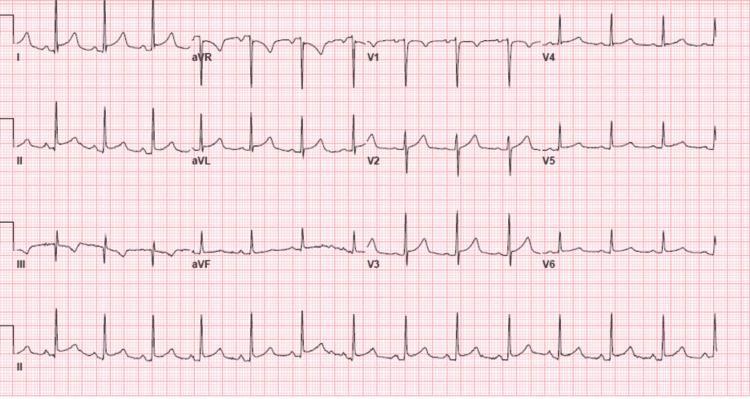
3. 🏋️ Hypertrophic Cardiomyopathy (HCM)
ECG Findings:
- Left ventricular hypertrophy (LVH) voltage criteria — deep S in V1 + tall R in V5/V6 ≥35 mm (Sokolow-Lyon)
- Narrow septal Q waves in lateral leads (V5, V6, I, aVL) — due to septal hypertrophy
- T-wave upright in leads with septal Q waves (unlike ischemia)
- Apical HCM: giant deep symmetric T-wave inversions in V2–V5 (Yamaguchi pattern)
- ST-segment depression (strain pattern)
- May show atrial arrhythmias (AF, flutter)
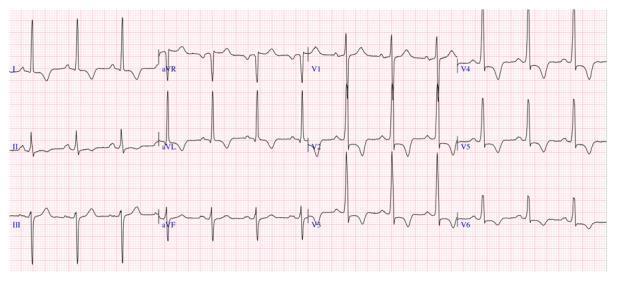
Source: Tintinalli's Emergency Medicine — "Deep S-wave voltage (28 mm S in V3), narrow septal Q waves in V5 and V6 are noted."
4. 🔌 Complete (Third-Degree) AV Block
ECG Findings:
- Complete AV dissociation — P waves and QRS complexes bear no fixed relationship
- P waves march through QRS complexes and T waves at a faster independent rate
- Escape rhythm maintains ventricular activity:
- Junctional escape: narrow QRS, rate 40–60 bpm
- Ventricular escape: wide QRS (>120 ms), rate 20–40 bpm
- Regular P-P and R-R intervals, but PR interval varies randomly
5. 🔥 Acute Pericarditis
ECG Findings (4 stages):
- Stage 1 (days): Diffuse concave (saddle-shaped) ST elevation in nearly all leads EXCEPT aVR and V1 (reciprocal ST depression); PR-segment depression (most visible in II, V4–V6); PR elevation in aVR — pathognomonic
- Spodick's sign: downward sloping TP segment
- Stage 2: ST normalises, T waves flatten
- Stage 3: T-wave inversion
- Stage 4: ECG normalises
Key distinction from STEMI: diffuse (not territorial), concave ST morphology, PR depression, no Q waves
6. ⚡ Wolff-Parkinson-White (WPW) Syndrome
ECG Findings (pre-excitation triad):
- Short PR interval (<120 ms) — accessory pathway bypasses AV node
- Delta wave — slurred initial upstroke of QRS (slow conduction through accessory pathway)
- Wide QRS (>120 ms) — fusion of delta wave + normal conduction
- Secondary ST-T changes discordant to QRS (not primary ischemia)
- Pseudo-infarct Q waves in inferior/lateral leads (negative delta waves mimicking Q waves)
- Risk of rapid pre-excited AF → ventricular fibrillation
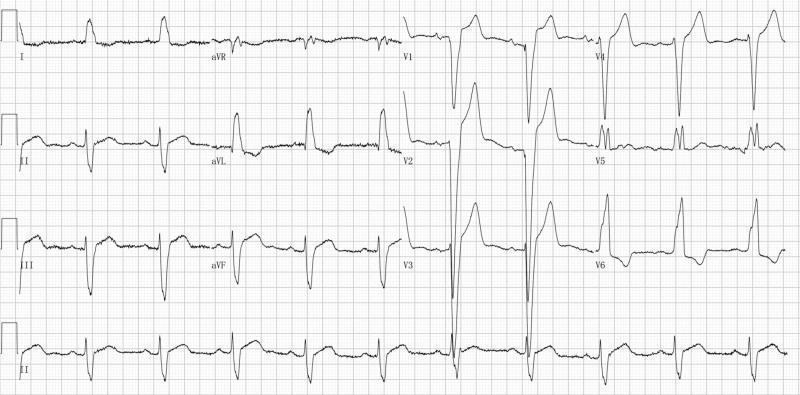
7. 💔 Dilated Cardiomyopathy (DCM) / Heart Failure with Reduced EF
ECG Findings:
- Left Bundle Branch Block (LBBB) — most characteristic: QRS >120 ms, broad monophasic R in I/V5/V6, deep S (QS) in V1–V3
- Poor R-wave progression across precordial leads
- First-degree AV block (PR >200 ms)
- Low voltage QRS (suggests co-existent pericardial effusion or amyloid)
- Left axis deviation
- Atrial arrhythmias (AF common)
- Non-specific ST-T changes
8. 📏 Long QT Syndrome (LQTS)
ECG Findings:
- Prolonged QTc interval: ≥450 ms (males), ≥460 ms (females); ≥500 ms is high risk
- T-wave morphology varies by subtype:
- LQT1: Broad-based T waves
- LQT2: Notched/bifid T waves (low amplitude, jagged)
- LQT3: Late-peaking, peaked T waves with long isoelectric ST
- Prominent U waves (LQT1, drug-induced)
- T-wave alternans — beat-to-beat T-wave variation; marker of high arrhythmia risk
- Torsades de Pointes: polymorphic VT with "twisting" QRS morphology around isoelectric line — initiated by short-long-short RR sequence
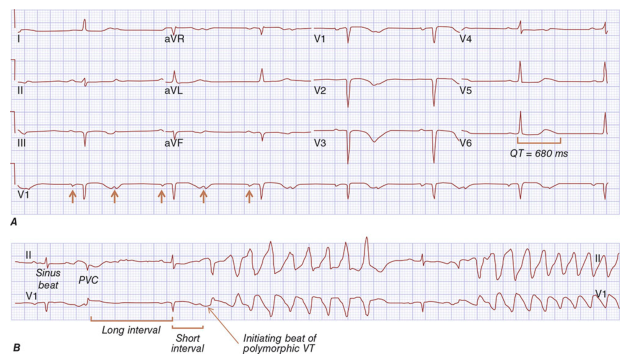
Source: Harrison's Principles of Internal Medicine 22E
9. 🧬 Brugada Syndrome
ECG Findings:
- Type 1 (diagnostic): Coved-type ST elevation ≥2 mm in ≥1 of V1–V2 with right bundle branch block (RBBB) morphology, followed by negative T wave (no isoelectric separation)
- Type 2: Saddle-back ST elevation ≥2 mm (V1–V2), positive/biphasic T wave (not diagnostic alone)
- Type 3: ST elevation <1 mm
- Incomplete RBBB morphology
- May unmask with fever, sodium channel blockers (ajmaline test)
- Substrate for polymorphic VT/VF and sudden cardiac death
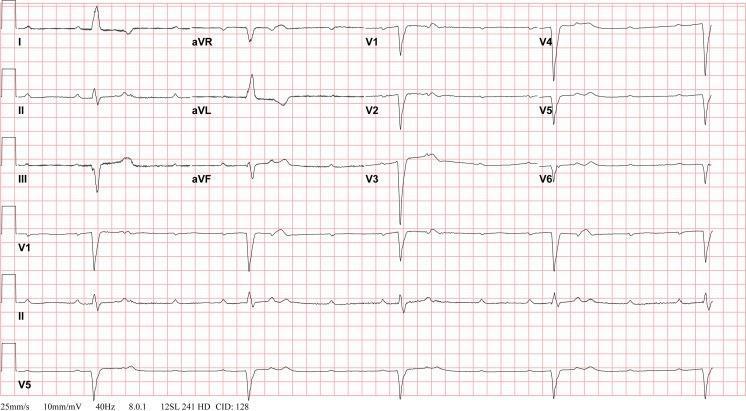
10. 🩸 Cardiac Amyloidosis
ECG Findings (classic combination):
- Low voltage QRS despite echocardiographic LVH ("voltage-mass mismatch" — hallmark)
- QRS amplitude <5 mm in all limb leads, <10 mm in precordial leads
- Pseudo-infarct pattern — pathological Q waves in anterior or inferior leads without true coronary occlusion
- AF — very common (50%+ of patients)
- First-degree and higher-degree AV block
- Left axis deviation
- Poor R-wave progression
Summary Table
| # | Disease | Key ECG Finding(s) |
|---|---|---|
| 1 | STEMI | ST elevation (convex), reciprocal changes, Q waves |
| 2 | Atrial Fibrillation | Absent P waves, irregularly irregular RR |
| 3 | Hypertrophic Cardiomyopathy | LVH voltage, septal Q waves, giant T inversions (apical) |
| 4 | Complete AV Block | AV dissociation, P waves independent of QRS |
| 5 | Acute Pericarditis | Diffuse concave ST elevation, PR depression, saddle shape |
| 6 | WPW Syndrome | Short PR, delta wave, wide QRS (pre-excitation triad) |
| 7 | Dilated Cardiomyopathy | LBBB, poor R progression, low voltage |
| 8 | Long QT Syndrome | Prolonged QTc, notched T waves, Torsades de Pointes |
| 9 | Brugada Syndrome | Coved ST elevation V1–V2, RBBB morphology |
| 10 | Cardiac Amyloidosis | Low voltage + LVH paradox, pseudo-infarct Q waves, AF |
Sources: Tintinalli's Emergency Medicine; Braunwald's Heart Disease; Harrison's Principles of Internal Medicine 22E; Fuster and Hurst's The Heart 15th Ed; Guyton and Hall Textbook of Medical Physiology; Goldman-Cecil Medicine.
This is a shared conversation. Sign in to Orris to start your own chat.