Explain me 10 common heart disease with ECG change and ECG images
Reading File
Finding Sources
Searching Images
ECG electrocardiogram myocardial infarction ST elevation
Finding Sources
Searching Images
atrial fibrillation ECG irregular rhythm absent P waves
Searching Images
heart block ECG PR interval prolonged complete AV block
Searching Images
ventricular fibrillation ventricular tachycardia ECG chaotic rhythm
Searching Images
Wolff-Parkinson-White WPW syndrome delta wave ECG pre-excitation
Searching Images
pulmonary embolism ECG S1Q3T3 right heart strain sinus tachycardia
Searching Images
hypertrophic cardiomyopathy left ventricular hypertrophy ECG deep T wave inversion
Searching Images
pericarditis ECG diffuse ST elevation saddle shape PR depression
Searching Images
Brugada syndrome ECG right bundle branch block ST elevation V1 V2 V3
Searching Images
long QT syndrome ECG torsades de pointes prolonged QTc
Here is a comprehensive guide to 10 common heart diseases with their ECG changes and images:
10 Common Heart Diseases: ECG Changes & Images
1. 🫀 ST-Elevation Myocardial Infarction (STEMI)
ECG Changes
- Hyperacute T-waves (earliest sign — tall, peaked)
- ST-segment elevation ≥1 mm in limb leads or ≥2 mm in precordial leads (convex/tombstone shape)
- Reciprocal ST depression in opposite leads
- Pathological Q waves (>40 ms, >25% of R-wave height) — develop over hours
- T-wave inversion in the affected territory
Localization by Lead
| Territory | Leads with ST Elevation | Artery |
|---|---|---|
| Anterior | V1–V4 | LAD |
| Anterolateral | V1–V6, I, aVL | Proximal LAD |
| Inferior | II, III, aVF | RCA or LCx |
| Lateral | I, aVL, V5–V6 | LCx |
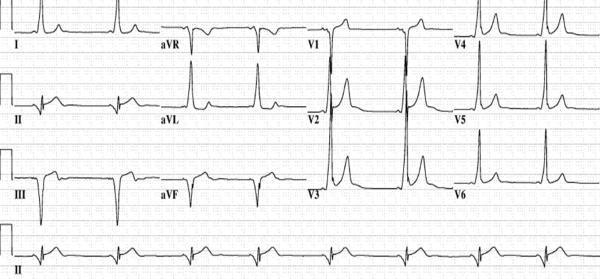
ECG Image — Anterior STEMI
Classic "tombstone" ST elevation across V2–V5 with reciprocal ST depression in II, III, aVF — proximal LAD occlusion.
ECG Image — Inferolateral STEMI
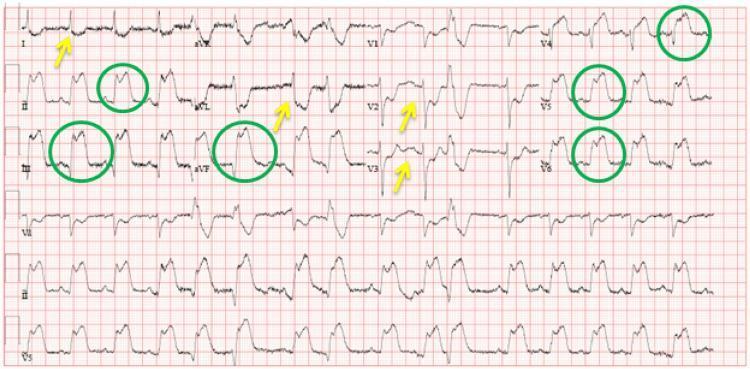
ST elevation (green circles) in II, III, aVF and V4–V6; reciprocal depression (yellow arrows) in I, aVL, and V2–V3.
2. 💔 Atrial Fibrillation (AF)
ECG Changes
- Absent P waves — replaced by chaotic fibrillatory "f" waves (best seen in V1)
- Irregularly irregular R-R intervals (hallmark)
- Narrow QRS complexes (unless aberrant conduction or pre-existing BBB)
- Rate may be rapid (>100 bpm = AF with rapid ventricular response) or controlled
- May show low voltage (pericardial effusion) or LVH voltage criteria
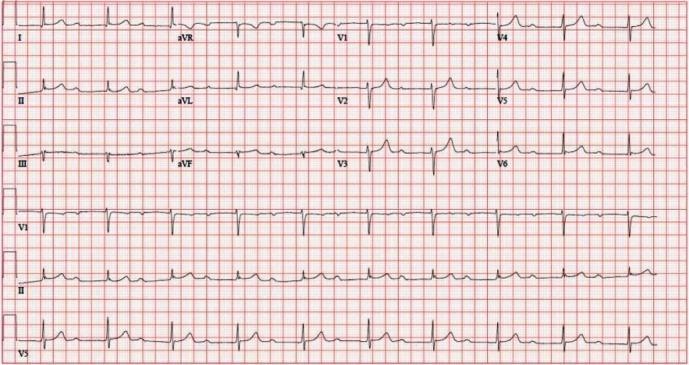
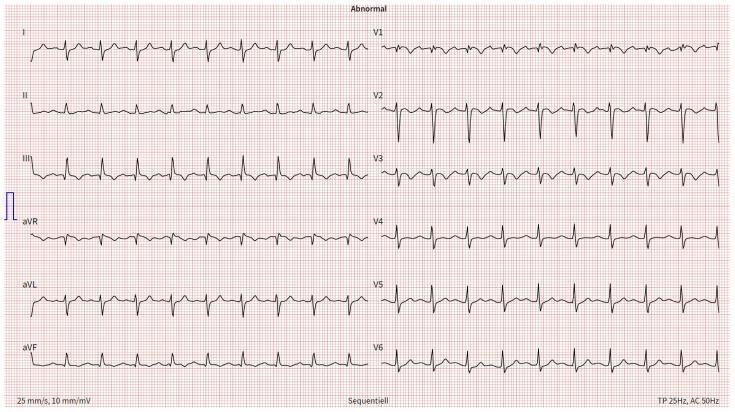
ECG Image — Atrial Fibrillation with Rapid Ventricular Response
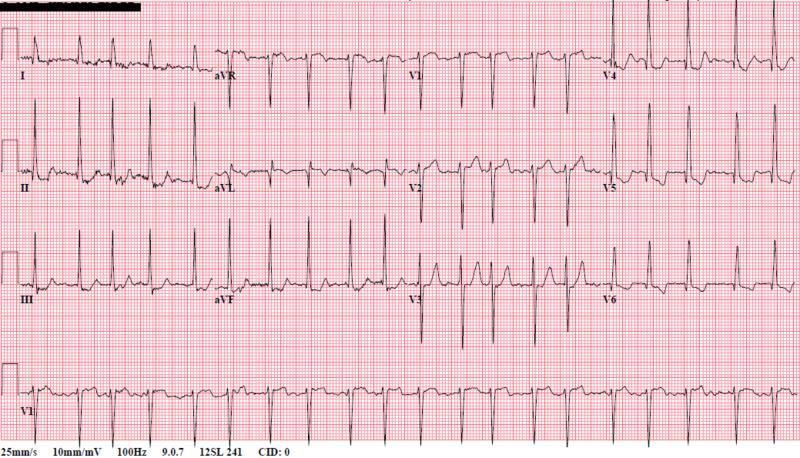
No P waves, chaotic baseline, irregularly irregular narrow QRS complexes — classic AF with rapid ventricular response and LVH voltage.
3. 🔁 AV Heart Blocks
ECG Changes by Degree
| Type | Key ECG Feature |
|---|---|
| 1st Degree | PR interval >200 ms, every P followed by QRS |
| 2nd Degree Mobitz I (Wenckebach) | Progressive PR lengthening → dropped QRS |
| 2nd Degree Mobitz II | Constant PR, sudden non-conducted P wave |
| 3rd Degree (Complete) | AV dissociation — P waves and QRS completely independent |
ECG Image — All 4 Degrees of AV Block
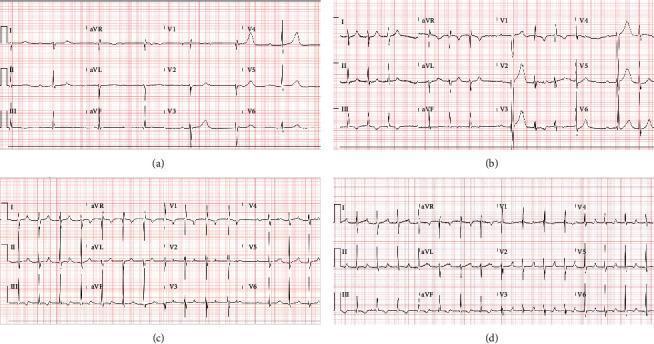
From top: (a) Complete heart block with AV dissociation and escape rhythm 41 bpm; (b) Mobitz II; (c) Wenckebach; (d) 1st degree block — all documented in a patient with myocarditis.
ECG Image — Extreme PR Prolongation (1st Degree Block)
PR interval 512 ms — markedly prolonged, every P still followed by a QRS.
4. ⚡ Ventricular Fibrillation (VF) & Ventricular Tachycardia (VT)
Ventricular Tachycardia
- Wide QRS complexes (>120 ms) at rate >100 bpm
- AV dissociation (P waves march through independently)
- Fusion beats and capture beats (pathognomonic)
- Monomorphic: uniform QRS morphology
- Polymorphic: varying QRS — consider long QT or ischemia
Ventricular Fibrillation
- Completely chaotic, irregular oscillations — no recognizable P, QRS, or T
- No organized ventricular activity
- Immediately life-threatening — cardiac arrest
ECG Image — VF, VT, and PVBs Comparison
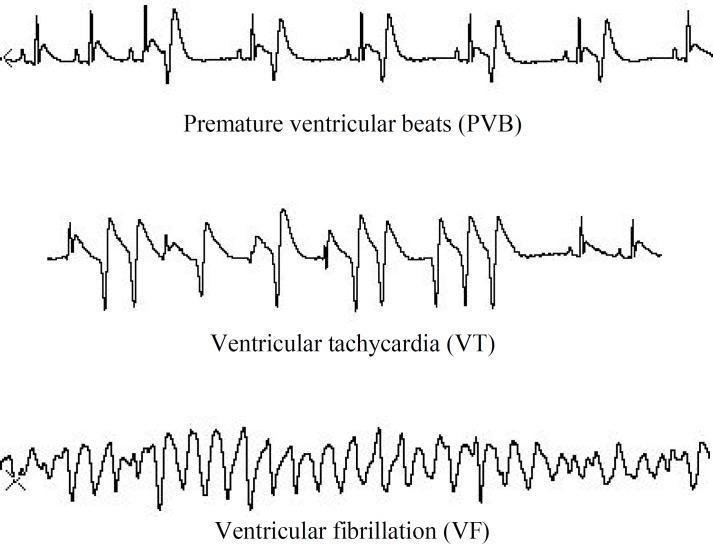
Top: PVBs (ectopic wide beats with compensatory pause). Middle: Monomorphic VT (rapid, regular, wide-complex). Bottom: VF (chaotic undulations, no organized waveforms).
ECG Image — VF Transition from VT
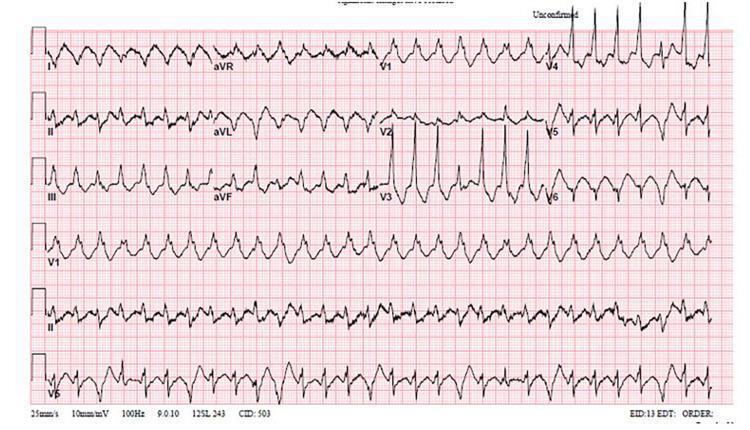
Disorganized, chaotic electrical activity — no P waves, QRS, or T waves identifiable. Pathognomonic VF pattern.
5. 🔌 Wolff-Parkinson-White (WPW) Syndrome
ECG Changes
- Short PR interval (<120 ms) — bypass tract conducts faster than AV node
- Delta wave — slurred initial QRS upstroke (accessory pathway pre-excitation)
- Widened QRS (>120 ms total) due to fusion of delta + normal conduction
- Secondary ST-T changes — discordant repolarization
- Negative delta waves in inferior leads → posteroseptal pathway
- Risk of pre-excited AF → degeneration to VF
ECG Image — WPW with Classic Delta Waves
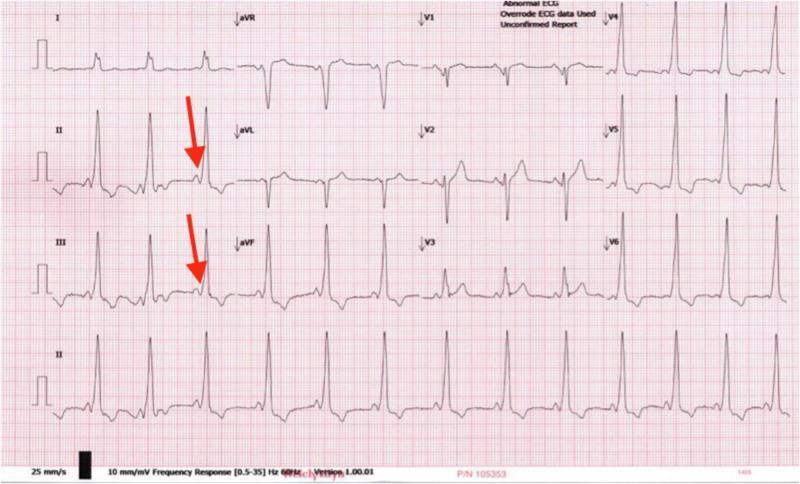
Red arrows highlight delta waves in leads II and III. Short PR, widened QRS, and anteroseptal pathway morphology.
ECG Image — WPW Posteroseptal Pathway
Negative delta waves in II, III, aVF mimic inferior pseudo-infarct Q waves. Positive delta in V1 → posteroseptal accessory pathway.
6. 🫁 Acute Pulmonary Embolism (PE)
ECG Changes
- Sinus tachycardia (most common finding)
- S1Q3T3 pattern — S wave in lead I, Q wave and T-wave inversion in lead III
- Right bundle branch block (complete or incomplete) — acute right heart strain
- T-wave inversions in V1–V4 — right ventricular strain pattern
- Right axis deviation
- P pulmonale (peaked P waves in inferior leads)
- Atrial fibrillation (less common)
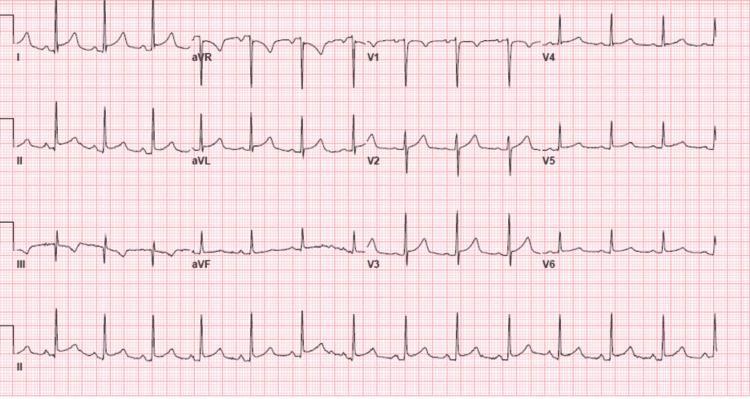
ECG Image — S1Q3T3 with Sinus Tachycardia
Sinus tachycardia 116 bpm, S1Q3T3 pattern, T-wave inversions V1–V3, incomplete RBBB — classic acute PE pattern.
ECG Image — Annotated S1Q3T3
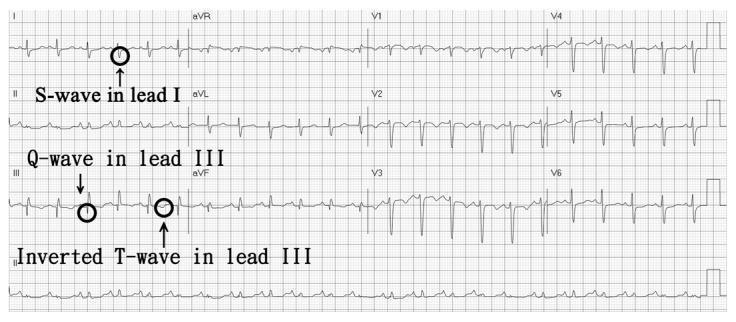
Annotated arrows pointing to: prominent S in I, pathological Q in III, inverted T in III — sinus tachycardia throughout.
7. 🧱 Hypertrophic Cardiomyopathy (HCM)
ECG Changes
- Left ventricular hypertrophy (LVH) — Sokolow-Lyon: S in V1 + R in V5/V6 ≥35 mm
- Giant, deep symmetric T-wave inversions in precordial leads (V2–V5) — especially apical HCM (Yamaguchi syndrome)
- Abnormal Q waves in I, aVL, V5–V6 (septal hypertrophy)
- ST-segment depression in lateral leads
- Left axis deviation
- May develop atrial fibrillation (with associated LVH voltage)
ECG Image — Apical HCM with Giant T-Wave Inversions
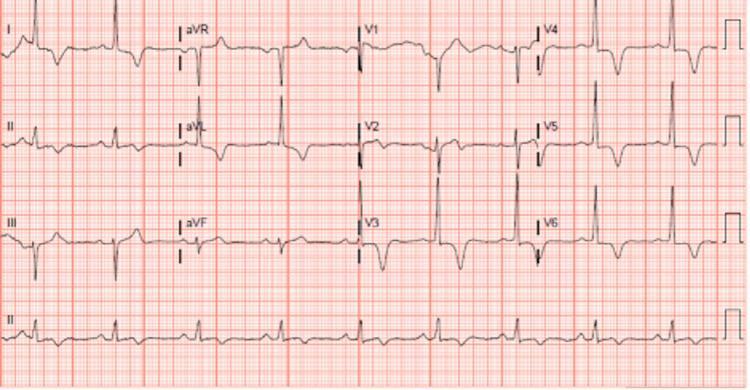
High QRS voltage (LVH) with deep, symmetric T-wave inversions in V3 — classic apical HCM (Yamaguchi) pattern.
ECG Image — HCM with Asymmetric Septal Hypertrophy
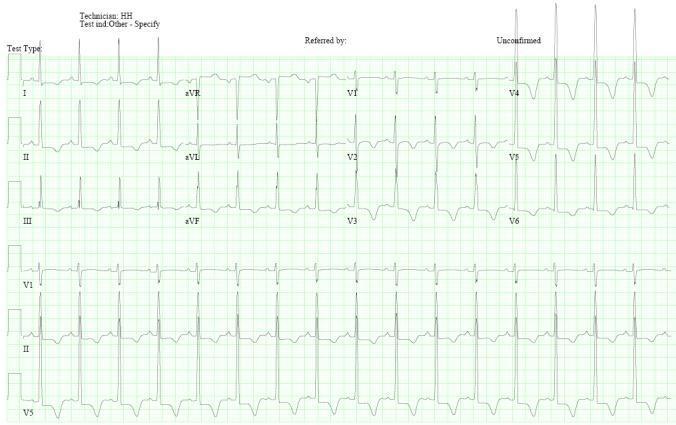
LVH voltage with giant T inversions V2–V5 — characteristic of Yamaguchi/apical HCM. ST abnormalities in limb leads.
8. 🔥 Acute Pericarditis
ECG Changes (4 Stages)
| Stage | Finding |
|---|---|
| Stage 1 | Diffuse concave ST elevation (all leads except aVR/V1) + PR depression |
| Stage 2 | ST returns to baseline, PR depression persists |
| Stage 3 | T-wave inversions develop |
| Stage 4 | Normalization |
- Key features: Saddle-shaped (concave) ST elevation in multiple leads (not one coronary territory), PR-segment depression (most specific sign), Spodick's sign (downsloping TP segment)
- Reciprocal ST depression and PR elevation in aVR only
- No pathological Q waves
ECG Image — Classic Pericarditis with PR Depression

Diffuse concave ST elevation in I, II, III, aVF, V2–V6. PR depression in II (most visible). Reciprocal ST depression + PR elevation in aVR. Spodick's sign present.
ECG Image — Pericarditis with Diffuse ST Changes
Classic Stage 1 pericarditis — concave-upward ST elevation across multiple territories with PR depression in II, III, aVF, V4–V6.
9. 🧬 Brugada Syndrome
ECG Changes
- Type 1 (diagnostic): Coved ST elevation ≥2 mm in V1–V2 (or V1–V3) with inverted T-wave — "coved" pattern
- Type 2: Saddle-back ST elevation ≥0.5 mm in V1–V2 (not diagnostic alone)
- Right bundle branch block morphology (may be incomplete)
- Prolonged PR interval (first-degree AV block)
- Spontaneous or provoked (by Na⁺-channel blockers, fever)
- Associated with sudden cardiac death — risk of VF at rest/during sleep
ECG Image — Type 1 Brugada Pattern
Classic coved ST elevation ≥2 mm in V1 descending to inverted T-wave. Incomplete RBBB morphology in precordial leads — Type 1 Brugada (high-risk phenotype).
ECG Image — Brugada Spontaneous vs Drug-Provoked
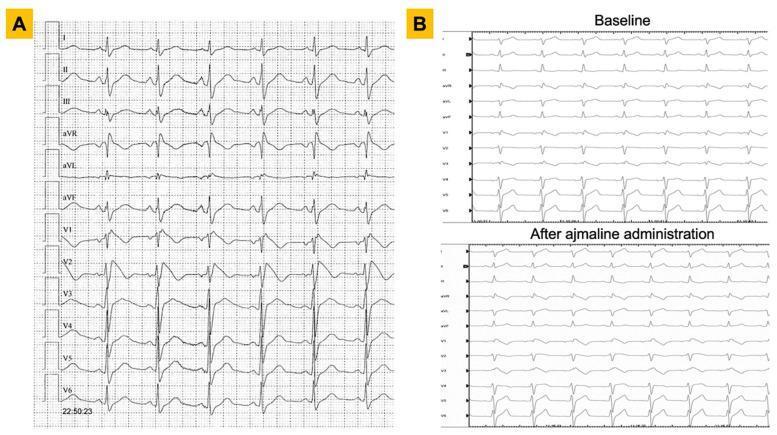
Panel A (25-yr male): spontaneous Type 1 coved pattern in V1–V2. Panel B (36-yr male): RBBB at baseline → coved ST elevation unmasked by ajmaline (Na⁺-channel blocker challenge).
10. ⏱️ Long QT Syndrome (LQTS)
ECG Changes
- Prolonged QTc — Males >440 ms; Females >460 ms (corrected using Bazett formula: QTc = QT/√RR)
- Broad, notched, or bifid T-waves (LQT1: broad; LQT2: notched; LQT3: late-onset peaked T)
- T-wave alternans — beat-to-beat variation in T-wave morphology/amplitude (high risk sign)
- Torsades de Pointes (TdP) — polymorphic VT with "twisting" QRS axis around isoelectric line
- May degenerate to VF and sudden cardiac death
- Causes: congenital (KCNQ1, HERG, SCN5A mutations) or acquired (drugs, hypokalemia, hypomagnesemia)
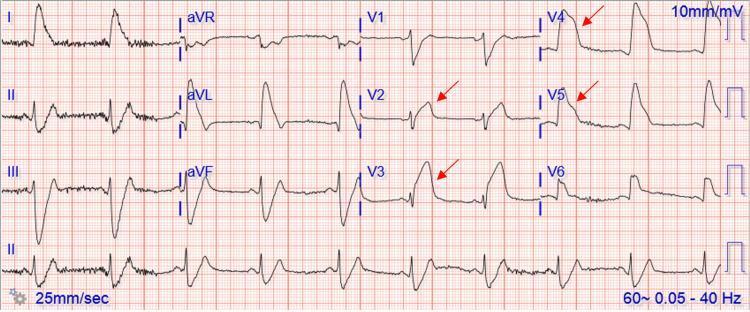
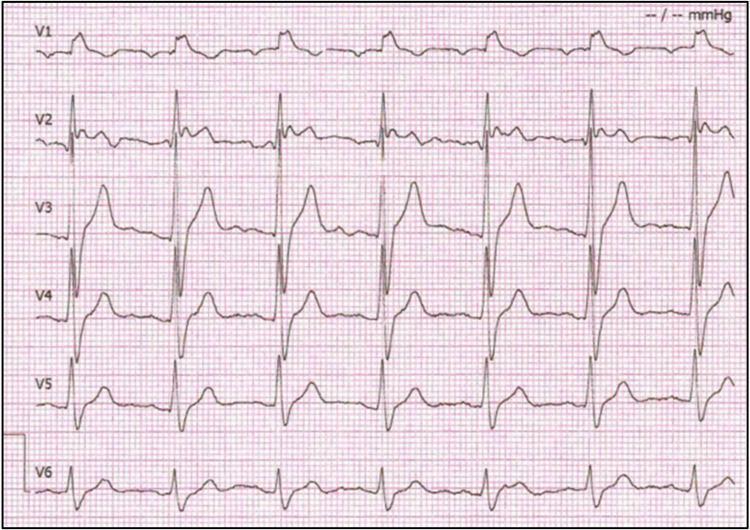
ECG Image — Prolonged QTc with T-Wave Alternans
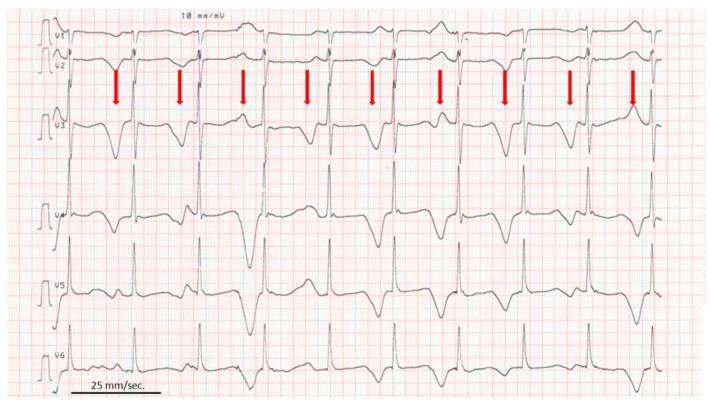
QTc 610 ms with macro T-wave alternans (beat-to-beat T-wave variation highlighted by red arrows in V2) — extremely high risk for TdP.
ECG Image — LQTS with Torsades de Pointes
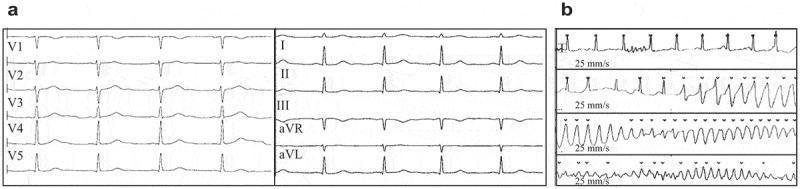
Panel (a): Sinus rhythm with QTc 478 ms. Panel (b): Rhythm strips showing onset of Torsades de Pointes — polymorphic VT with characteristic "twisting" QRS morphology around the isoelectric baseline.
Quick Reference Summary Table
| # | Condition | Key ECG Finding | Emergency? |
|---|---|---|---|
| 1 | STEMI | Convex ST elevation, Q waves, reciprocal changes | 🚨 Yes — reperfusion <90 min |
| 2 | Atrial Fibrillation | Absent P waves, irregularly irregular | ⚠️ Rate/rhythm control |
| 3 | AV Heart Block | PR prolongation → AV dissociation | 🚨 3rd degree = pacemaker |
| 4 | VT / VF | Wide complex tachycardia / chaotic rhythm | 🚨 Defibrillate VF immediately |
| 5 | WPW | Delta wave, short PR, wide QRS | ⚠️ Avoid AV nodal blockers |
| 6 | Pulmonary Embolism | S1Q3T3, sinus tachycardia, RV strain | 🚨 Anticoagulate/thrombolyze |
| 7 | HCM | LVH voltage, giant T-wave inversions | ⚠️ SCD risk stratify |
| 8 | Pericarditis | Diffuse concave ST↑, PR depression | ⚠️ NSAIDs + restrict activity |
| 9 | Brugada Syndrome | Coved ST elevation V1–V2, RBBB | ⚠️ ICD if symptomatic |
| 10 | Long QT Syndrome | Prolonged QTc, TdP | 🚨 Remove triggers, Mg²⁺, ICD |
Clinical Pearl: Always interpret ECGs in clinical context — many patterns overlap. The S1Q3T3 of PE has low sensitivity (~20%) but high specificity when combined with tachycardia. Brugada pattern can be unmasked by fever or sodium-channel blockers. Pericarditis PR depression is the most specific differentiating sign from STEMI.
This is a shared conversation. Sign in to Orris to start your own chat.