
Sismple muscle curve Effect of increasing the strength of stimuli Effect of temperature on muscle contraction Information about the above mentioned topics clearly
simple muscle curve twitch latent period contraction relaxation physiology
effect of temperature on muscle contraction velocity force physiology cold warm
Skeletal Muscle Physiology: Three Core Topics
1. Simple Muscle Curve (Single Muscle Twitch)
Phases of a Single Muscle Twitch
| Phase | Duration (approx.) | What Happens |
|---|---|---|
| Latent Period | ~2-5 ms | Time between the stimulus and the start of visible contraction. The action potential travels along the sarcolemma, the sarcoplasmic reticulum releases Ca²⁺, and Ca²⁺ binds to troponin - but shortening has not yet begun. |
| Contraction Phase | ~40 ms | Ca²⁺-troponin binding shifts tropomyosin off actin binding sites. Cross-bridges form between myosin heads and actin, and the sliding filament mechanism shortens the sarcomere. Tension rises to a peak. |
| Relaxation Phase | ~50 ms | Ca²⁺ is actively pumped back into the sarcoplasmic reticulum. Tropomyosin returns to block actin sites. Cross-bridge cycling stops and muscle tension falls back to baseline. |
Key Points
- The total duration of a twitch varies by muscle type: fast-twitch (type II) fibers produce a rapid, high-force twitch; slow-twitch (type I) fibers produce a slower, more prolonged twitch.
- A single twitch produces very little force relative to the maximum possible. Effective contraction in life requires multiple stimuli.
- Recording method: The muscle is attached to a force transducer (isometric recording) or a weighted lever (isotonic recording). An isometric system records force changes independent of load inertia and is the standard for comparing different muscle types.
2. Effect of Increasing the Strength of Stimuli
A. Threshold, Recruitment, and the All-or-None Law
- Each individual muscle fiber obeys the all-or-none law: if a stimulus exceeds the threshold of that fiber, it contracts maximally; below threshold, it does not contract at all.
- However, a whole muscle contains hundreds of motor units, each with its own threshold. Therefore the muscle as a whole shows a graded response to increasing stimulus strength.
- Subthreshold stimulus - No fibers are recruited; no contraction occurs.
- Threshold (minimal) stimulus - The most excitable (smallest) motor units reach threshold and contract. A small tension is produced.
- Submaximal stimulus - More motor units are recruited as stimulus strength rises. Total tension increases progressively.
- Maximal stimulus - All motor units are firing. Maximum contraction is achieved.
- Supramaximal stimulus - Stimulus strength above the maximal threshold; no additional tension increase, since all motor units are already active.
B. Size Principle (Henneman's Size Principle)
- Fine, precise movements at low force levels (small units)
- Powerful contractions at high force levels (large units recruited progressively)
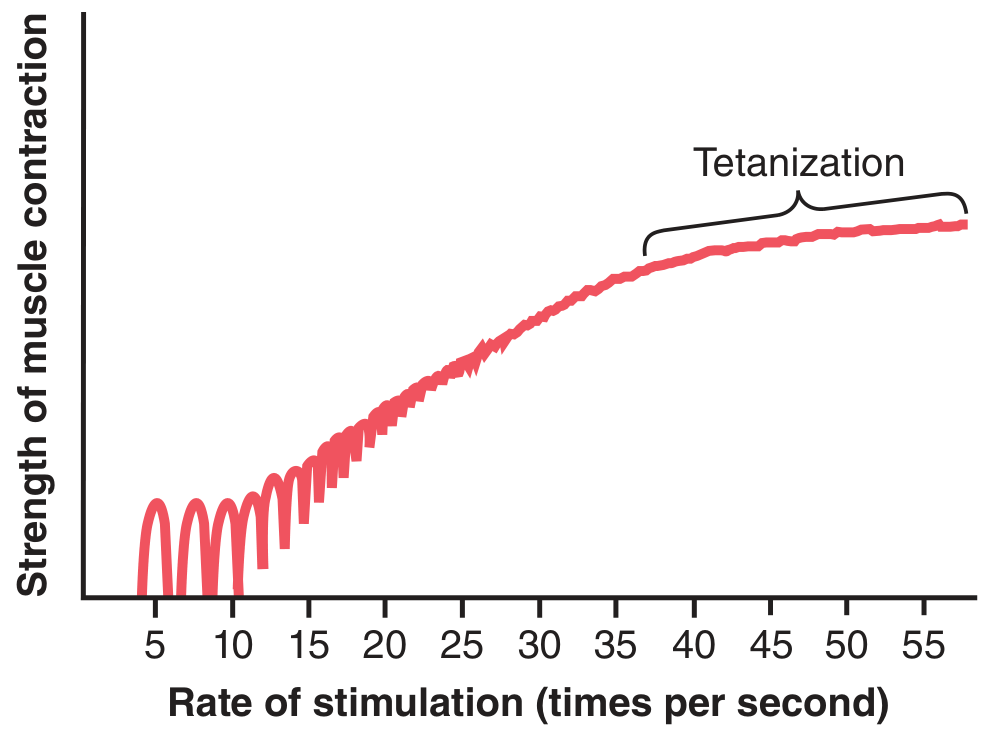
C. Frequency Summation and Tetanization
- Single twitches are seen at low frequencies
- Wave summation (incomplete tetanus) occurs when a second stimulus arrives before the muscle fully relaxes - the second twitch adds to the first, increasing total tension
- Complete tetanus occurs when stimuli arrive so rapidly that individual twitches fuse completely; Ca²⁺ levels remain continuously elevated in the sarcoplasm and maximum tension is sustained
D. Treppe (Staircase Effect)
3. Effect of Temperature on Muscle Contraction
Effect of Warmth (Elevated Temperature ~37-40°C)
| Parameter | Effect of Warming |
|---|---|
| Latent period | Shortened (faster Ca²⁺ release and cross-bridge formation) |
| Contraction speed | Increased (cross-bridge cycling rate rises with temperature) |
| Relaxation rate | Faster (Ca²⁺ re-uptake into SR is more rapid) |
| Peak force | Slightly increased up to physiological optimum (~37°C) |
| Enzyme activity | Higher - ATP production, ATPase activity, and metabolic rates all increase |
| Excitability | Mild increase in membrane excitability |
Effect of Cold (Below Physiological Temperature)
| Parameter | Effect of Cooling |
|---|---|
| Latent period | Prolonged |
| Contraction speed | Reduced (slower cross-bridge cycling) |
| Relaxation phase | Slower and more prolonged (Ca²⁺ re-uptake slowed) |
| Peak tension | Reduced at very low temperatures |
| Muscle stiffness | Increased (higher viscosity of sarcoplasm) |
| Nerve conduction | Slowed, reducing signal transmission to muscle |
| Motor unit firing rate | Decreased |
Classic Experimental Observations (Frog Muscle / Isolated Preparation)
- Cold Ringer's solution: The twitch curve is broader and flatter - prolonged contraction and relaxation phases with a reduced peak height. Duration increases but height decreases.
- Warm Ringer's solution: The twitch curve becomes narrow and taller - shortened latent, contraction, and relaxation phases, with better peak tension (up to the physiological optimum).
- Very high temperature (above ~42-45°C): Contraction becomes impaired due to protein denaturation. Force falls and irreversible damage can occur.
Mechanism Summary
- Enzyme kinetics - Warmer temperatures speed up ATPase activity of myosin and SERCA pump activity (Ca²⁺ re-uptake)
- Membrane fluidity - Affects ion channel gating speeds and action potential conduction velocity
- Cross-bridge kinetics - Rate of cross-bridge attachment, power stroke, and detachment all increase with warming
- Ca²⁺ sensitivity - Isometric force increases substantially on warming from <10°C up to physiological temperatures (>30°C), largely due to increased Ca²⁺ sensitivity of the contractile proteins
Practical Implications
- Warm-up exercises before athletic activity increase muscle temperature, improving contraction speed, power, and reducing injury risk
- Cold environments or ice packs reduce muscle strength and speed - clinically relevant in post-operative or athletic recovery contexts
- Fever at moderate levels (38-39°C) can mildly enhance muscle performance; extreme hyperthermia impairs it
Summary Table
| Topic | Key Concept |
|---|---|
| Simple muscle curve | Three phases: Latent → Contraction → Relaxation; follows all-or-none law per fiber |
| Increasing stimulus strength | Recruits more motor units (size principle) → graded whole-muscle response; at high frequency → summation → tetanus |
| Temperature | Warm = faster, stronger contractions; Cold = slower, weaker, prolonged twitches; extreme heat = denaturation |
Can you generate images or graphs for the respective answers
Simple muscle twitch curve (myogram) diagram for physiology education. A clean labeled graph with time on the x-axis and muscle tension/force on the y-axis. The curve shows three clearly labeled phases: 1) Latent Period - a flat line after the stimulus marker, 2) Contraction Phase - a rising curve to peak tension, 3) Relaxation Phase - a falling curve back to baseline. Include a vertical arrow at the start labeled "Stimulus applied". Label the latent period duration (~2-5ms), contraction phase (~40ms), and relaxation phase (~50ms). The curve should be smooth and bell-shaped overall. Include annotation showing the action potential spike before the mechanical response. Clean white background, professional medical textbook illustration style with clear axis labels.
Physiology diagram showing the effect of increasing stimulus strength on whole muscle contraction. A clean labeled graph with stimulus intensity on the x-axis (from weak to strong) and muscle tension/force on the y-axis. The graph shows: 1) Subthreshold zone - no response (flat line), 2) Threshold point marked with a dashed vertical line labeled "Minimal/Threshold Stimulus", 3) A graded rising curve as more motor units are recruited, 4) Maximal stimulus point marked with a dashed line where the curve plateaus, 5) Supramaximal zone - flat plateau showing no further increase. Include a second smaller inset graph showing frequency summation: individual twitches at low frequency, wave summation at medium frequency, and complete tetanus (smooth plateau) at high frequency. Label size principle, recruitment, and tetanization. White background, educational medical illustration style.
Physiology diagram showing the effect of temperature on muscle contraction (simple muscle twitch curves). Three overlapping muscle twitch curves on the same graph with time on x-axis and muscle tension on y-axis. Three curves clearly labeled: 1) "Cold (Low Temperature)" - a wide, flat, prolonged curve with reduced peak height and extended relaxation phase, shown in blue, 2) "Normal/Optimal (37°C)" - a moderate bell-shaped curve with good peak height, shown in green, 3) "Warm (High Temperature ~40°C)" - a tall, narrow, sharp curve with highest peak and faster contraction and relaxation, shown in red. Include annotations showing: shorter latent period in warm, faster contraction velocity, faster relaxation. Add a small table or legend summarizing effects. Clean white background, professional medical textbook style, clear axis labels.
429 Too Many Requests. {'message': '{\n "error": {\n "code": 429,\n "message": "Resource exhausted. Please try again later. Please refer to https://cloud.google.com/vertex-ai/generative-ai/docs/error-code-429 for more details.",\n "status": "RESOURCE_EXHAUSTED"\n }\n}\n', 'status': 'Too Many Requests'}
We encountered an error while processing your request. Please try again or reach out to us for help.
🙂 atleast can u minimize the answers?
1. Simple Muscle Curve (Single Twitch)
| Phase | Duration | Event |
|---|---|---|
| Latent Period | ~2-5 ms | AP travels sarcolemma → Ca²⁺ released; no shortening yet |
| Contraction | ~40 ms | Ca²⁺ binds troponin → cross-bridges form → tension rises |
| Relaxation | ~50 ms | Ca²⁺ pumped back → cross-bridges detach → tension falls |
2. Effect of Increasing Stimulus Strength
- Subthreshold → no response
- Threshold → smallest motor units fire (weak contraction)
- Increasing strength → more motor units recruited (size principle)
- Maximal stimulus → all motor units active, peak force
- Supramaximal → no further increase
3. Effect of Temperature on Muscle Contraction
| Temperature | Effect |
|---|---|
| Cold | Slow contraction, prolonged relaxation, reduced force, stiff muscle |
| Normal (37°C) | Optimal speed and force |
| Warm (~40°C) | Faster twitch, higher peak, quicker relaxation |
| Very high (>42°C) | Protein denaturation → force drops |
Generate a quick reference PDF with muscle twitch diagrams
Simple muscle twitch myogram diagram, physiology textbook style. Clean graph on white background. X-axis labeled "Time (ms)" with markers at 0, 10, 20, 40, 60, 100ms. Y-axis labeled "Muscle Tension". A vertical dashed arrow at time 0 labeled "Stimulus". The curve: flat latent period from 0-5ms, then smooth rise to peak tension around 40ms (contraction phase), then smooth fall back to baseline by 100ms (relaxation phase). Three bracketed annotations: "Latent Period (2-5ms)", "Contraction Phase (~40ms)", "Relaxation Phase (~50ms)". Color the curve red. Professional medical illustration, no background clutter.
Physiology graph: effect of increasing stimulus strength on whole muscle contraction. White background, clean axes. X-axis: "Stimulus Strength (intensity)" with zones labeled left to right: Subthreshold, Threshold, Submaximal, Maximal, Supramaximal. Y-axis: "Muscle Force (Tension)". The response curve: flat at zero in subthreshold zone, begins rising at threshold (marked with dashed vertical line), rises steeply through submaximal zone as more motor units are recruited, reaches a plateau at maximal stimulus (marked with dashed vertical line), remains flat in supramaximal zone. Annotate: "Motor units recruited (Size Principle)" on the rising slope, "All motor units active" at plateau. A small inset box shows frequency summation: 3 separate twitches → incomplete tetanus wavy line → smooth tetanus plateau, labeled "Increasing Frequency". Professional textbook style, blue curve.
Physiology diagram: effect of temperature on simple muscle twitch. Three overlapping bell-shaped twitch curves on one graph. White background. X-axis: "Time (ms)". Y-axis: "Muscle Tension". Three curves: 1) Blue curve labeled "Cold Temperature" - wide, flat, low peak, prolonged duration, 2) Green curve labeled "Normal 37°C" - medium height, medium width, 3) Red curve labeled "Warm ~40°C" - tall, narrow, sharp peak, fastest rise and fall. All three start at the same stimulus point on left. Annotations: "Shorter latent period" pointing to red curve start, "Higher peak force" pointing to red curve top, "Prolonged relaxation" pointing to blue curve tail. Clean professional medical textbook style.
mkdir -p /home/daytona/workspace/muscle-twitch-pdf
~/muscle-twitch-pdf/muscle_twitch.html
<!DOCTYPE html>
<html lang="en">
<head>
<meta charset="UTF-8">
<title>Muscle Twitch - Quick Reference</title>
<style>
@import url('https://fonts.googleapis.com/css2?family=Inter:wght@400;600;700&display=swap');
* { margin: 0; padding: 0; box-sizing: border-box; }
body {
font-family: 'Inter', Arial, sans-serif;
background: #ffffff;
color: #1a1a2e;
font-size: 12px;
line-height: 1.5;
}
.cover {
width: 100%;
min-height: 297mm;
background: linear-gradient(135deg, #1a1a2e 0%, #16213e 50%, #0f3460 100%);
display: flex;
flex-direction: column;
justify-content: center;
align-items: center;
text-align: center;
padding: 60px 40px;
page-break-after: always;
}
.cover .badge {
background: rgba(229, 57, 53, 0.2);
border: 1px solid #e53935;
color: #ef9a9a;
padding: 6px 18px;
border-radius: 20px;
font-size: 11px;
letter-spacing: 2px;
text-transform: uppercase;
margin-bottom: 24px;
}
.cover h1 {
color: #ffffff;
font-size: 38px;
font-weight: 700;
margin-bottom: 12px;
line-height: 1.2;
}
.cover h1 span { color: #e53935; }
.cover p {
color: #90caf9;
font-size: 15px;
max-width: 480px;
margin-bottom: 40px;
}
.cover .topics {
display: flex;
gap: 14px;
flex-wrap: wrap;
justify-content: center;
margin-bottom: 50px;
}
.cover .topic-chip {
background: rgba(255,255,255,0.08);
border: 1px solid rgba(255,255,255,0.2);
color: #e0e0e0;
padding: 8px 16px;
border-radius: 8px;
font-size: 11px;
}
.cover .footer-note {
color: rgba(255,255,255,0.4);
font-size: 10px;
letter-spacing: 1px;
text-transform: uppercase;
margin-top: 20px;
}
/* Pages */
.page {
width: 100%;
min-height: 297mm;
padding: 28px 36px;
page-break-after: always;
background: #ffffff;
}
.page-header {
display: flex;
align-items: center;
justify-content: space-between;
border-bottom: 3px solid #e53935;
padding-bottom: 10px;
margin-bottom: 20px;
}
.page-header .topic-num {
background: #e53935;
color: white;
font-size: 11px;
font-weight: 700;
padding: 4px 12px;
border-radius: 4px;
letter-spacing: 1px;
text-transform: uppercase;
}
.page-header h2 {
font-size: 20px;
font-weight: 700;
color: #1a1a2e;
}
.page-header .sub {
font-size: 10px;
color: #888;
text-transform: uppercase;
letter-spacing: 1px;
}
.diagram-box {
background: #f8f9ff;
border: 1px solid #e0e4f5;
border-radius: 10px;
padding: 16px;
text-align: center;
margin-bottom: 20px;
}
.diagram-box img {
max-width: 100%;
max-height: 260px;
object-fit: contain;
border-radius: 6px;
}
.diagram-caption {
font-size: 10px;
color: #666;
margin-top: 8px;
font-style: italic;
}
.content-grid {
display: grid;
grid-template-columns: 1fr 1fr;
gap: 14px;
margin-bottom: 16px;
}
.card {
background: #f8f9ff;
border-left: 4px solid #1a1a2e;
border-radius: 0 8px 8px 0;
padding: 12px 14px;
}
.card.red { border-left-color: #e53935; }
.card.blue { border-left-color: #1565c0; }
.card.green { border-left-color: #2e7d32; }
.card.orange { border-left-color: #e65100; }
.card h4 {
font-size: 11px;
font-weight: 700;
text-transform: uppercase;
letter-spacing: 0.5px;
margin-bottom: 6px;
color: #1a1a2e;
}
.card p { font-size: 11px; color: #333; line-height: 1.5; }
table {
width: 100%;
border-collapse: collapse;
margin-bottom: 16px;
font-size: 11px;
}
thead tr {
background: #1a1a2e;
color: white;
}
thead th {
padding: 8px 10px;
text-align: left;
font-weight: 600;
letter-spacing: 0.3px;
}
tbody tr:nth-child(even) { background: #f0f4ff; }
tbody tr:nth-child(odd) { background: #ffffff; }
tbody td {
padding: 7px 10px;
border-bottom: 1px solid #e8ecf5;
color: #2c2c2c;
}
.phase-tag {
display: inline-block;
padding: 2px 8px;
border-radius: 10px;
font-size: 10px;
font-weight: 600;
color: white;
}
.phase-tag.p1 { background: #1565c0; }
.phase-tag.p2 { background: #e53935; }
.phase-tag.p3 { background: #2e7d32; }
.key-facts {
background: #fff8e1;
border: 1px solid #ffe082;
border-radius: 8px;
padding: 12px 16px;
margin-top: 14px;
}
.key-facts h4 {
font-size: 11px;
font-weight: 700;
color: #e65100;
margin-bottom: 6px;
text-transform: uppercase;
letter-spacing: 0.5px;
}
.key-facts ul {
padding-left: 16px;
}
.key-facts ul li {
font-size: 11px;
color: #333;
margin-bottom: 3px;
}
/* Summary page */
.summary-page {
width: 100%;
min-height: 297mm;
padding: 28px 36px;
background: #ffffff;
}
.summary-grid {
display: grid;
grid-template-columns: 1fr 1fr 1fr;
gap: 14px;
margin-top: 20px;
}
.summary-card {
border: 1px solid #e0e4f5;
border-radius: 10px;
overflow: hidden;
}
.summary-card .sc-header {
padding: 10px 14px;
color: white;
font-weight: 700;
font-size: 12px;
}
.summary-card.t1 .sc-header { background: #e53935; }
.summary-card.t2 .sc-header { background: #1565c0; }
.summary-card.t3 .sc-header { background: #2e7d32; }
.summary-card .sc-body {
padding: 12px 14px;
}
.summary-card .sc-body ul {
padding-left: 14px;
}
.summary-card .sc-body ul li {
font-size: 11px;
color: #333;
margin-bottom: 4px;
}
.page-num {
text-align: right;
font-size: 9px;
color: #aaa;
margin-top: 10px;
text-transform: uppercase;
letter-spacing: 1px;
}
</style>
</head>
<body>
<!-- COVER PAGE -->
<div class="cover">
<div class="badge">Physiology Quick Reference</div>
<h1>Skeletal Muscle<br><span>Twitch & Contraction</span></h1>
<p>A concise visual guide to muscle mechanics, stimulus-response relationships, and temperature effects</p>
<div class="topics">
<div class="topic-chip">01 Simple Muscle Curve</div>
<div class="topic-chip">02 Effect of Stimulus Strength</div>
<div class="topic-chip">03 Effect of Temperature</div>
</div>
<div class="footer-note">Based on Guyton & Hall Textbook of Medical Physiology</div>
</div>
<!-- PAGE 1: SIMPLE MUSCLE CURVE -->
<div class="page">
<div class="page-header">
<div>
<div class="topic-num">Topic 01</div>
<h2>Simple Muscle Curve</h2>
<div class="sub">Single Twitch Myogram</div>
</div>
</div>
<div class="diagram-box">
<img src="https://cdn.orris.care/image-gen/3cb125f57266473289aaf3cb6124c3aa.png" alt="Simple Muscle Twitch Curve" />
<div class="diagram-caption">Fig 1. Myogram of a single muscle twitch showing the three phases after a threshold stimulus.</div>
</div>
<table>
<thead>
<tr>
<th>Phase</th>
<th>Duration</th>
<th>Key Events</th>
</tr>
</thead>
<tbody>
<tr>
<td><span class="phase-tag p1">Latent Period</span></td>
<td>2 - 5 ms</td>
<td>Action potential travels sarcolemma → SR releases Ca²⁺ → no shortening yet</td>
</tr>
<tr>
<td><span class="phase-tag p2">Contraction Phase</span></td>
<td>~40 ms</td>
<td>Ca²⁺ binds troponin → tropomyosin shifts → cross-bridges form → tension rises to peak</td>
</tr>
<tr>
<td><span class="phase-tag p3">Relaxation Phase</span></td>
<td>~50 ms</td>
<td>Ca²⁺ pumped back into SR → cross-bridges detach → tension falls to baseline</td>
</tr>
</tbody>
</table>
<div class="content-grid">
<div class="card red">
<h4>All-or-None Law</h4>
<p>Each individual muscle fiber either contracts maximally or not at all when threshold is reached. There is no partial contraction of a single fiber.</p>
</div>
<div class="card blue">
<h4>Isometric vs Isotonic</h4>
<p><strong>Isometric:</strong> Muscle develops force without shortening.<br><strong>Isotonic:</strong> Muscle shortens against a constant load. Most lab recordings use isometric systems.</p>
</div>
<div class="card green">
<h4>Fast vs Slow Fibers</h4>
<p>Type II (fast) fibers: short, sharp twitch. Type I (slow) fibers: longer, lower-force twitch. Every muscle contains a mix of both types.</p>
</div>
<div class="card orange">
<h4>Staircase Effect (Treppe)</h4>
<p>Successive twitches on a rested muscle show increasing force over 10-50 twitches due to progressive Ca²⁺ accumulation in the cytosol.</p>
</div>
</div>
<div class="key-facts">
<h4>Key Facts to Remember</h4>
<ul>
<li>A single twitch produces very little functional force - sustained contractions require repeated stimuli.</li>
<li>The latent period corresponds to excitation-contraction coupling, not mechanical delay.</li>
<li>Ca²⁺ is the key trigger: released from SR during contraction, pumped back during relaxation.</li>
</ul>
</div>
<div class="page-num">Page 1 of 3</div>
</div>
<!-- PAGE 2: EFFECT OF STIMULUS STRENGTH -->
<div class="page">
<div class="page-header">
<div>
<div class="topic-num">Topic 02</div>
<h2>Effect of Increasing Stimulus Strength</h2>
<div class="sub">Recruitment, Summation & Tetanus</div>
</div>
</div>
<div class="diagram-box">
<img src="https://cdn.orris.care/image-gen/696efb6047ad4990a43f5feed1c2f070.png" alt="Effect of Increasing Stimulus Strength" />
<div class="diagram-caption">Fig 2. Graded whole-muscle response to increasing stimulus intensity, and frequency summation leading to tetanization.</div>
</div>
<table>
<thead>
<tr>
<th>Stimulus Level</th>
<th>Motor Units Active</th>
<th>Result</th>
</tr>
</thead>
<tbody>
<tr>
<td>Subthreshold</td>
<td>None</td>
<td>No contraction</td>
</tr>
<tr>
<td>Threshold (Minimal)</td>
<td>Smallest motor units only</td>
<td>Weak contraction begins</td>
</tr>
<tr>
<td>Submaximal</td>
<td>Progressively more recruited</td>
<td>Force increases gradually</td>
</tr>
<tr>
<td>Maximal</td>
<td>All motor units active</td>
<td>Maximum force reached</td>
</tr>
<tr>
<td>Supramaximal</td>
<td>All motor units (no change)</td>
<td>No additional force increase</td>
</tr>
</tbody>
</table>
<div class="content-grid">
<div class="card blue">
<h4>Size Principle (Henneman)</h4>
<p>Small motor units (small neurons) are recruited first. Large motor units last. This allows fine control at low forces and powerful bursts at high forces.</p>
</div>
<div class="card red">
<h4>Frequency Summation</h4>
<p>If a 2nd stimulus arrives before full relaxation, the 2nd twitch adds onto the 1st - increasing total tension. This is wave summation.</p>
</div>
<div class="card green">
<h4>Incomplete Tetanus</h4>
<p>Twitches fuse partially at medium frequencies. Tension rises in a jagged staircase pattern. Individual twitches are still distinguishable.</p>
</div>
<div class="card orange">
<h4>Complete Tetanus</h4>
<p>At high frequency, twitches fuse completely into a smooth plateau. Ca²⁺ remains elevated continuously. Max tetanic force = 3-4 kg/cm² of muscle.</p>
</div>
</div>
<div class="key-facts">
<h4>Key Facts to Remember</h4>
<ul>
<li>Whole muscle = graded response; single fiber = all-or-none. Both are true simultaneously.</li>
<li>Maximum tetanic contraction averages 50 lbs/inch² (~3-4 kg/cm²).</li>
<li>Asynchronous motor unit firing produces smooth, non-fatiguing contractions in normal movement.</li>
<li>Tetany occurs because Ca²⁺ stays elevated between action potentials, preventing relaxation.</li>
</ul>
</div>
<div class="page-num">Page 2 of 3</div>
</div>
<!-- PAGE 3: EFFECT OF TEMPERATURE -->
<div class="page">
<div class="page-header">
<div>
<div class="topic-num">Topic 03</div>
<h2>Effect of Temperature on Muscle Contraction</h2>
<div class="sub">Warm vs Normal vs Cold</div>
</div>
</div>
<div class="diagram-box">
<img src="https://cdn.orris.care/image-gen/0837e449dfe64302acb0b494cfb41674.png" alt="Effect of Temperature on Muscle Contraction" />
<div class="diagram-caption">Fig 3. Three twitch curves comparing cold, normal (37°C), and warm temperature conditions.</div>
</div>
<table>
<thead>
<tr>
<th>Temperature</th>
<th>Latent Period</th>
<th>Contraction Speed</th>
<th>Relaxation</th>
<th>Peak Force</th>
</tr>
</thead>
<tbody>
<tr>
<td style="color:#1565c0; font-weight:600;">Cold (<20°C)</td>
<td>Prolonged</td>
<td>Slow</td>
<td>Prolonged, sluggish</td>
<td>Reduced</td>
</tr>
<tr>
<td style="color:#2e7d32; font-weight:600;">Normal (37°C)</td>
<td>Normal</td>
<td>Optimal</td>
<td>Normal</td>
<td>Optimal</td>
</tr>
<tr>
<td style="color:#e65100; font-weight:600;">Warm (~40°C)</td>
<td>Shorter</td>
<td>Faster</td>
<td>Faster</td>
<td>Higher</td>
</tr>
<tr>
<td style="color:#b71c1c; font-weight:600;">Very Hot (>42°C)</td>
<td>Variable</td>
<td>Impaired</td>
<td>Impaired</td>
<td>Falls sharply</td>
</tr>
</tbody>
</table>
<div class="content-grid">
<div class="card blue">
<h4>Cold Effects</h4>
<p>Slows enzyme kinetics, Ca²⁺ cycling, cross-bridge turnover, and nerve conduction. Twitch curve becomes wide and flat. Muscle feels stiff.</p>
</div>
<div class="card red">
<h4>Warm Effects</h4>
<p>Speeds ATPase activity, SERCA pump (Ca²⁺ re-uptake), and cross-bridge cycling. Twitch curve is narrow and tall. Better power output.</p>
</div>
<div class="card green">
<h4>Mechanism</h4>
<p>Temperature changes: enzyme kinetics, membrane fluidity & ion channel gating, Ca²⁺ sensitivity of troponin, and myosin ATPase rate.</p>
</div>
<div class="card orange">
<h4>Clinical Relevance</h4>
<p>Warm-up before exercise improves performance. Cold packs reduce strength & speed. Fever (<40°C) mildly enhances; hyperthermia (>42°C) damages proteins.</p>
</div>
</div>
<div class="key-facts">
<h4>Key Facts to Remember</h4>
<ul>
<li>Cold Ringer's solution: broader, flatter twitch curve with reduced peak height.</li>
<li>Warm Ringer's solution: narrow, taller twitch curve with faster phases.</li>
<li>Isometric force increases substantially on warming from <10°C up to physiological temperatures (>30°C).</li>
<li>Very high temperatures denature contractile proteins - irreversible damage above ~45°C.</li>
</ul>
</div>
<div class="page-num">Page 3 of 3</div>
</div>
<!-- SUMMARY PAGE -->
<div class="summary-page">
<div class="page-header">
<div>
<div class="topic-num">Summary</div>
<h2>Quick Reference Summary</h2>
<div class="sub">All Three Topics at a Glance</div>
</div>
</div>
<div class="summary-grid">
<div class="summary-card t1">
<div class="sc-header">01 - Simple Muscle Curve</div>
<div class="sc-body">
<ul>
<li>3 phases: Latent → Contraction → Relaxation</li>
<li>Latent: 2-5 ms (E-C coupling)</li>
<li>Contraction: ~40 ms (peak tension)</li>
<li>Relaxation: ~50 ms (Ca²⁺ re-uptake)</li>
<li>All-or-none per fiber</li>
<li>Fast fibers = short sharp twitch</li>
<li>Slow fibers = long low twitch</li>
</ul>
</div>
</div>
<div class="summary-card t2">
<div class="sc-header">02 - Stimulus Strength</div>
<div class="sc-body">
<ul>
<li>Whole muscle = graded response</li>
<li>Size principle: small units first</li>
<li>Subthreshold = no response</li>
<li>Maximal = all units recruited</li>
<li>Supramaximal = no extra force</li>
<li>Frequency ↑ → summation → tetanus</li>
<li>Max tetanic force: 3-4 kg/cm²</li>
</ul>
</div>
</div>
<div class="summary-card t3">
<div class="sc-header">03 - Temperature Effects</div>
<div class="sc-body">
<ul>
<li>Cold = slow, weak, prolonged twitch</li>
<li>37°C = optimal force and speed</li>
<li>Warm = faster, stronger, shorter twitch</li>
<li>>42°C = protein damage, force drops</li>
<li>Affects Ca²⁺ cycling + ATPase speed</li>
<li>Warm-up improves performance</li>
<li>Cold reduces strength and speed</li>
</ul>
</div>
</div>
</div>
<div style="margin-top: 30px; background: #1a1a2e; border-radius: 10px; padding: 18px 22px; color: #90caf9; font-size: 11px;">
<strong style="color: white; display:block; margin-bottom: 6px;">Reference</strong>
Guyton, A.C. & Hall, J.E. (2021). <em>Textbook of Medical Physiology</em>, Chapter 6: Contraction of Skeletal Muscle.
Sections covered: Whole Muscle Contraction, Mechanics of Skeletal Muscle, Characteristics of Isometric Twitches.
</div>
</div>
</body>
</html>
cd /home/daytona/workspace/muscle-twitch-pdf && python3 -c " from weasyprint import HTML, CSS HTML(filename='muscle_twitch.html').write_pdf('Muscle_Twitch_Quick_Reference.pdf') print('PDF created successfully') " 2>&1
which wkhtmltopdf 2>/dev/null; which chromium 2>/dev/null; which chromium-browser 2>/dev/null; which google-chrome 2>/dev/null; python3 -c "import pdfkit; print('pdfkit ok')" 2>/dev/null; python3 -c "import reportlab; print('reportlab ok')" 2>/dev/null
cd /home/daytona/workspace/muscle-twitch-pdf && chromium --headless --no-sandbox --disable-gpu --print-to-pdf=Muscle_Twitch_Quick_Reference.pdf --print-to-pdf-no-header muscle_twitch.html 2>&1 && echo "Done" && ls -lh Muscle_Twitch_Quick_Reference.pdf
Muscle Twitch Quick Reference
PDF Document · PDF
- Cover page - titled "Skeletal Muscle Twitch & Contraction"
- Page 1 - Simple Muscle Curve with diagram, phases table (latent/contraction/relaxation), and key concept cards
- Page 2 - Effect of Stimulus Strength with diagram, recruitment table, summation/tetanus cards
- Page 3 - Effect of Temperature with diagram, cold/normal/warm comparison table, and clinical relevance cards
- Summary page - All 3 topics condensed side-by-side for quick revision