From Guyton and Hall textbook of medical physiology, 4th South Asia edition, NEUROMUSCULAR JUNCTION (NMJ) - DIAGRAM

Reading File
Finding Sources
Searching Images

neuromuscular junction NMJ diagram Guyton Hall physiology
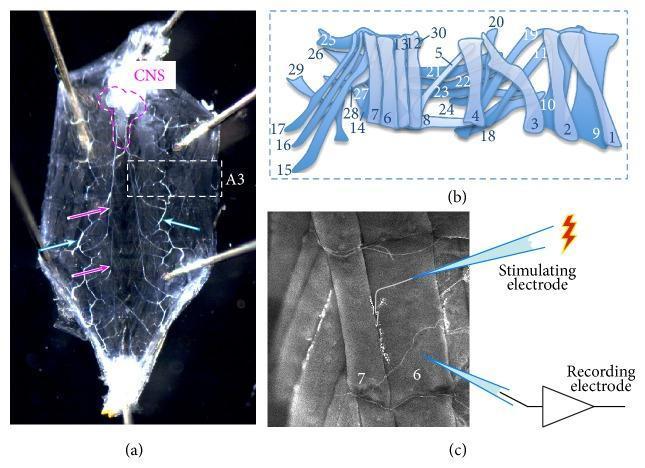
This composite educational image illustrates the Drosophila larval neuromuscular junction (NMJ), a widely used biomedical model for studying human neurodegenerative diseases like Parkinson's. (a) A dark-field micrograph showing a dissected third-instar larva. The central nervous system (CNS) is outlined in magenta, with magenta arrows indicating main nerve trunks. Cyan arrows highlight the branching tracheal respiratory system, and segment A3 is boxed. (b) An anatomical diagram of a larval hemisegment, labeling 30 distinct muscles (1-30) that form the archetypal body wall structure. (c) A grayscale fluorescence or DIC micrograph detailing the experimental setup for electrophysiology at muscle 6 and 7. The image demonstrates the placement of a suction stimulating electrode on the motor nerve and a recording electrode on the postsynaptic muscle fiber. This model is utilized in translational research to study synaptic vesicle dynamics, mitochondrial function, and glutamate release relevant to central nervous system synapse pathology.
This composite educational image illustrates the Drosophila larval neuromuscular junction (NMJ), a widely used biomedical model for studying human neurodegenerative diseases like Parkinson's. (a) A dark-field micrograph showing a dissected third-instar larva. The central nervous system (CNS) is outlined in magenta, with magenta arrows indicating main nerve trunks. Cyan arrows highlight the branching tracheal respiratory system, and segment A3 is boxed. (b) An anatomical diagram of a larval hemisegment, labeling 30 distinct muscles (1-30) that form the archetypal body wall structure. (c) A grayscale fluorescence or DIC micrograph detailing the experimental setup for electrophysiology at muscle 6 and 7. The image demonstrates the placement of a suction stimulating electrode on the motor nerve and a recording electrode on the postsynaptic muscle fiber. This model is utilized in translational research to study synaptic vesicle dynamics, mitochondrial function, and glutamate release relevant to central nervous system synapse pathology.

Educational figure illustrating molecular mechanisms of neuromuscular junction (NMJ) gene expression. 

Panel A provides an anatomical diagram of a mouse diaphragm, demarcating the synaptic (Syn) region containing NMJ clusters and the extrasynaptic (Exsyn) region. 

Panel B shows a volcano plot of RNA sequencing data comparing wild-type (WT) Syn vs. Exsyn regions. Genes like Chrna1, Chrne, AChE, MuSK, and Cabp7 are highlighted, with Cabp7 identified as highly upregulated in the synaptic region.

Panel C is a bar graph quantifying mRNA expression levels for these genes in both WT and Dok-7 transgenic (Tg) mice. Results show that forced expression of Dok-7 significantly enhances mRNA levels of Chrna1, Chrne, MuSK, AChE, and Cabp7 specifically in the synaptic region compared to WT controls.

Panel D displays whole-mount in situ hybridization images of E18.5 diaphragm muscles. It visually confirms that Cabp7 transcripts are localized to the central midmuscle synaptic region in both WT and Dok-7 Tg mice, with markedly more intense staining in the transgenic group.
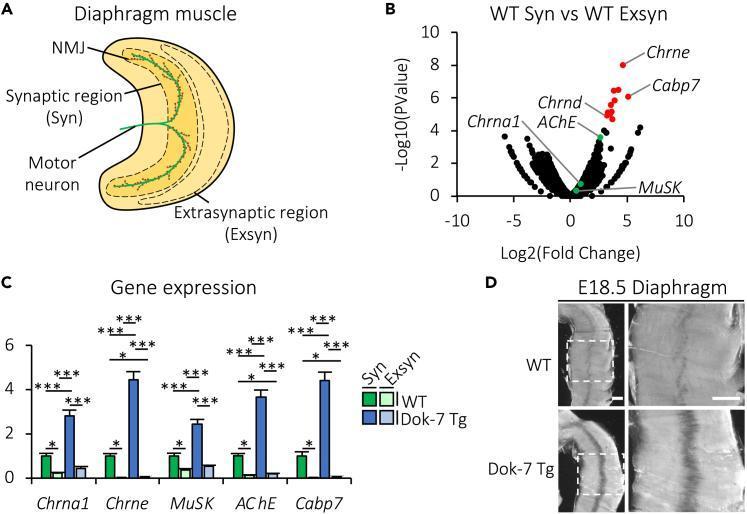
Educational figure illustrating molecular mechanisms of neuromuscular junction (NMJ) gene expression. Panel A provides an anatomical diagram of a mouse diaphragm, demarcating the synaptic (Syn) region containing NMJ clusters and the extrasynaptic (Exsyn) region. Panel B shows a volcano plot of RNA sequencing data comparing wild-type (WT) Syn vs. Exsyn regions. Genes like Chrna1, Chrne, AChE, MuSK, and Cabp7 are highlighted, with Cabp7 identified as highly upregulated in the synaptic region. Panel C is a bar graph quantifying mRNA expression levels for these genes in both WT and Dok-7 transgenic (Tg) mice. Results show that forced expression of Dok-7 significantly enhances mRNA levels of Chrna1, Chrne, MuSK, AChE, and Cabp7 specifically in the synaptic region compared to WT controls. Panel D displays whole-mount in situ hybridization images of E18.5 diaphragm muscles. It visually confirms that Cabp7 transcripts are localized to the central midmuscle synaptic region in both WT and Dok-7 Tg mice, with markedly more intense staining in the transgenic group.

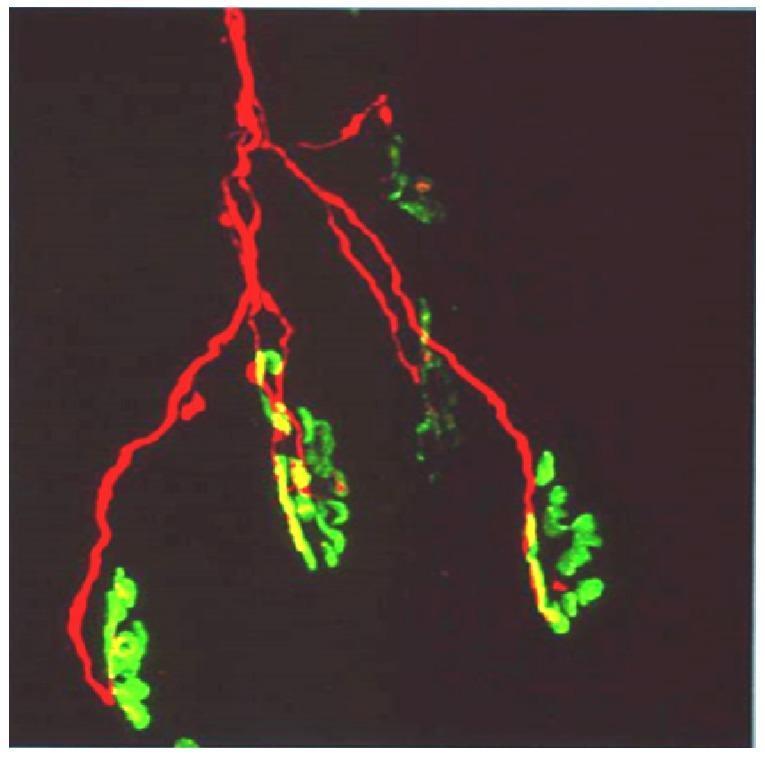
This diagnostic fluorescence microscopy image illustrates the neuromuscular junction (NMJ) architecture. The image features a single motor axon labeled with red fluorescence (TRITC-conjugated anti-neurofilament antibody), showing a characteristic distal branching pattern. These red axonal branches terminate at multiple motor end-plates, which are visualized in green (FITC-conjugated α-bungarotoxin) to reveal the high density of postsynaptic acetylcholine receptors (AChRs). The spatial relationship demonstrates a single axon innervating a cluster of six individual end-plates. Areas of colocalization between the presynaptic nerve terminal and the postsynaptic membrane appear yellow, indicating functional synaptic contact. This visual serves as an educational model for neuroanatomy and toxicology, particularly in the study of neurotoxic snake venoms (like those from the elapid family) that target presynaptic proteins or postsynaptic receptors, leading to neuromuscular paralysis and axonal degeneration.
This diagnostic fluorescence microscopy image illustrates the neuromuscular junction (NMJ) architecture. The image features a single motor axon labeled with red fluorescence (TRITC-conjugated anti-neurofilament antibody), showing a characteristic distal branching pattern. These red axonal branches terminate at multiple motor end-plates, which are visualized in green (FITC-conjugated α-bungarotoxin) to reveal the high density of postsynaptic acetylcholine receptors (AChRs). The spatial relationship demonstrates a single axon innervating a cluster of six individual end-plates. Areas of colocalization between the presynaptic nerve terminal and the postsynaptic membrane appear yellow, indicating functional synaptic contact. This visual serves as an educational model for neuroanatomy and toxicology, particularly in the study of neurotoxic snake venoms (like those from the elapid family) that target presynaptic proteins or postsynaptic receptors, leading to neuromuscular paralysis and axonal degeneration.

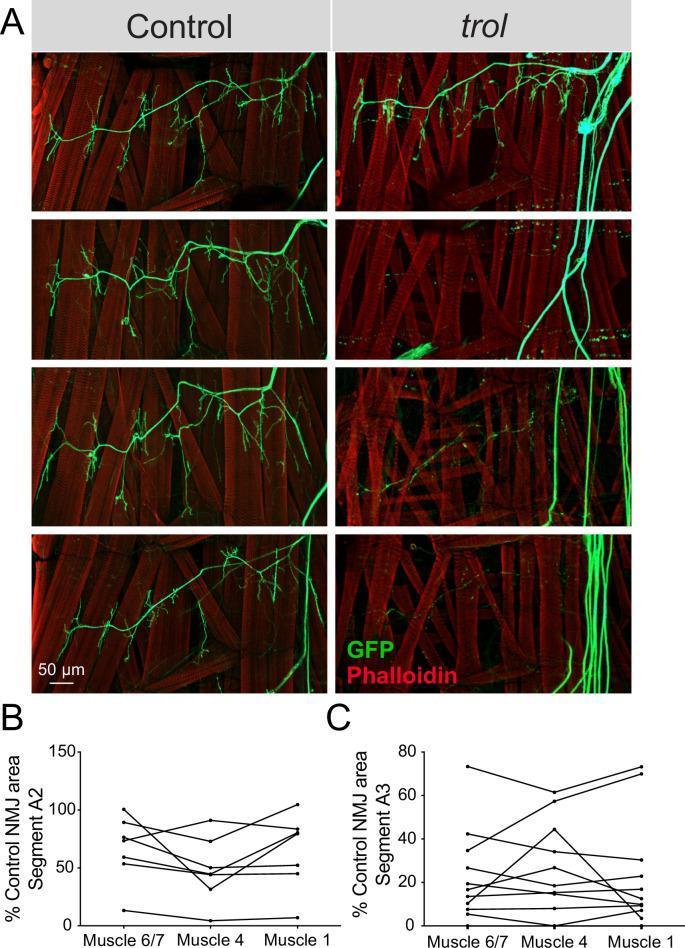
This composite educational graphic details neuromuscular junction (NMJ) morphology and quantitative area analysis in Drosophila larvae, serving as a model for synaptic maintenance. Section A presents fluorescence microscopy images of larval hemisegments. Control samples show organized green fluorescent protein (10X-GFP) labeling of motoneuron branches and robust synaptic boutons overlying red Phalloidin-stained muscle actin fibers. In contrast, 'trol' (Perlecan null) mutants demonstrate progressive synaptic retraction, characterized by fragmented or completely absent green neuronal signals despite intact muscle fibers. Sections B and C provide quantitative dot-and-line plots of NMJ areas for muscles 6/7, 4, and 1 across abdominal segments A2 and A3. Data is expressed as a percentage of the mean control NMJ area, illustrating a significant reduction in synaptic area in trol mutants. The graphs show that NMJ loss is coordinated within a hemisegment, with segment A3 exhibiting a more severe reduction (typically below 40% of control) compared to segment A2. This illustrates the importance of the extracellular matrix protein Perlecan in stabilizing the neural lamella and preventing axonal degeneration.
This composite educational graphic details neuromuscular junction (NMJ) morphology and quantitative area analysis in Drosophila larvae, serving as a model for synaptic maintenance. Section A presents fluorescence microscopy images of larval hemisegments. Control samples show organized green fluorescent protein (10X-GFP) labeling of motoneuron branches and robust synaptic boutons overlying red Phalloidin-stained muscle actin fibers. In contrast, 'trol' (Perlecan null) mutants demonstrate progressive synaptic retraction, characterized by fragmented or completely absent green neuronal signals despite intact muscle fibers. Sections B and C provide quantitative dot-and-line plots of NMJ areas for muscles 6/7, 4, and 1 across abdominal segments A2 and A3. Data is expressed as a percentage of the mean control NMJ area, illustrating a significant reduction in synaptic area in trol mutants. The graphs show that NMJ loss is coordinated within a hemisegment, with segment A3 exhibiting a more severe reduction (typically below 40% of control) compared to segment A2. This illustrates the importance of the extracellular matrix protein Perlecan in stabilizing the neural lamella and preventing axonal degeneration.

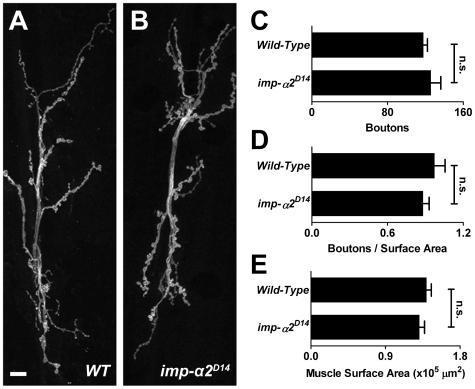
Educational panel illustrating the morphological and quantitative analysis of the neuromuscular junction (NMJ). (A-B) Representative confocal microscopy images of NMJs from a wild-type (WT) and an importin-α2 (imp-α2D14) mutant larva. The images utilize anti-HRP staining to visualize the branching presynaptic nerve terminals and characteristic synaptic boutons, which appear as small, spherical protrusions along the axonal branches. Scale bar indicates 10 µm. (C-E) Series of horizontal bar graphs providing quantitative comparison between wild-type and mutant samples. Graph C measures total bouton number; Graph D shows bouton number normalized to muscle surface area; Graph E displays the total muscle surface area (x10^5 µm²). All three graphs demonstrate statistically equivalent values between the two groups, labeled with 'n.s.' (non-significant), indicating that importin-α2 is not required for basic morphological synapse development or muscle growth in this model. The data points represent the mean with error bars indicating S.E.M.
Educational panel illustrating the morphological and quantitative analysis of the neuromuscular junction (NMJ). (A-B) Representative confocal microscopy images of NMJs from a wild-type (WT) and an importin-α2 (imp-α2D14) mutant larva. The images utilize anti-HRP staining to visualize the branching presynaptic nerve terminals and characteristic synaptic boutons, which appear as small, spherical protrusions along the axonal branches. Scale bar indicates 10 µm. (C-E) Series of horizontal bar graphs providing quantitative comparison between wild-type and mutant samples. Graph C measures total bouton number; Graph D shows bouton number normalized to muscle surface area; Graph E displays the total muscle surface area (x10^5 µm²). All three graphs demonstrate statistically equivalent values between the two groups, labeled with 'n.s.' (non-significant), indicating that importin-α2 is not required for basic morphological synapse development or muscle growth in this model. The data points represent the mean with error bars indicating S.E.M.

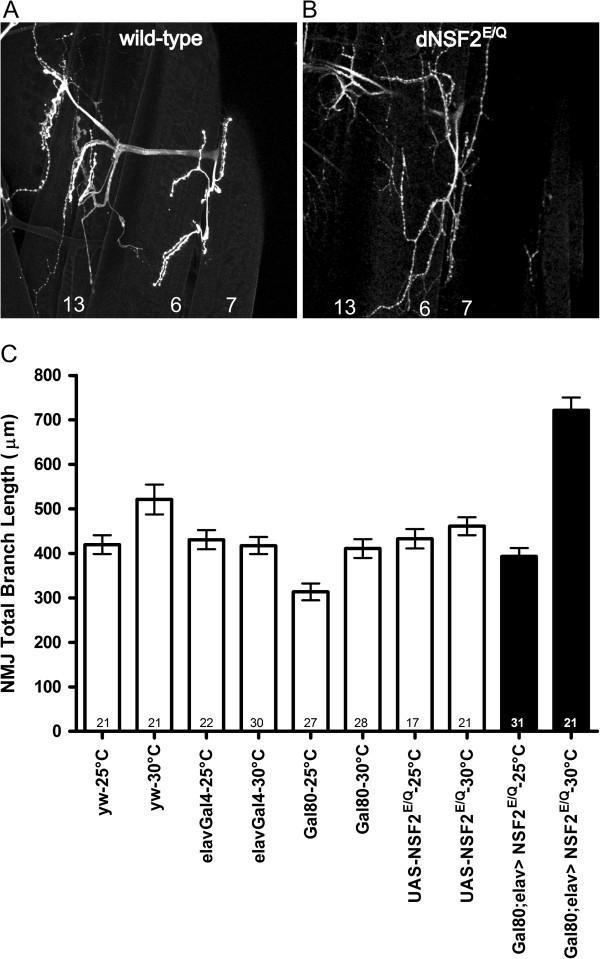
This figure presents a study of the Drosophila larval neuromuscular junction (NMJ) as a model for neurobiological development and synaptic morphology. Panels A and B are immunofluorescent images of NMJs at muscles 6, 7, and 13. Panel A shows a wild-type phenotype with typical branching architecture. Panel B shows the elavGal4 > UAS-dNSF2E/Q genotype, illustrating a significant overgrowth phenotype characterized by increased branch density and total length. Panel C is a bar graph quantifying 'NMJ Total Branch Length (μm)' across multiple genotypes (including yw, elavGal4, Gal80, and UAS-NSF2E/Q) at two different temperatures: 25°C and 30°C. The data demonstrates that while Gal80 effectively suppresses the dNSF2E/Q mutant phenotype at 25°C (maintaining branch lengths near the 400 μm control baseline), the inactivation of Gal80 at 30°C results in a massive increase in NMJ length, reaching approximately 725 μm. This visual set is used to evaluate the temporal and genetic regulation of synaptic overgrowth and physiological development in a laboratory model.

This figure presents a study of the Drosophila larval neuromuscular junction (NMJ) as a model for neurobiological development and synaptic morphology. Panels A and B are immunofluorescent images of NMJs at muscles 6, 7, and 13. Panel A shows a wild-type phenotype with typical branching architecture. Panel B shows the elavGal4 > UAS-dNSF2E/Q genotype, illustrating a significant overgrowth phenotype characterized by increased branch density and total length. Panel C is a bar graph quantifying 'NMJ Total Branch Length (μm)' across multiple genotypes (including yw, elavGal4, Gal80, and UAS-NSF2E/Q) at two different temperatures: 25°C and 30°C. The data demonstrates that while Gal80 effectively suppresses the dNSF2E/Q mutant phenotype at 25°C (maintaining branch lengths near the 400 μm control baseline), the inactivation of Gal80 at 30°C results in a massive increase in NMJ length, reaching approximately 725 μm. This visual set is used to evaluate the temporal and genetic regulation of synaptic overgrowth and physiological development in a laboratory model.

Finding Sources
Reading File
Finding Sources
Loading Image
Loading Image
Both diagrams are retrieved directly from the Guyton and Hall textbook. Here they are:

Neuromuscular Junction (NMJ) - Guyton & Hall, Fig. 7.1
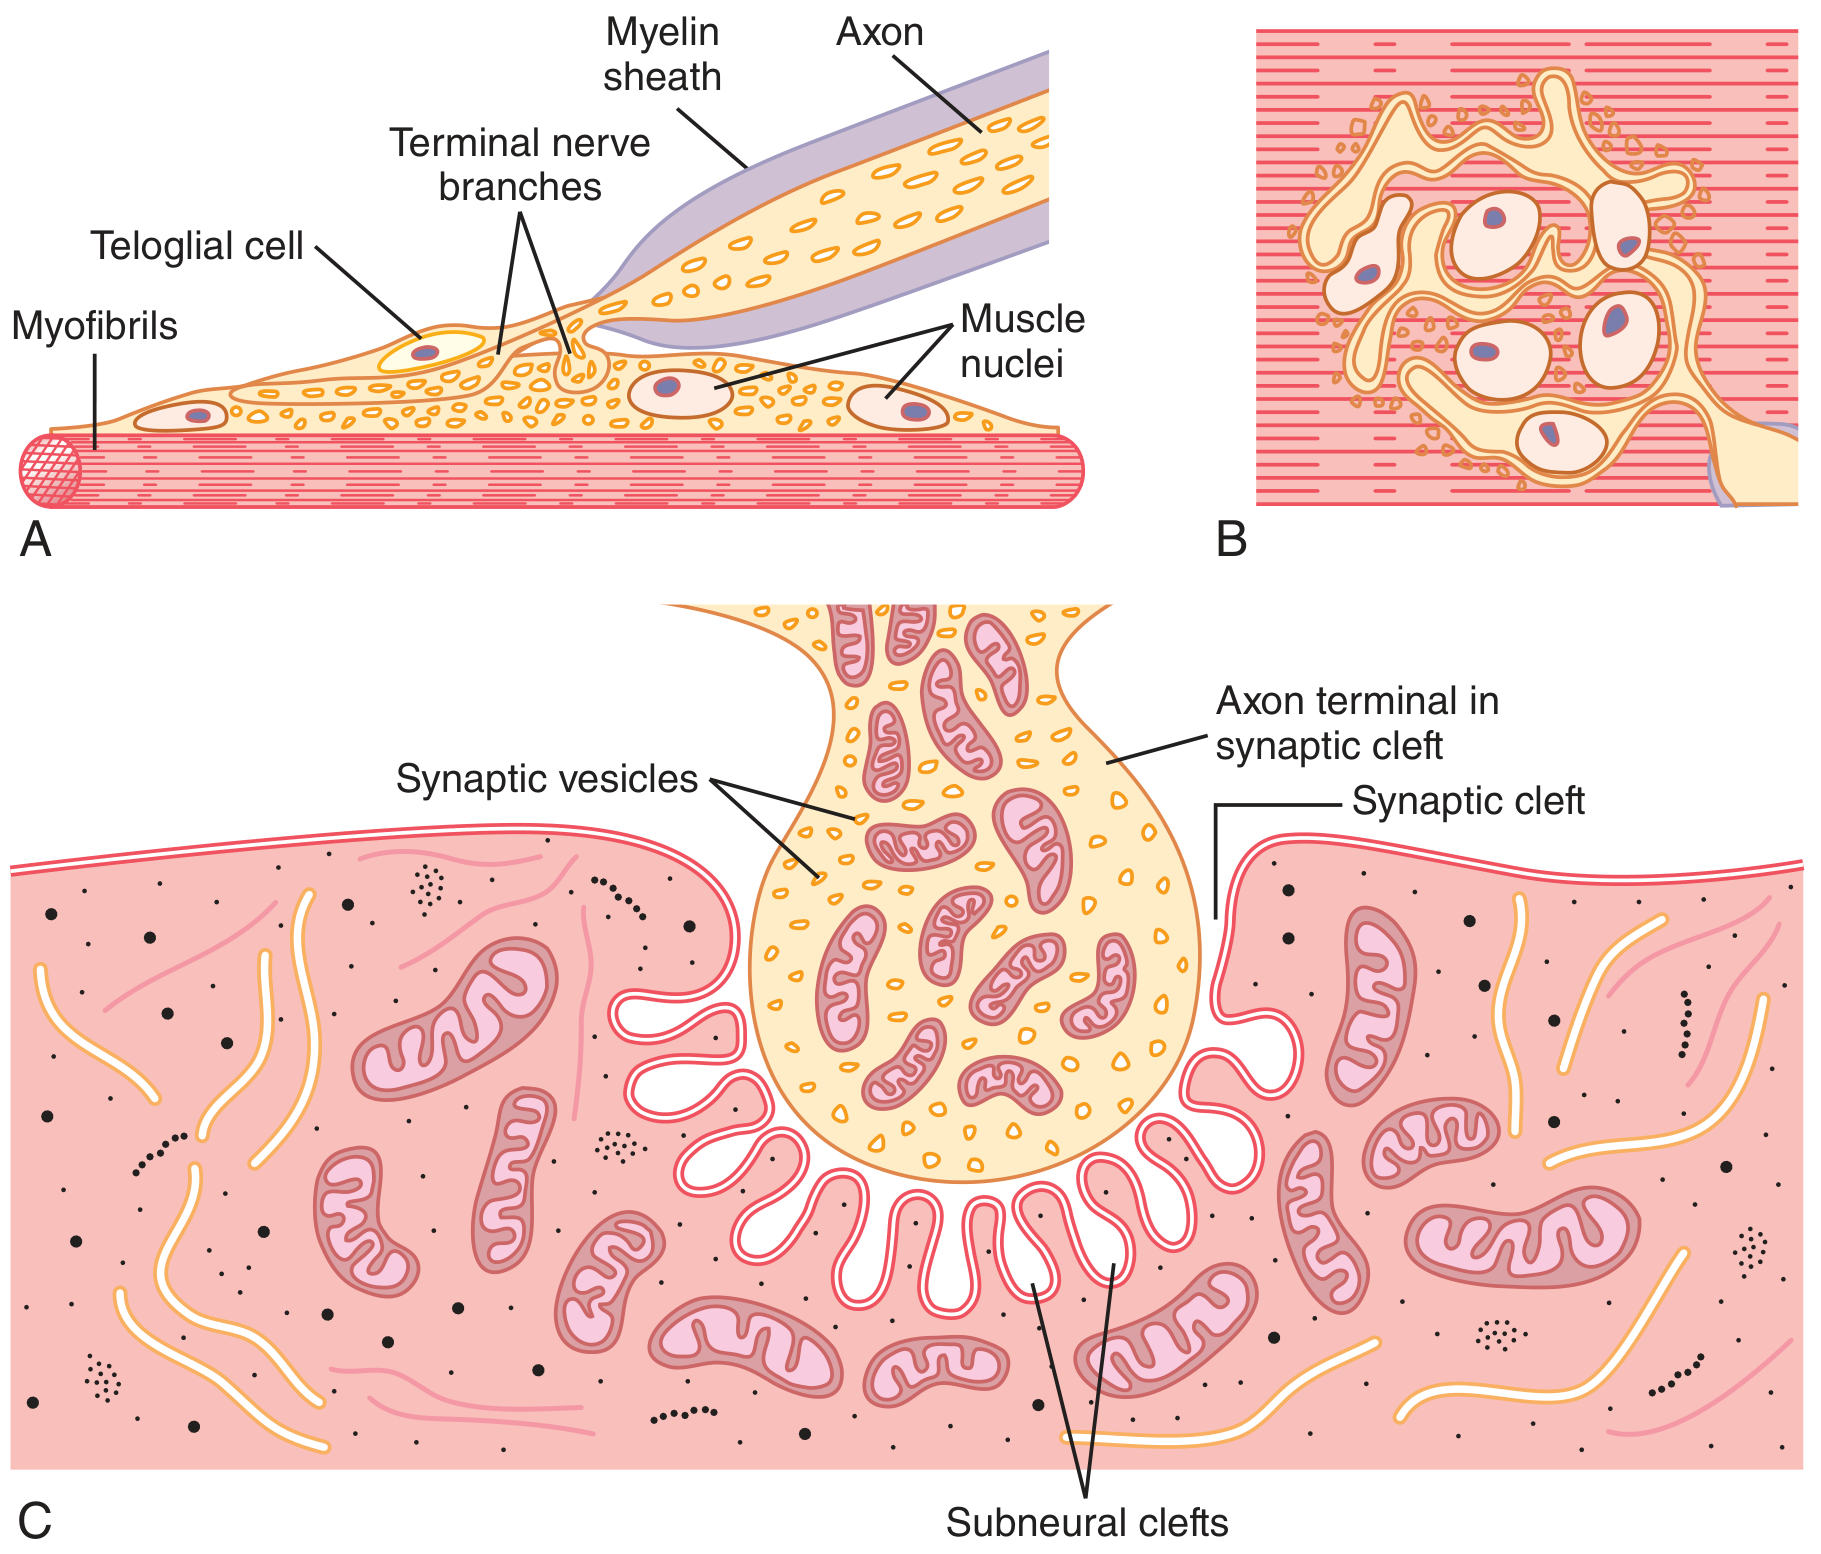
Figure 7.1 - Different views of the motor end plate
Figure 7.1 - Motor end plate: (A) Longitudinal section, (B) Surface view, (C) Electron micrographic appearance of axon terminal - muscle fiber membrane contact
Figure 7.1 — Different views of the motor end plate. (A) Longitudinal section through the end plate showing the myelin sheath, axon, terminal nerve branches, teloglial cell, myofibrils, and muscle nuclei. (B) Surface view of the end plate. (C) Electron micrographic appearance of the contact point between a single axon terminal and the muscle fiber membrane, showing synaptic vesicles, the axon terminal in the synaptic cleft, synaptic cleft, and subneural clefts.

NMJ - Fig. 7.2 (Acetylcholine Release at the Synaptic Cleft)
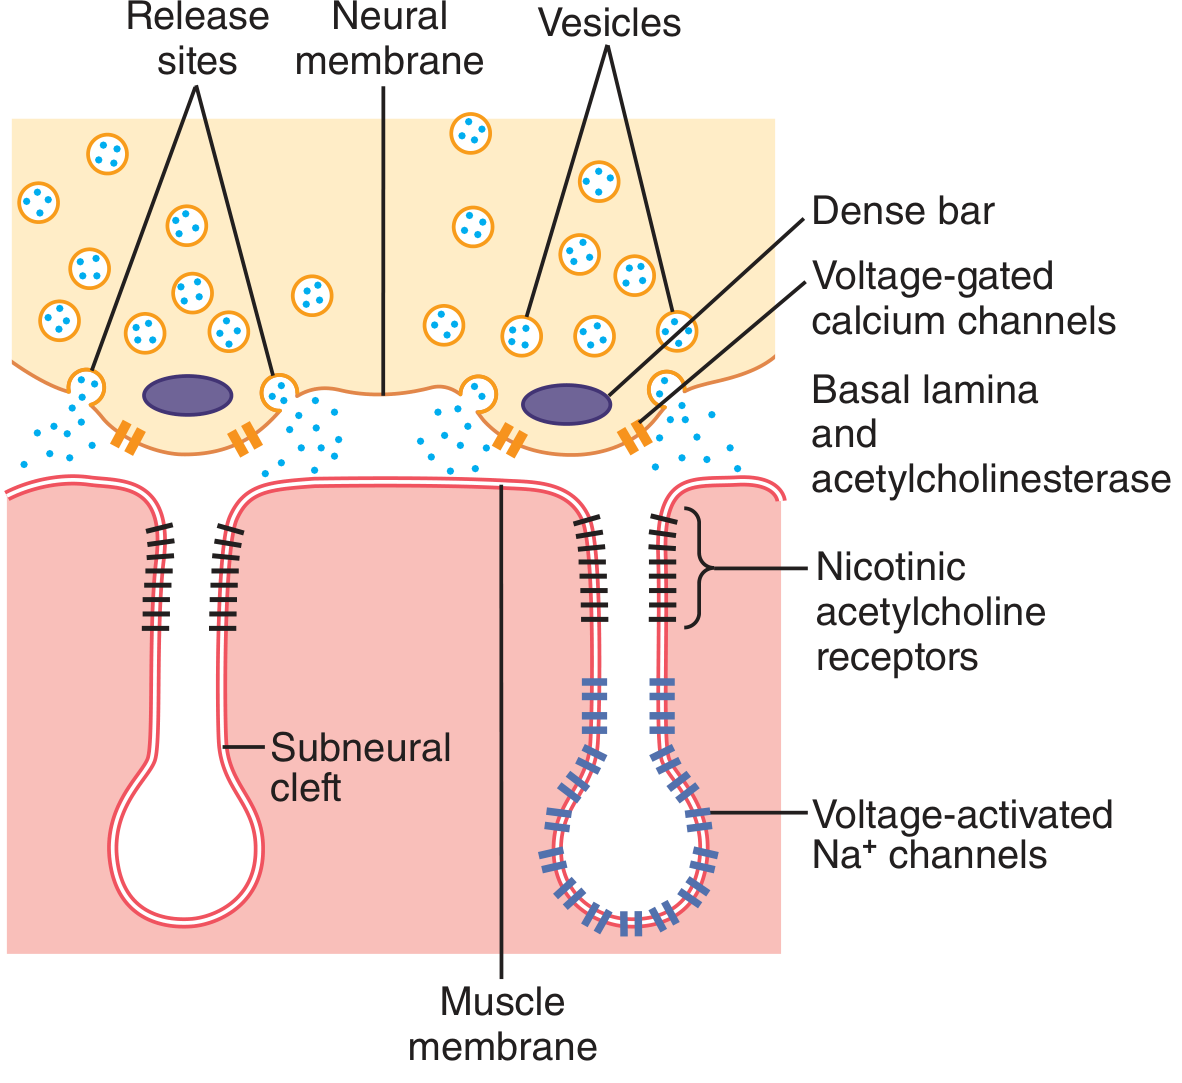
Figure 7.2 - Release of acetylcholine from synaptic vesicles
Figure 7.2 - Release of acetylcholine at neuromuscular junction showing neural membrane, vesicles, release sites, dense bars, voltage-gated calcium channels, basal lamina with acetylcholinesterase, nicotinic ACh receptors, subneural clefts, voltage-activated Na+ channels, and muscle membrane
Figure 7.2 — Release of acetylcholine from synaptic vesicles at the neural membrane of the neuromuscular junction. Note the proximity of the release sites in the neural membrane to the acetylcholine receptors in the muscle membrane at the mouths of the subneural clefts.

Key structures labelled across both diagrams:

Presynaptic (neural) side:
  • Myelin sheath and axon
  • Terminal nerve branches (teloglial/Schwann cells covering them)
  • Dense bars on the inner neural membrane surface
  • Voltage-gated Ca²⁺ channels flanking each dense bar
  • Synaptic vesicles (~300,000 per end plate; each contains ACh)
  • Release sites
Synaptic cleft (20-30 nm wide):
  • Basal lamina with acetylcholinesterase (destroys ACh within milliseconds)
Postsynaptic (muscle) side:
  • Subneural clefts (junctional folds - increase surface area for ACh action)
  • Nicotinic acetylcholine receptors (at the mouths of subneural clefts)
  • Voltage-activated Na⁺ channels (lining the subneural clefts)
  • Muscle nuclei and myofibrils
Source: Guyton and Hall Textbook of Medical Physiology, Chapter 7 - Excitation of Skeletal Muscle: Neuromuscular Transmission and Excitation-Contraction Coupling.
This is a shared conversation. Sign in to Orris to start your own chat.