
MOA of sulfadoxine
sulfadoxine mechanism of action folate synthesis DHPS inhibition diagram
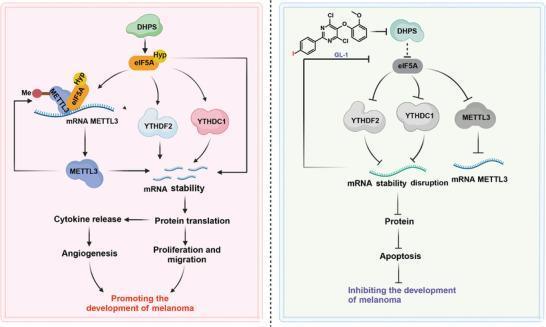
This pathophysiology diagram illustrates the regulatory role of Deoxyhypusine synthase (DHPS) in melanoma progression and the therapeutic mechanism of its inhibitor, GL-1. The illustration is divided into two comparative pathways. The 'Promoting the development of melanoma' pathway (left) shows DHPS catalyzing the hypusination (Hyp) of eIF5A. This activated eIF5A-Hyp complex facilitates the self-m6A-methylation of METTL3 and promotes the translation of YTHDF2 and YTHDC1. These m6A-related factors maintain mRNA stability, leading to protein translation, cytokine release, angiogenesis, and cell proliferation/migration. The 'Inhibiting the development of melanoma' pathway (right) demonstrates the action of the small molecule inhibitor GL-1, which targets DHPS. This inhibition prevents eIF5A hypusination, subsequently disrupting the expression of METTL3, YTHDF2, and YTHDC1 (represented by greyed-out icons and inhibitory bars). This cascade leads to mRNA stability disruption, reduced protein synthesis, and the induction of apoptosis. The diagram highlights the potential of DHPS as a target for anti-melanoma therapy by modulating intracellular m6A-methylation and translational homeostasis.
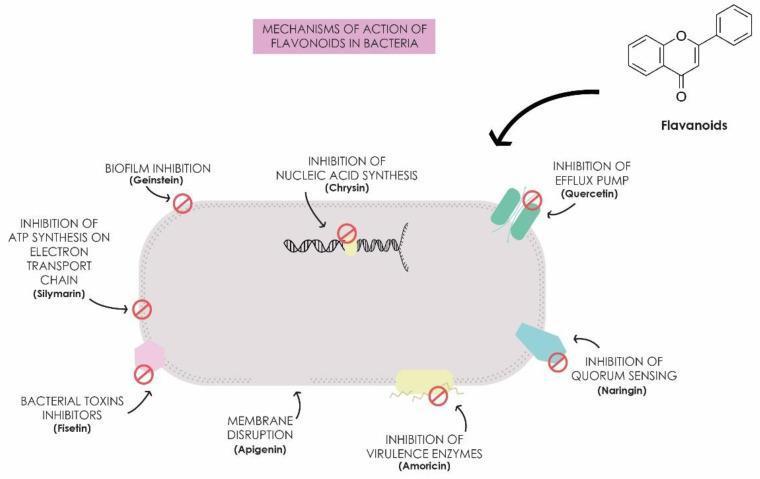
This pathophysiology diagram illustrates the various antibacterial mechanisms of action associated with different flavonoid compounds. The visual features a stylized rod-shaped bacterium with several intracellular and extracellular targets. Key mechanisms depicted include: inhibition of nucleic acid synthesis (attributed to Chrysin), inhibition of ATP synthesis on the electron transport chain (Silymarin), and membrane disruption (Apigenin). Extracellular and cell-surface mechanisms shown include biofilm inhibition (Genistein), inhibition of efflux pumps (Quercetin), inhibition of quorum sensing (Naringin), inhibition of virulence enzymes (Amoricin), and inhibition of bacterial toxins (Fisetin). Each mechanism is marked with a red 'prohibited' sign to signify inhibition or disruption. The diagram also displays the general chemical structure of a flavonoid. This infographic serves as an educational summary of how plant-derived polyphenols interfere with bacterial metabolism, replication, and pathogenicity, highlighting their potential in addressing antimicrobial resistance.
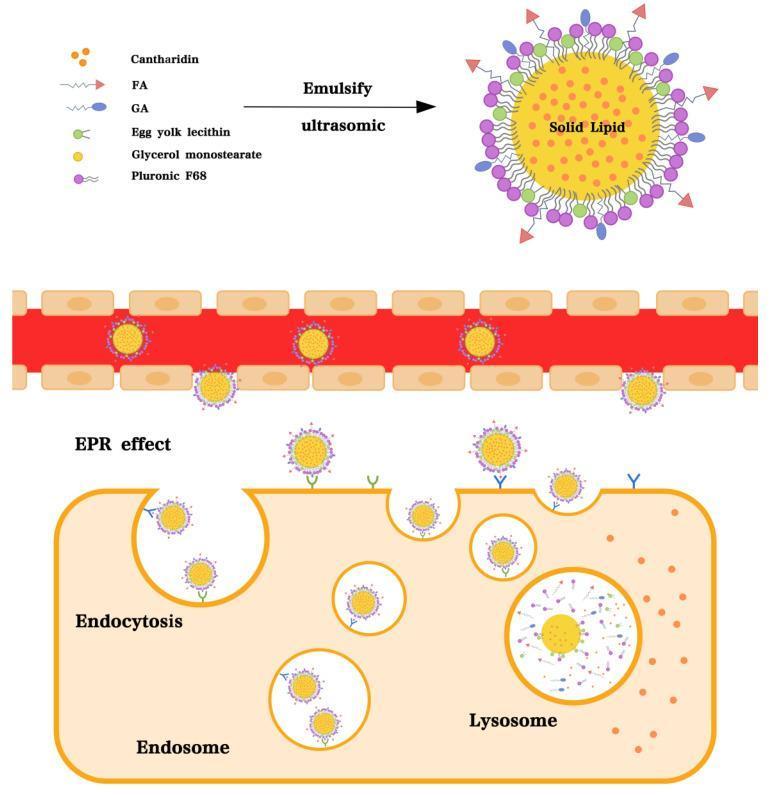
This medical pathophysiology diagram illustrates the formulation and therapeutic mechanism of Glycyrrhetinic acid (GA) and Folate (FA) modified Cantharidin-loaded Solid Lipid Nanoparticles (GA-FA-CSLNs). The upper section depicts the nanoparticle synthesis via emulsion ultrasonic dispersion, showing a core-shell structure where a solid lipid core is surrounded by Cantharidin, FA, GA, Egg yolk lecithin, Glycerol monostearate, and Pluronic F68. The middle section demonstrates the Enhanced Permeability and Retention (EPR) effect, where nanoparticles extravasate through porous vascular endothelium into the tumor microenvironment. The lower section details the cellular interaction and uptake pathway: targeted ligands on the nanoparticle surface bind to specific cell-surface receptors (Folate and GA receptors), triggering receptor-mediated endocytosis. The process follows the progression from cell membrane invagination to the formation of an intracellular endosome, which subsequently fuses with a lysosome for drug release. This diagram represents advanced drug delivery concepts in oncology and pharmacology.
Mechanism of Action of Sulfadoxine
Drug Class
Core Mechanism: Competitive Inhibition of DHPS
"As structural analogs of PABA, sulfonamides inhibit dihydropteroate synthase and folate production."
- Katzung's Basic & Clinical Pharmacology, 16th Ed.
Why Is This Selectively Toxic?
| Humans | Bacteria / Plasmodium | |
|---|---|---|
| Folate source | Dietary (exogenous) | Must synthesize it from PABA |
| DHPS enzyme | Absent (not needed) | Present and essential |
| Sulfonamide effect | None | Lethal - folate pathway blocked |
Downstream Consequences
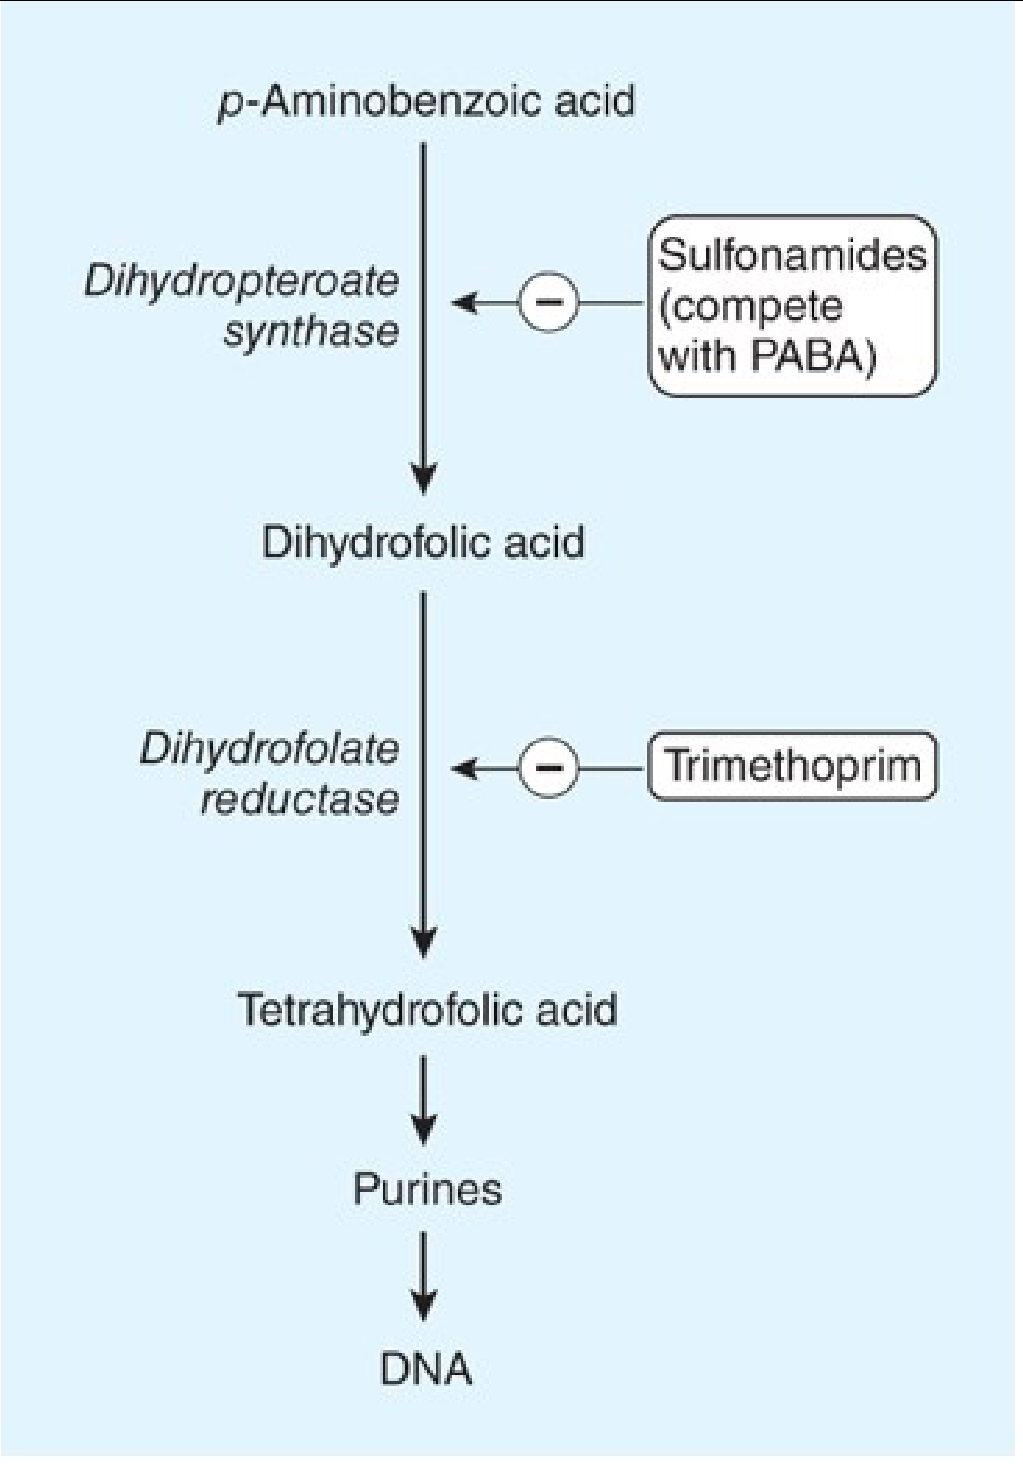
Synergy with Pyrimethamine (Sequential Blockade)
- Sulfadoxine blocks Step 1: PABA → Dihydrofolate (via DHPS inhibition)
- Pyrimethamine blocks Step 2: Dihydrofolate → Tetrahydrofolate (via DHFR inhibition)
"Combination of a sulfonamide with an inhibitor of dihydrofolate reductase (trimethoprim or pyrimethamine) provides synergistic activity because of sequential inhibition of folate synthesis."
- Katzung's Basic & Clinical Pharmacology, 16th Ed.
Spectrum of Activity (relevant to sulfadoxine)
- Plasmodium falciparum (primary use in malaria)
- General sulfonamide spectrum includes gram-positive cocci, gram-negative enteric bacteria, Nocardia, Chlamydia trachomatis, some protozoa
- Not active against rickettsiae (sulfonamides can paradoxically stimulate their growth), anaerobes, or Pseudomonas aeruginosa
Resistance Mechanisms
- Overproduction of PABA (outcompetes the drug)
- Mutant DHPS with low sulfonamide affinity (often plasmid-encoded)
- Impaired drug permeability
Summary
| Feature | Detail |
|---|---|
| Target enzyme | Dihydropteroate synthase (DHPS) |
| Mechanism | Competitive inhibition (PABA analogue) |
| Pathway blocked | Folate biosynthesis |
| Net result | Impaired purine/nucleic acid synthesis → growth arrest |
| Effect | Bacteriostatic / antiparasitic |
| Partner drug | Pyrimethamine (DHFR inhibitor) - sequential blockade |
| Basis of selectivity | Humans use dietary folate; organisms must synthesize it |
Tell me a approach to patient with malaria like which drugs to use for what plasmodium species and indications simplify using flow charts and diagrams
malaria treatment flowchart drug species falciparum vivax
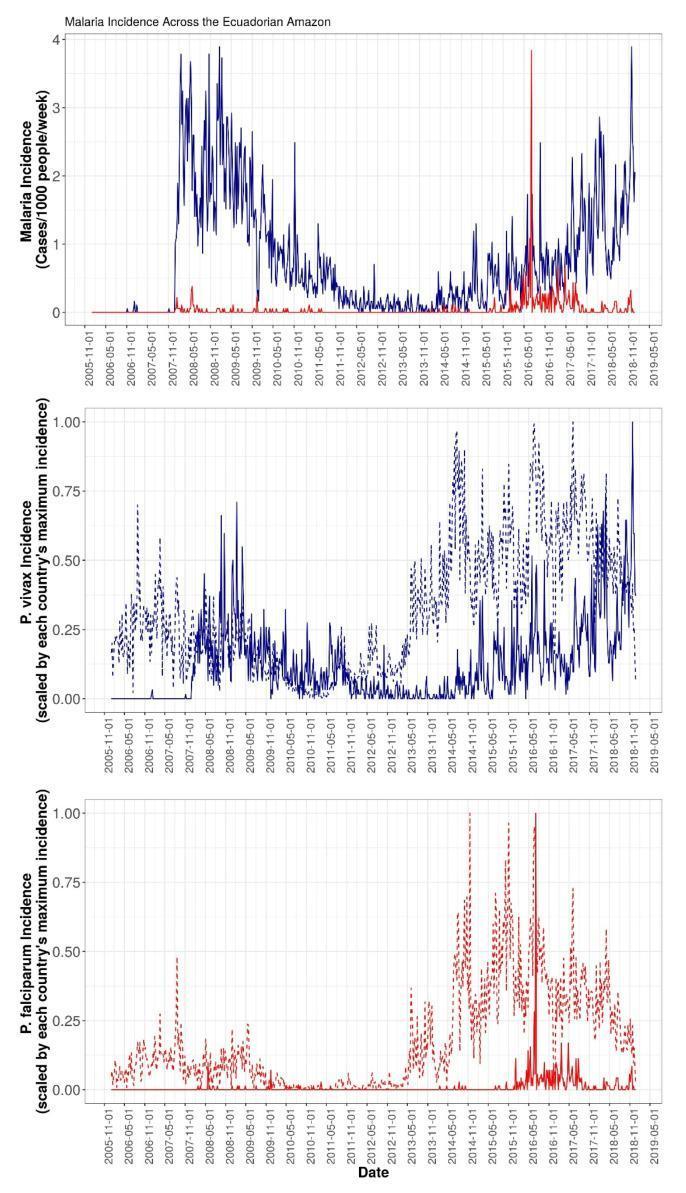
This composite epidemiological visualization displays the temporal incidence of malaria across the Ecuadorian Amazon from 2006 to 2018. The top graph shows the weekly incidence of Plasmodium vivax (blue line) and Plasmodium falciparum (red line). P. vivax is consistently the dominant species, exhibiting a significant peak between 2008 and 2009 followed by a re-emergence starting in 2014. P. falciparum remains at low endemic levels except for a distinct spike around January 2016. The middle and bottom graphs provide a comparative cross-border analysis, illustrating normalized incidence rates (scaled by maximum country incidence) for P. vivax and P. falciparum, respectively. These graphs compare data from Ecuadorian cantons (solid lines) against bordering Loreto districts in Peru (dotted lines). The P. vivax data suggests a temporal lead in transmission from Peru to Ecuador, characterized by the dotted peaks preceding the solid line peaks. This visual evidence supports research into the impact of cross-border connectivity and river network transport on the transmission dynamics of human malaria in South America.
![<table><thead><tr><th>Indication</th><th>First Choice</th><th>Alternative</th><th>Comments/Special Issues</th></tr></thead><tbody><tr><td></td><td>Uncomplicated P. Falciparum OR Unknown Malaria Species from Chloroquine-Sensitive Region (See Comments for Link to Resistance Map)<ul><li>Chloroquine phosphate: 16.6 mg/kg body weight (10 mg/kg body weight chloroquine base) (maximum 1,000 mg) by mouth once, then 8.3 mg/kg body weight (maximum 500 mg) by mouth at 6, 24, and 48 hours (total dose = 41.6 mg/kg body weight chloroquine phosphate [maximum 2,500 mg] = 25 mg/kg body weight chloroquine base)</li></ul>P. vivax, P. ovale, P. malariae, P. knowlesi (All Areas Except Papua New Guinea, Indonesia; See Comments)<br><br>Initial Therapy (Followed by Anti-Relapse Therapy for P. ovale and P. vivax):<ul><li>Chloroquine phosphate 16.6 mg/kg body weight (10 mg/kg body weight chloroquine base) (maximum 1,000 mg) by mouth once, then 8.3 mg/kg body weight (maximum 500 mg) by mouth at 6, 24, and 48 hours (total dose = 41.6 mg/kg body weight chloroquine phosphate [maximum 2,500 mg] = 25 mg/kg body weight chloroquine base)</li></ul></td><td></td><td>High treatment failure rates due to chloroquine-resistant P. vivax have been documented in Papua New Guinea and Indonesia. Treatment should be selected from one of the three following options:<ul><li>Atovaquone-proguanil plus primaquine phosphate</li><li>Quinine sulfate plus either doxycycline or tetracycline plus primaquine phosphate. This regimen cannot be used in children aged <8 years.</li><li>Mefloquine plus primaquine phosphate</li></ul></td></tr></tbody></table>](https://cdn.orris.care/cdss_images/GLGCA_2016207_1766500158819_563e210b-266d-4929-8e79-23b0fcfb6844_3d3814b4-b548-49a7-b550-40710cf5345e.png)
<table><thead><tr><th>Indication</th><th>First Choice</th><th>Alternative</th><th>Comments/Special Issues</th></tr></thead><tbody><tr><td></td><td>Uncomplicated P. Falciparum OR Unknown Malaria Species from Chloroquine-Sensitive Region (See Comments for Link to Resistance Map)<ul><li>Chloroquine phosphate: 16.6 mg/kg body weight (10 mg/kg body weight chloroquine base) (maximum 1,000 mg) by mouth once, then 8.3 mg/kg body weight (maximum 500 mg) by mouth at 6, 24, and 48 hours (total dose = 41.6 mg/kg body weight chloroquine phosphate [maximum 2,500 mg] = 25 mg/kg body weight chloroquine base)</li></ul>P. vivax, P. ovale, P. malariae, P. knowlesi (All Areas Except Papua New Guinea, Indonesia; See Comments)<br><br>Initial Therapy (Followed by Anti-Relapse Therapy for P. ovale and P. vivax):<ul><li>Chloroquine phosphate 16.6 mg/kg body weight (10 mg/kg body weight chloroquine base) (maximum 1,000 mg) by mouth once, then 8.3 mg/kg body weight (maximum 500 mg) by mouth at 6, 24, and 48 hours (total dose = 41.6 mg/kg body weight chloroquine phosphate [maximum 2,500 mg] = 25 mg/kg body weight chloroquine base)</li></ul></td><td></td><td>High treatment failure rates due to chloroquine-resistant P. vivax have been documented in Papua New Guinea and Indonesia. Treatment should be selected from one of the three following options:<ul><li>Atovaquone-proguanil plus primaquine phosphate</li><li>Quinine sulfate plus either doxycycline or tetracycline plus primaquine phosphate. This regimen cannot be used in children aged <8 years.</li><li>Mefloquine plus primaquine phosphate</li></ul></td></tr></tbody></table>
A bioinformatics flowchart illustrating an automated pipeline for malaria literature mining, specifically focusing on Plasmodium species (P. falciparum, P. yoelii, P. berghei, and P. chabaudi). The diagram details two distinct methodological pathways: Approach A (Full-text Search) begins at PlasmoDB (A1), where locus names are extracted for full-body searches in scientific publications via Google Scholar and SCIRUS, followed by mapping URLs to PubMed entries (A2). Approach B (NCBI Database Mining) utilizes the NCBI database network (B1) to retrieve associations between proteins, nucleotides, and genes from PubMed Central and PubMed. This path concludes with Step B2, where GenBank gi sequences are mapped back to malaria locus sequences using BLAST alignment. The diagram emphasizes the integration of genomic data with peer-reviewed literature to identify functional associations in parasitology and infectious disease research.
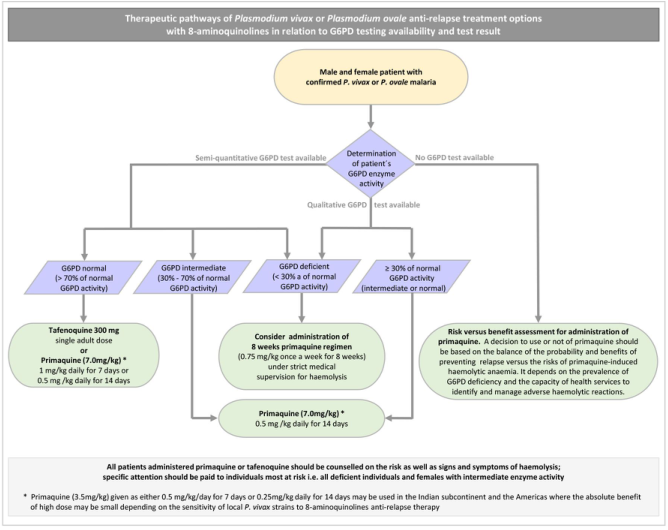
Summary : This flowchart outlines the therapeutic pathways for treating Plasmodium vivax or Plasmodium ovale malaria with 8-aminoquinolines (primaquine and tafenoquine), based on the availability and results of G6PD (glucose-6-phosphate dehydrogenase) enzyme activity testing. It details decision points for drug selection and dosing, considering patient risk for haemolysis. flowchart: # Nodes : • Start (rectangle): "Male and female patient with confirmed P. vivax or P. ovale malaria" • Decision (diamond): "Determination of patient's G6PD enzyme activity" • Branch: "Semi-quantitative G6PD test available" and "No G6PD test available" • Decision (diamond, left branch): "G6PD normal (> 70% of normal G6PD activity)" • Decision (diamond, left branch): "G6PD intermediate (30% - 70% of normal G6PD activity)" • Decision (diamond, left branch): "G6PD deficient (< 30% of normal G6PD activity)" • Decision (diamond, middle branch): "Qualitative G6PD test available" • Decision (diamond, middle branch): "≥ 30% of normal G6PD activity (intermediate or normal)" • Action (rectangle, left): "Tafenoquine 300 mg single adult dose or Primaquine (7.0mg/kg)* 1 mg/kg daily for 7 days or 0.5 mg/kg daily for 14 days" • Action (rectangle, left): "Primaquine (7.0mg/kg)* 0.5 mg/kg daily for 14 days" • Action (rectangle, middle): "Consider administration of 8 weeks primaquine regimen (0.75 mg/kg once a week for 8 weeks) under strict medical supervision for haemolysis" • Action (rectangle, right): "Risk versus benefit assessment for administration of primaquine" • Note (rectangle, bottom): "All patients administered primaquine or tafenoquine should be counselled on the risk as well as signs and symptoms of haemolysis; specific attention should be paid to individuals most at risk i.e. all deficient individuals and females with intermediate enzyme activity" • Footnote (rectangle, bottom): "* Primaquine (3.5mg/kg) given as either 0.5 mg/kg/day for 7 days or 0.25mg/kg/day for 14 days may be used in the Indian subcontinent and the Americas where the absolute benefit of high dose may be small depending on the sensitivity of local P. vivax strains to 8-aminoquinolines anti-relapse therapy" # Connectors : • The flow starts from the top node and splits into two main branches: "Semi-quantitative G6PD test available" and "No G6PD test available". • The "Semi-quantitative" branch further splits into three based on G6PD activity: normal, intermediate, and deficient. • The "Qualitative G6PD test available" branch leads to a decision node for ≥ 30% of normal activity. • Each activity level leads to specific drug recommendations or risk assessment. • Arrows are unidirectional, guiding the user through decision points to treatment options. • The bottom note applies to all branches. # Layout : • The chart is organized horizontally, with the initial patient node at the top center. • Decision nodes branch left and right, with treatment options below each. • The bottom contains a wide note spanning all branches. • Colour coding: purple for decision nodes, green for treatment/action nodes, grey for notes. # Analysis : • The flowchart provides a clear, stepwise approach to anti-relapse therapy for P. vivax or P. ovale malaria, emphasizing the importance of G6PD testing to minimize the risk of drug-induced haemolysis. • Patients with normal or intermediate G6PD activity are eligible for tafenoquine or primaquine, with dosing adjusted for intermediate activity. • G6PD-deficient patients require strict medical supervision if primaquine is considered. • Where G6PD testing is unavailable, the decision to use primaquine is based on a risk-benefit assessment, highlighting the need for careful clinical judgment. • The chart stresses patient counseling and monitoring for haemolysis, especially in high-risk groups.
Approach to a Patient with Malaria
STEP 1 - DIAGNOSE AND CLASSIFY
Suspected Malaria (fever + travel history / endemic area)
              ↓
    Thick & thin blood films + RDT
              ↓
    ┌─────────────────────────────┐
    │  Blood film NEGATIVE?       │
    │  Repeat every 12-24h x3    │
    │  If still negative → look  │
    │  for alternate diagnosis    │
    └─────────────────────────────┘
              ↓ POSITIVE
    Identify species + calculate parasitemia
              ↓
    ┌─────────────────────┬──────────────────────┐
    │  UNCOMPLICATED      │  SEVERE / Cannot take │
    │  MALARIA            │  oral medications     │
    └─────────────────────┴──────────────────────┘
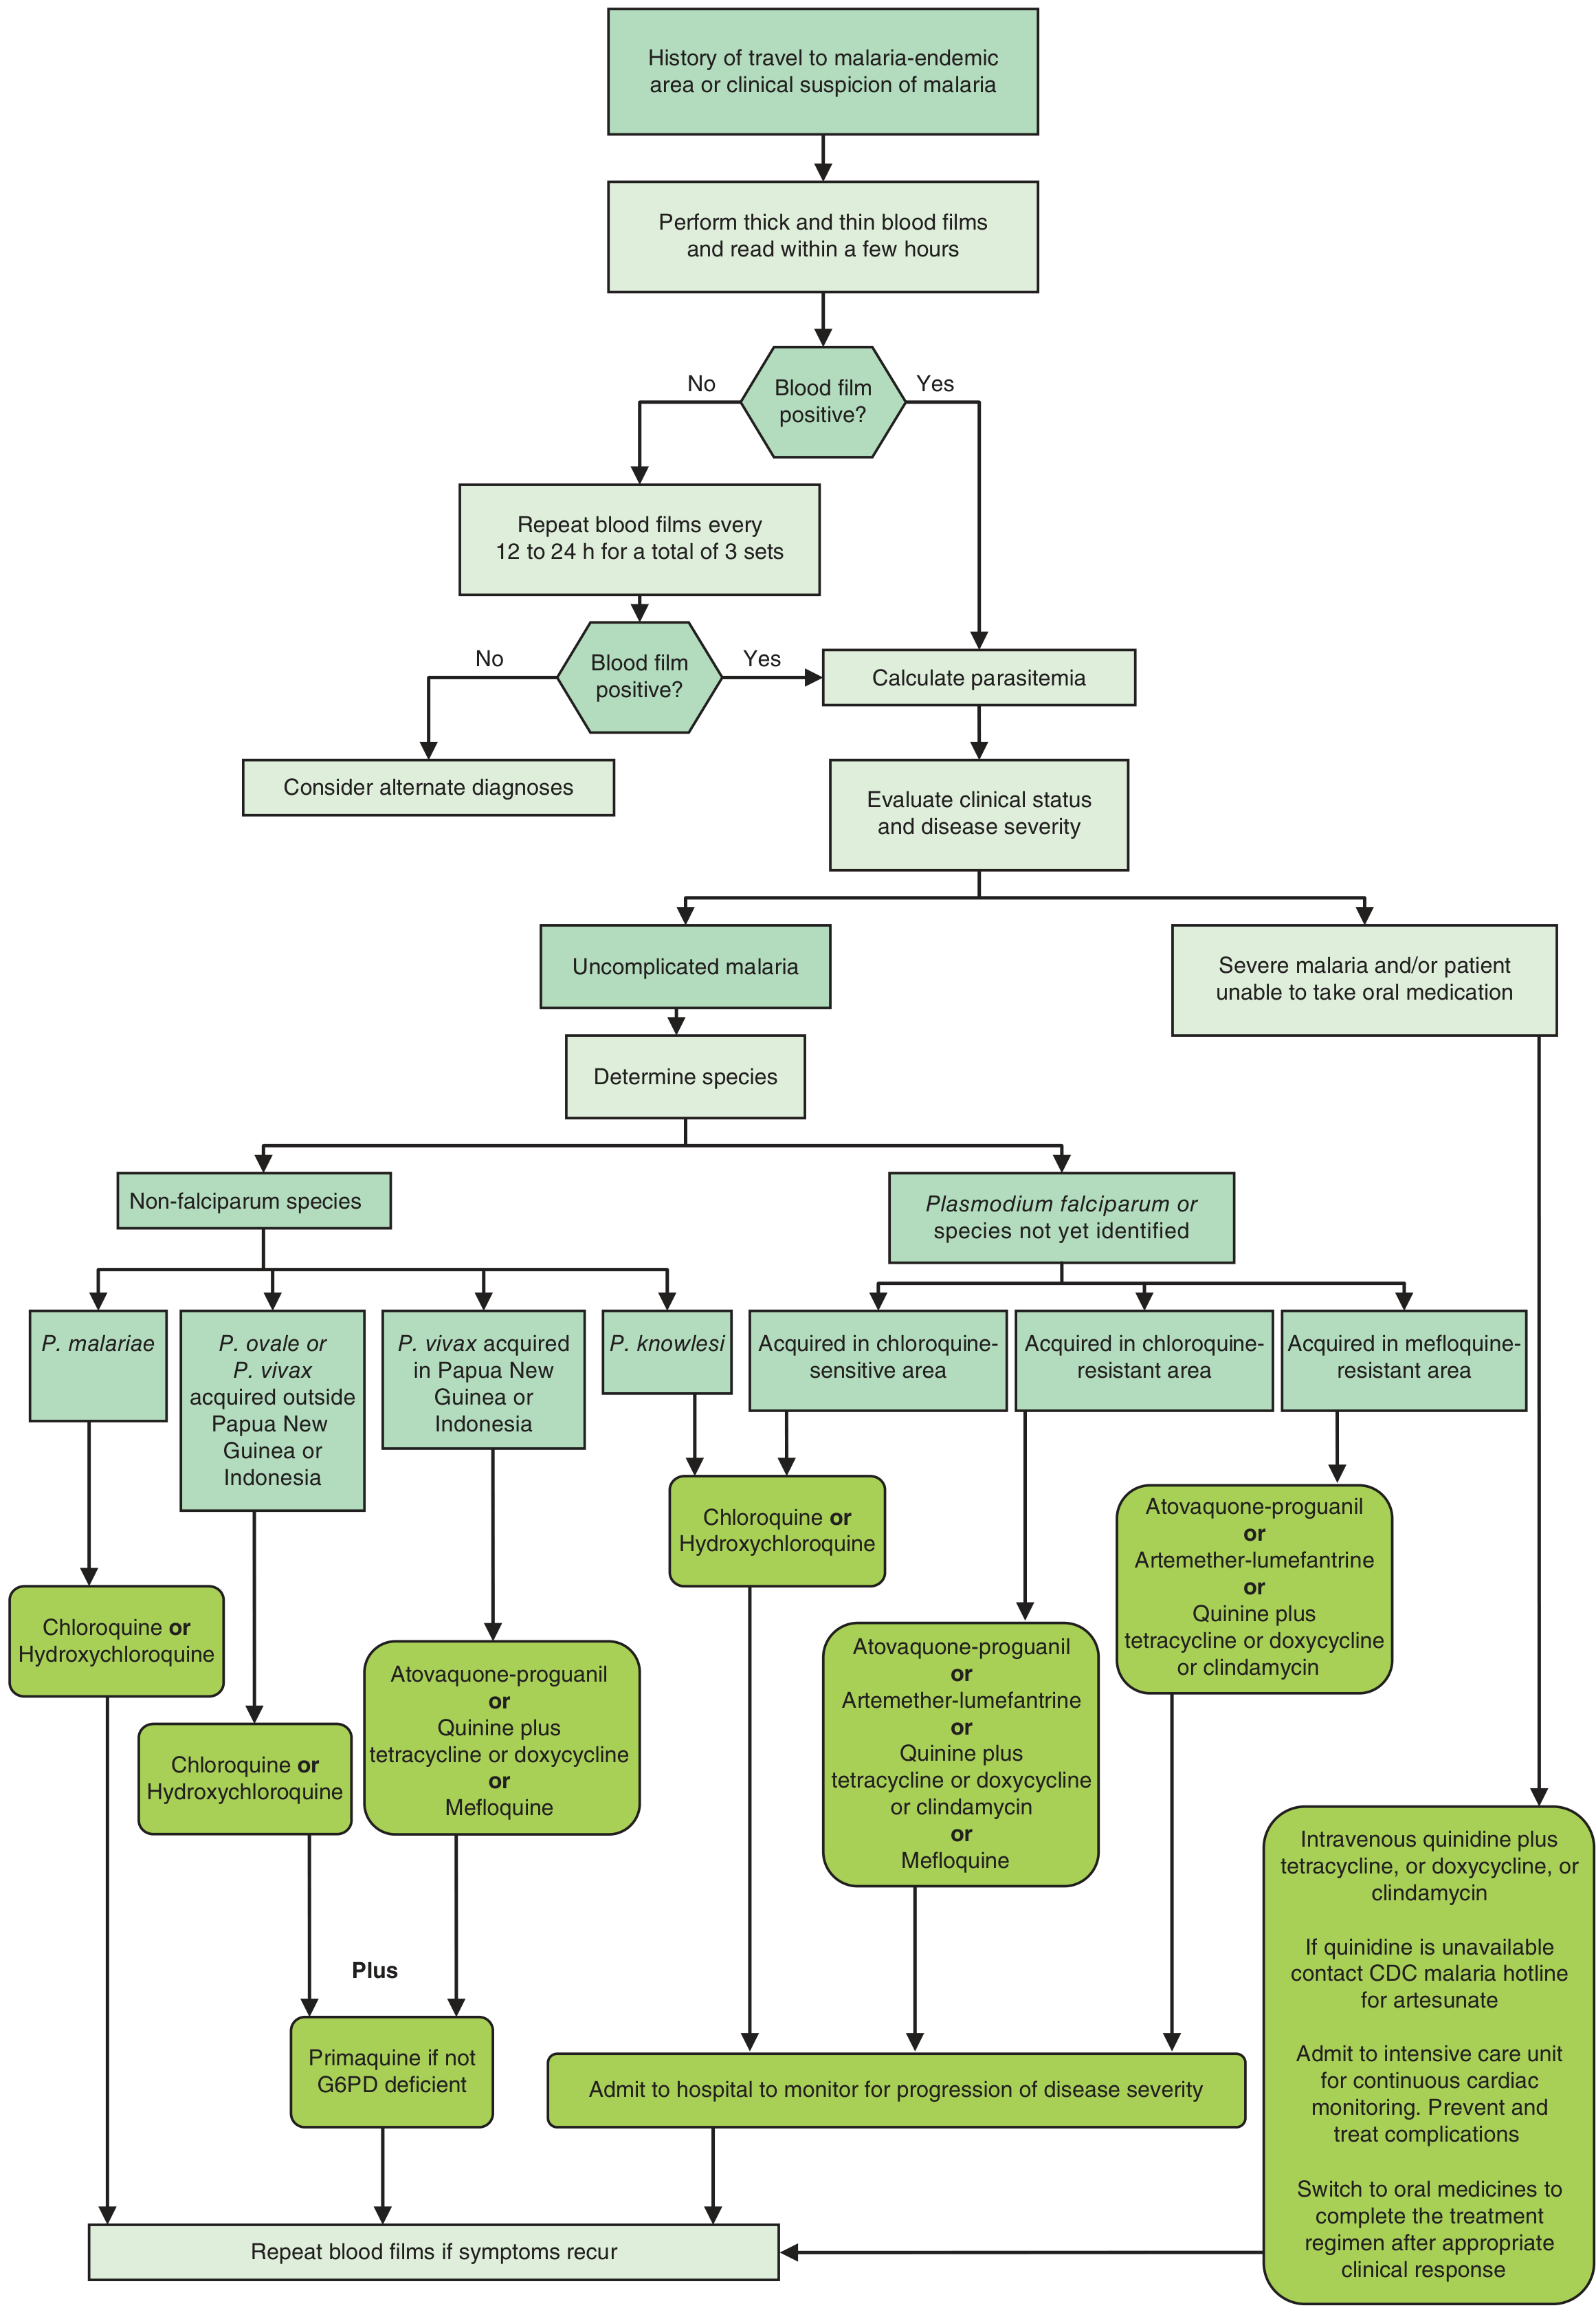
STEP 2 - MASTER FLOWCHART (CDC-Based Decision Algorithm)
STEP 3 - TREATMENT BY SPECIES
3A. P. falciparum (the dangerous one)
P. FALCIPARUM confirmed
        ↓
Is it SEVERE? (parasitemia >5%, cerebral malaria,
renal failure, severe anaemia, pulmonary oedema)
        │
    YES ↓                          NO ↓
  IV / Parenteral                ORAL treatment
  ─────────────                  ─────────────────────────────────
  1st line:                      Can patient be in chloroquine-
  IV Artesunate                  sensitive area?
  2.4 mg/kg at 0,12,24h              │
  then once daily                 YES ↓            NO ↓
                                Chloroquine     ACT (see below)
  2nd line:
  IV Quinine + Doxycycline       (Central America, Caribbean only)
  or
  IM Artemether
  3.2 mg/kg then 1.6 mg/kg/day
        ↓
  When patient can take oral →
  Switch to oral ACT or
  Quinine + Doxycycline to
  complete the course
| Regimen | Dose | Duration |
|---|---|---|
| Artemether-Lumefantrine (Coartem) - 1st line | 4 tabs twice daily | 3 days |
| Artesunate-Amodiaquine | Weight-based | 3 days |
| Artesunate-Mefloquine | Weight-based | 3 days |
| Dihydroartemisinin-Piperaquine | Weight-based | 3 days |
| Atovaquone-Proguanil (Malarone) | 4 tabs daily | 3 days |
| Quinine + Doxycycline (alternative) | 650 mg 3x/day + 100 mg 2x/day | 3-7 days |
India-specific: ACT-SP (Artesunate 3 days + Sulfadoxine-Pyrimethamine day 1) + single dose Primaquine (0.75 mg/kg) on Day 2. In NE states: use Artemether-Lumefantrine (due to SP resistance).
- Park's Textbook of Preventive & Social Medicine
Key rule: Artemisinin monotherapy is BANNED - always give with partner drug to prevent resistance.
3B. P. vivax / P. ovale
P. vivax or P. ovale confirmed
              ↓
   ┌──────────────────────────────────────────┐
   │  BLOOD STAGE (acute attack)              │
   │  Chloroquine 25 mg/kg over 3 days:       │
   │  Day 1: 10 mg/kg                         │
   │  Day 2: 10 mg/kg                         │
   │  Day 3: 5 mg/kg                          │
   │                                          │
   │  EXCEPTION: Papua New Guinea/Indonesia   │
   │  → Chloroquine resistant P. vivax        │
   │  → Use Atovaquone-Proguanil, Mefloquine  │
   │    or Quinine + Doxycycline instead      │
   └──────────────────────────────────────────┘
              ↓
   ┌──────────────────────────────────────────┐
   │  LIVER STAGE (hypnozoites - prevents     │
   │  RELAPSE) - add 8-aminoquinoline:        │
   │                                          │
   │  CHECK G6PD STATUS FIRST!               │
   └──────────────────────────────────────────┘
| G6PD Status | Drug | Dose |
|---|---|---|
| Normal (>70%) | Tafenoquine (single dose) | 300 mg once |
| Normal (>70%) | Primaquine | 0.5 mg/kg/day x 14 days (or 1 mg/kg/day x 7 days) |
| Intermediate (30-70%) | Primaquine (lower dose) | 0.5 mg/kg/day x 14 days |
| Deficient (<30%) | Weekly primaquine under supervision | 0.75 mg/kg once weekly x 8 weeks |
| Pregnant / Infant | Chloroquine weekly till delivery, then primaquine | Primaquine contraindicated during pregnancy |
India: Primaquine 0.25 mg/kg/day x 14 days (lower dose than WHO, due to local strain sensitivity)
- Park's Textbook of Preventive & Social Medicine
3C. P. malariae
P. malariae confirmed
        ↓
Chloroquine 25 mg/kg over 3 days
(NO primaquine needed - no hypnozoites,
no relapse risk)
3D. P. knowlesi
P. knowlesi confirmed
        ↓
Can progress rapidly → treat like P. falciparum
        ↓
Chloroquine (sensitive areas)
OR ACT if severity warrants
        ↓
Monitor closely for severe disease
STEP 4 - SEVERE MALARIA (Any Species)
Criteria for SEVERE malaria:
• Parasitemia >5%
• Cerebral malaria (coma/seizures)
• Severe anaemia (Hb <7)
• Respiratory distress / pulmonary oedema
• Renal failure
• Hypoglycaemia
• Haemoglobinuria
• Circulatory collapse
        ↓
    ADMIT TO ICU
        ↓
IV Artesunate (1st line, superior to quinine)
  2.4 mg/kg IV at 0h, 12h, 24h → then once daily
        ↓
If artesunate unavailable:
  IV Quinine (20 mg/kg loading → 10 mg/kg q8h)
  + Doxycycline or Clindamycin
  [Cardiac monitoring mandatory with quinine]
        ↓
Exchange transfusion if parasitemia very high
        ↓
When tolerating orals → switch to oral ACT
to complete course
"IV artesunate is superior to quinine for the treatment of severe malaria, and it is the first-line therapy for severe malaria." - Goldman-Cecil Medicine
STEP 5 - SPECIAL SITUATIONS
Pregnancy
| Trimester | P. falciparum | P. vivax |
|---|---|---|
| 1st trimester | Quinine + Clindamycin (7 days) | Chloroquine (safe) |
| 2nd & 3rd trimester | ACT (Artemether-Lumefantrine preferred) | Chloroquine (safe) |
| All trimesters | Primaquine CONTRAINDICATED | Avoid primaquine |
Children
- Same drugs as adults (pediatric doses only - never exceed adult dose)
- Tetracyclines/Doxycycline: avoid <8 years
- Atovaquone-Proguanil: approved only for children >5 kg
Mixed Infections (P. falciparum + P. vivax)
- Treat as P. falciparum (the more dangerous species takes priority)
- Followed by Primaquine for hypnozoite clearance (after G6PD check)
STEP 6 - TREATMENT FAILURE / RESISTANCE
No clinical/parasitological response within 72h
of full treatment course (no vomiting/diarrhea)?
        ↓
Suspect RESISTANCE
        ↓
Switch to: Oral Quinine + Tetracycline/Doxycycline
(or alternative ACT not yet used)
        ↓
Report to health authorities
Drug Summary at a Glance
┌─────────────────────────────────────────────────────────┐
│  DRUG         │  TARGET STAGE      │  KEY NOTES         │
├───────────────┼────────────────────┼────────────────────┤
│ Chloroquine   │ Blood stage        │ Resistance common  │
│               │                    │ in P. falciparum   │
├───────────────┼────────────────────┼────────────────────┤
│ Artemisinins  │ Blood stage (fast) │ Always combine;    │
│ (ACT)         │                    │ never monotherapy  │
├───────────────┼────────────────────┼────────────────────┤
│ Primaquine    │ Liver hypnozoites  │ Check G6PD first!  │
│               │ + Gametocytes      │ CI in pregnancy    │
├───────────────┼────────────────────┼────────────────────┤
│ Tafenoquine   │ Liver hypnozoites  │ Single dose;       │
│               │                    │ Check G6PD first!  │
├───────────────┼────────────────────┼────────────────────┤
│ Quinine       │ Blood stage        │ Reserve/severe;    │
│               │                    │ cardiac toxicity   │
├───────────────┼────────────────────┼────────────────────┤
│ Atovaquone-   │ Blood stage        │ Good for travel    │
│ Proguanil     │                    │ prophylaxis too    │
├───────────────┼────────────────────┼────────────────────┤
│ Mefloquine    │ Blood stage        │ Neuropsychiatric   │
│               │                    │ side effects       │
├───────────────┼────────────────────┼────────────────────┤
│ Doxycycline   │ Blood stage (slow) │ Adjunct only;      │
│               │                    │ avoid <8 years,    │
│               │                    │ pregnancy          │
└───────────────┴────────────────────┴────────────────────┘
- Diagnose - thick/thin films + RDT, identify species and parasitemia
- Master flowchart (CDC algorithm image) - guides you from blood film → species → resistance zone → drug
- Treat by species:
- P. falciparum - ACT is the backbone (Artemether-Lumefantrine most widely used); IV Artesunate for severe disease
- P. vivax / P. ovale - Chloroquine for blood stage + Primaquine/Tafenoquine for liver hypnozoites (always check G6PD first)
- P. malariae - Chloroquine alone (no hypnozoites)
- P. knowlesi - Treat like falciparum
- Severe malaria - IV Artesunate (superior to quinine), ICU admission, treat complications
- Special groups - Pregnancy (Quinine in 1st trimester, ACT in 2nd/3rd; no primaquine), Children, Mixed infections
- Treatment failure - switch to Quinine + Doxycycline within 72h of no response