

inbound3361941273663075221.jpg
Give me everything about it
Reading File
This is a brain MRI series - a full axial stack showing both T1-weighted and T2/FLAIR sequences, displayed on a single large film sheet. Let me pull comprehensive information from the medical library and current literature.
Searching sources...
Finding Sources
Finding Sources
Searching PubMed
brain MRI interpretation axial sequences radiology
Finding Sources
Finding Sources
Finding Sources
Finding Sources
Searching the Web
brain MRI axial sequences T1 T2 FLAIR normal anatomy interpretation guide 2024
Reading File
Reading File
Now I have everything I need to give a comprehensive answer. Let me also fetch the normal MRI image from the textbook to include visually.
Loading Image
Here is a thorough breakdown of everything shown in your image.
Brain MRI - Full Axial Series (Film Sheet)
What You're Looking At
This is a printed brain MRI film sheet displaying a complete axial (horizontal cross-section) stack of a single patient's brain, showing slices from the base of the skull (bottom of the cerebellum) all the way up to the top of the cerebral hemispheres. Two distinct MRI sequences are displayed side by side on the sheet:
- Left columns - T1-weighted sequence (anatomy-focused)
- Right columns - T2/FLAIR sequence (pathology-sensitive)
This is a standard neuroradiology layout used to compare anatomy and detect abnormalities simultaneously.
The Two Sequences - How to Read Them
T1-Weighted (Left Side)
| Structure | Appearance |
|---|---|
| Gray matter (cortex, basal ganglia) | Gray |
| White matter (tracts, capsules) | Bright/white |
| CSF (ventricles, sulci) | Dark/black |
| Fat | Bright |
| Bone cortex | Dark |
| Air/calcium | Dark |
T1 looks like a standard anatomical photograph of the brain. White matter truly appears "white," and gray matter is "gray" - this matches their intuitive names. T1 is best for anatomy, structural detail, and gadolinium-contrast enhancement.
T2/FLAIR (Right Side)
| Structure | Appearance |
|---|---|
| Gray matter | Light gray |
| White matter | Darker gray |
| CSF | Bright white on T2 / Dark on FLAIR |
| Edema | Bright white |
| Demyelination / gliosis | Bright white |
| Ferritin in basal ganglia | Dark (black) |
T2 is essentially a "reverse" of T1 - fluid is bright, white matter goes dark. It is the pathology-sensitive sequence. FLAIR (Fluid Attenuated Inversion Recovery) is a modified T2 that suppresses the CSF signal, making it dark again - this removes the "noise" of bright CSF and makes periventricular and cortical lesions much more visible.
The key teaching rule: "Look at the ventricles. If CSF is dark = T1. If CSF is bright = T2. If CSF is dark but white matter is also dark = FLAIR." - Neuroanatomy through Clinical Cases, 3rd Ed.
Slice-by-Slice Anatomy (Inferior to Superior)
Row 1 - Posterior Fossa / Skull Base
- Cerebellum: paired hemispheres with folial pattern (folia = fine parallel folds)
- Brainstem (pons/medulla): midline oval structure
- Fourth ventricle: CSF-filled space between brainstem and cerebellum
- Basilar artery: seen as a "flow void" (signal absence due to fast-moving blood) on T2
Row 2 - Midbrain / Upper Posterior Fossa
- Temporal lobes: lateral structures
- Midbrain: butterfly-shaped with cerebral aqueduct
- Ambient cisterns: CSF-filled spaces around the midbrain
- Cerebellar vermis: midline cerebellar structure
Row 3 - Basal Ganglia / Thalamic Level
- Thalami: paired ovoid gray matter structures flanking the third ventricle
- Caudate nuclei: C-shaped structures lining the lateral ventricles
- Putamen and globus pallidus (together = lenticular nucleus): lateral to internal capsule
- Internal capsule: bright white matter band between basal ganglia and thalamus on T1
- Third ventricle: thin midline CSF slit between thalami
- Lateral ventricles (frontal and temporal horns): visible at this level
Row 4 - Ventricular Body Level
- Body of lateral ventricles: large paired CSF spaces; dark on T1, bright on T2, dark on FLAIR
- Corpus callosum: white matter commissure connecting the hemispheres (genu anteriorly, body, splenium posteriorly)
- Choroid plexus: within the ventricles, produces CSF
- Periventricular white matter: the region immediately surrounding the ventricles (highly clinically significant - site of MS plaques, small vessel disease)
Row 5 - Centrum Semiovale
- Centrum semiovale: large expanse of deep white matter carrying projection, association, and commissural fibers
- Cortical gyri and sulci: the convoluted folds of gray matter become prominent here
- Falx cerebri: midline dural fold separating hemispheres, appears as a thin dark line
Row 6 - High Convexity / Vertex
- Cerebral cortex: thin ribbon of gray matter at the periphery
- Subcortical U-fibers: short association fibers just beneath the cortex
- Widened sulci (if present): suggests cortical atrophy
- Superior sagittal sinus: midline posterior; may show flow void
MRI Physics Basics
Why Do Tissues Differ?
Signal intensity in MRI depends on:
- Water content - more water = brighter on T2
- Fat content - fat is bright on T1
T1 relaxation (longitudinal) - the time for hydrogen protons to realign with the magnetic field after a radiofrequency pulse. Short T1 = bright signal (fat, gadolinium).
T2 relaxation (transverse) - the time for protons to lose phase coherence. Long T2 = bright signal (fluid, edema).
FLAIR parameters: Long TR (>6000 ms), long TE (~100 ms), and a specific inversion time (TI ~2000-2500 ms) chosen to null the CSF signal entirely.
Standard Sequence Parameters
| Sequence | TR (ms) | TE (ms) | CSF appearance |
|---|---|---|---|
| T1-weighted | ~500 | ~14 | Dark |
| T2-weighted | ~4000 | ~90 | Bright |
| FLAIR | ~9000 | ~120 | Dark (suppressed) |
What to Look For Pathologically (Systematic Approach)
1. White matter signal - Bright foci on T2/FLAIR in white matter suggest:
- Small vessel ischemic disease (periventricular, subcortical)
- Demyelination (MS plaques - often ovoid, periventricular, perpendicular to ventricles = "Dawson fingers")
- Vasculitis, CADASIL, metabolic disease
2. Ventricles - Enlarged ventricles may indicate:
- Hydrocephalus (obstructive vs communicating)
- Cerebral atrophy (ex vacuo)
- Normal aging
3. Gray-white junction - Lesions here suggest:
- Metastatic disease (most common site for brain mets)
- Embolic infarcts
4. Cortical signal - Restricted diffusion (bright on DWI) = acute stroke; cortical FLAIR hyperintensity = meningeal/cortical pathology
5. Basal ganglia signal - Iron deposition in globus pallidus and substantia nigra causes dark signal on T2 (normal with aging); abnormal T2 bright signal suggests metabolic disease, Wilson's, or Leigh syndrome
6. Midline shift - Any displacement of the falx, ventricles, or brainstem from midline indicates a mass effect (hemorrhage, tumor, large infarct)
7. Cortical sulci / gyri - Effacement of sulci = edema or mass; exaggerated widening = atrophy
Additional MRI Sequences (Not Shown But Clinically Important)
| Sequence | Best Use |
|---|---|
| DWI (Diffusion-weighted) | Acute stroke (restricted diffusion = bright), abscess, dense tumors |
| ADC map | Confirms true restriction (dark on ADC) vs. T2 shine-through (bright on ADC) |
| GRE/SWI (Gradient echo / Susceptibility) | Microhemorrhages, old blood, calcification - appears dark/"blooms" |
| T1+Gadolinium | Blood-brain barrier breakdown - tumors, abscess ring, MS active plaques, meningitis |
| MRA (MR Angiography) | Vascular anatomy, stenosis, aneurysm |
| MRS (Spectroscopy) | Metabolite profile - useful for tumor typing |
Gadolinium Contrast
Gadolinium is a paramagnetic agent that shortens T1 relaxation time ("T1-shortening"). When the blood-brain barrier is disrupted - by tumor, inflammation, active MS plaque, abscess, or meningitis - gadolinium leaks into the tissue and makes it bright on post-contrast T1. Normal brain parenchyma does not enhance because the intact BBB blocks gadolinium entry.
Normal vs. Abnormal at a Glance
Normal findings on this type of scan:
- Symmetric gray and white matter differentiation
- Ventricles proportionate to age
- No midline shift
- No abnormal signal foci in white matter
- Clear cortical ribbon without signal change
- CSF spaces (sulci, cisterns) appropriate for age
Red flags:
- Asymmetric signal - any bright area on FLAIR/T2 that is not mirrored on the other side
- Periventricular FLAIR bright spots in a young patient (MS, vasculitis)
- Cortical diffusion restriction (stroke)
- Mass with surrounding edema (bright FLAIR halo)
- Loss of normal gray-white differentiation (large infarct, encephalitis)
- Midline shift
- Absent flow void in major vessels (thrombosis)
Reference Comparison (Normal MRI from Textbook)
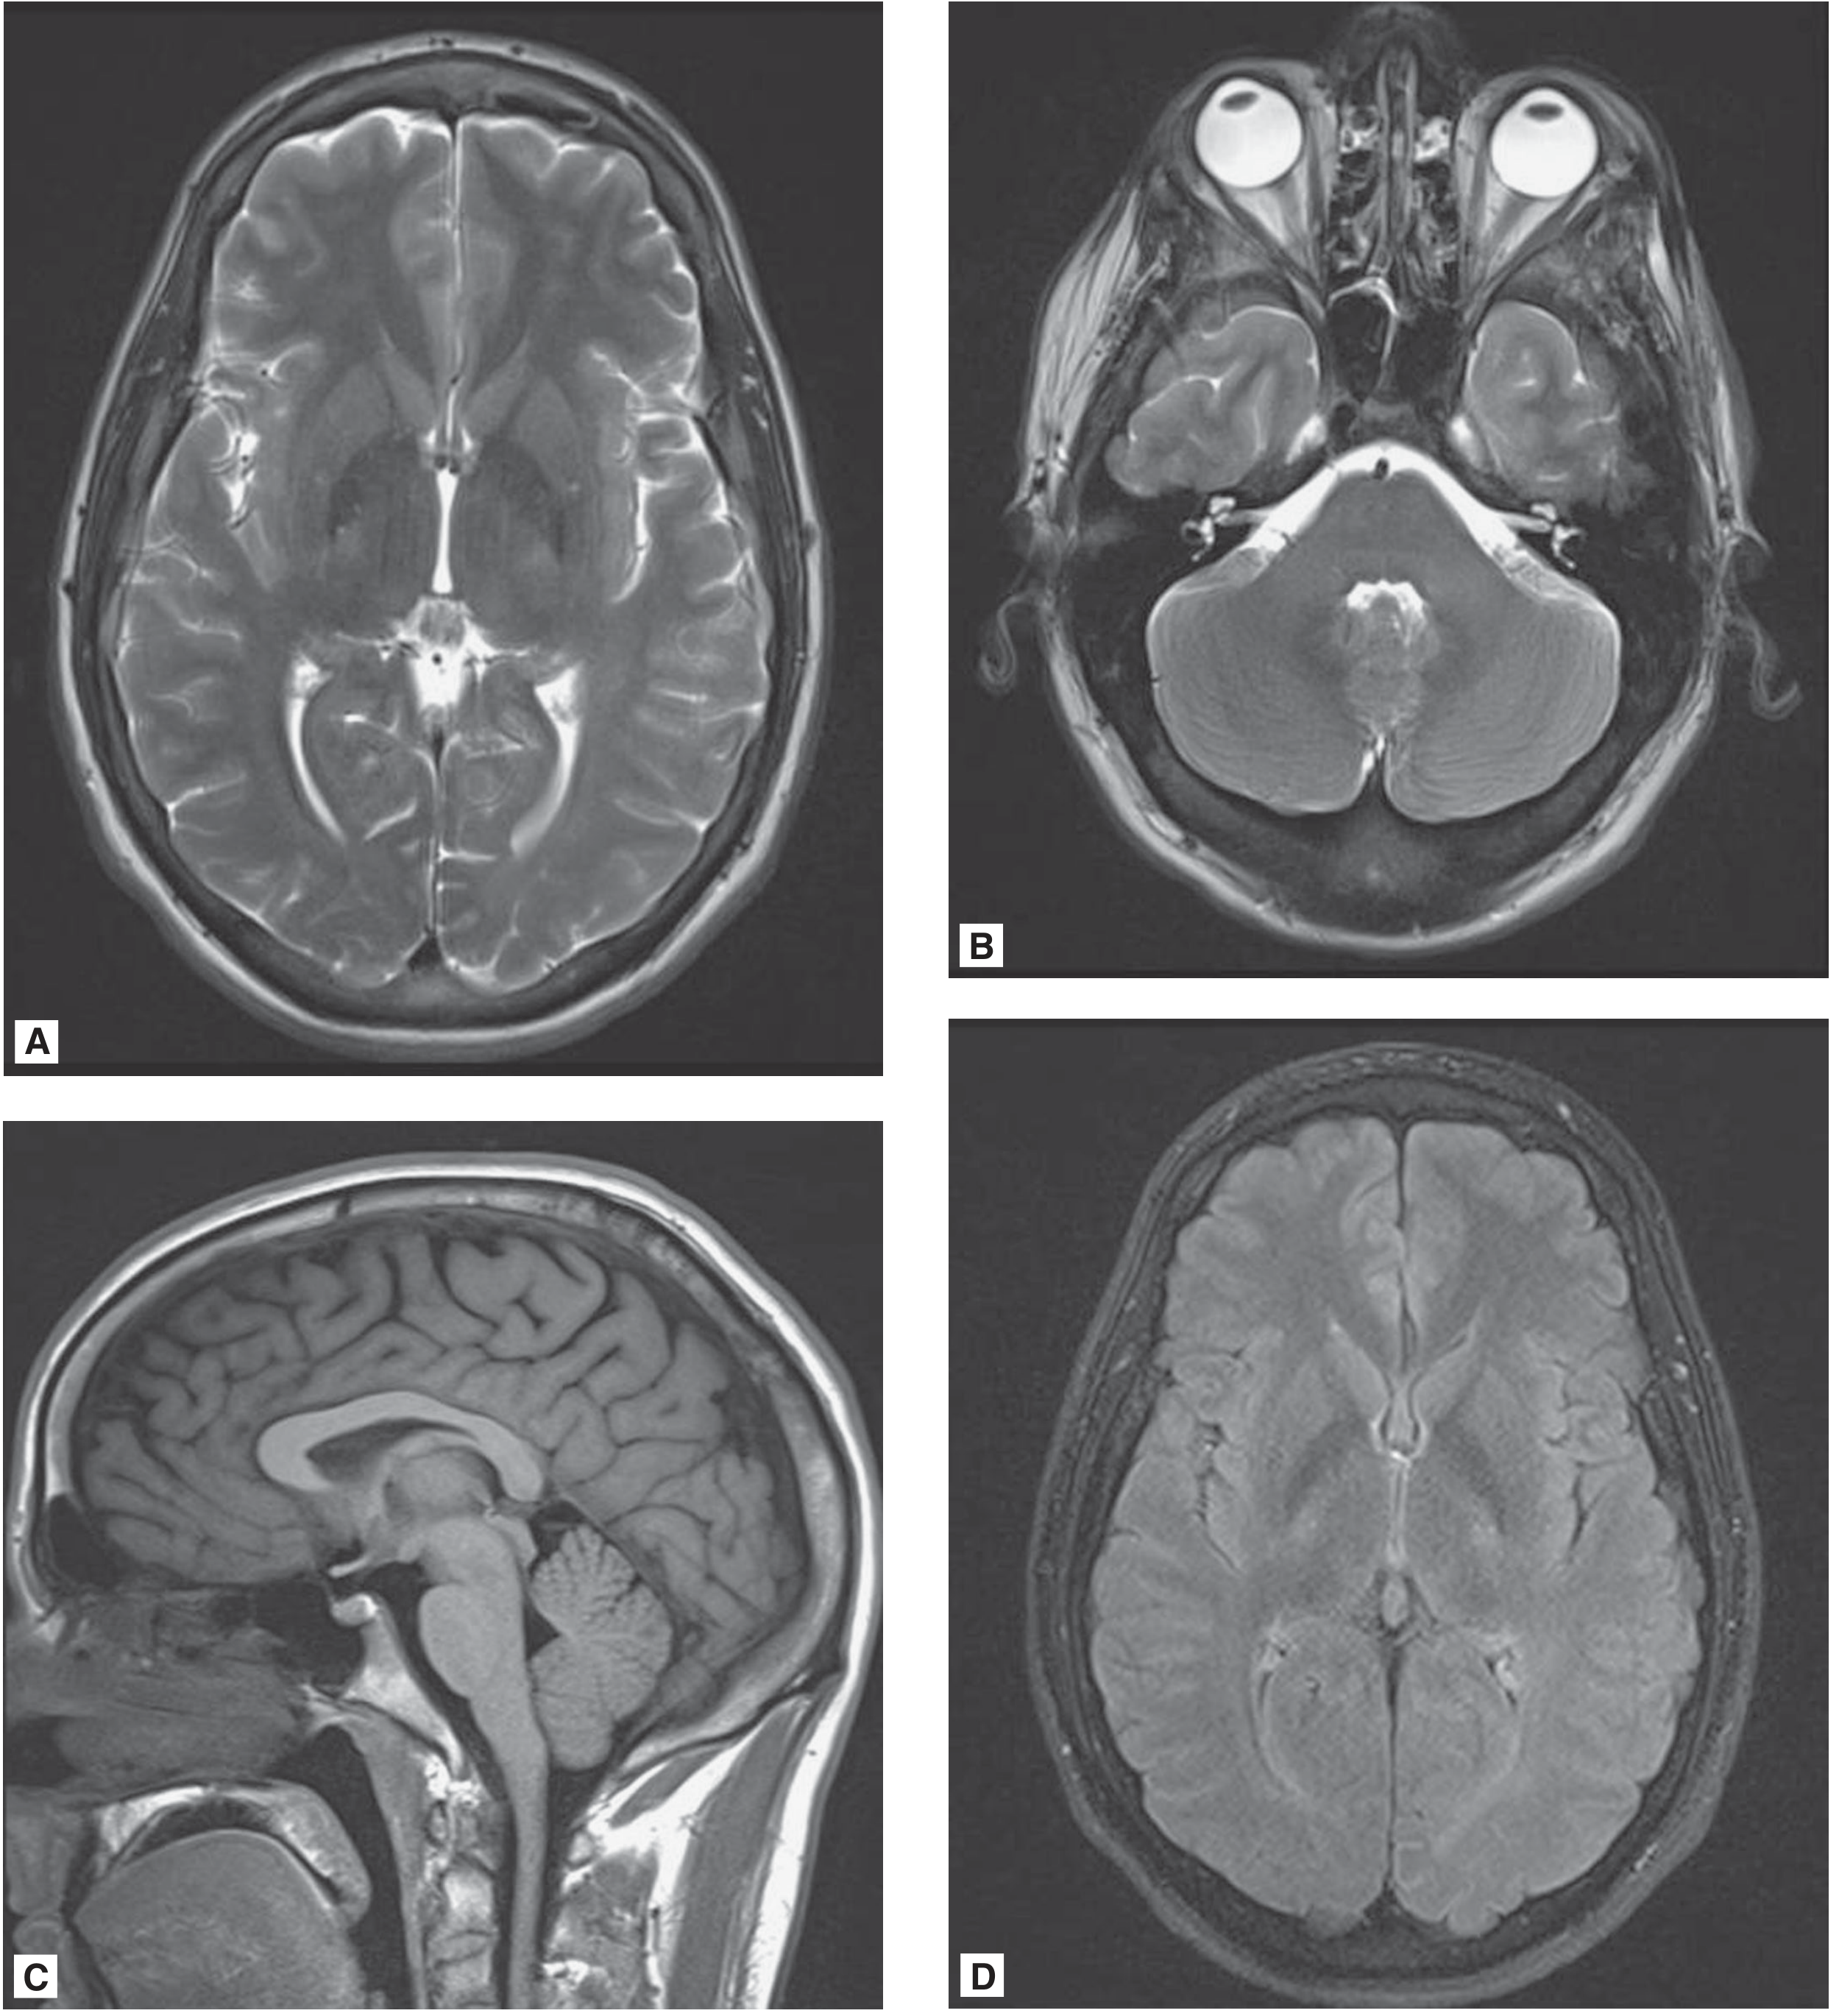
Normal brain MRI. (A) T2 axial at basal ganglia level - gray matter brighter than white matter, bright CSF in ventricles. (B) T2 at posterior fossa - bright vitreous fluid, flow void in basilar artery. (C) T1 sagittal - white matter bright, corpus callosum well-defined, normal posterior pituitary "bright spot." (D) FLAIR axial - CSF suppressed to dark, gray-white differentiation accentuated. - Adams and Victor's Principles of Neurology, 12th Ed.
Summary
Your image shows a standard clinical brain MRI axial series on a single film, presenting both T1 and T2/FLAIR sequences in the same patient. The left half of the sheet contains T1 slices (white matter = bright, CSF = dark), and the right half contains T2/FLAIR slices (fluid = bright on T2, dark on FLAIR, edema/pathology = bright). Reading it requires going through each level systematically - posterior fossa at the top rows, basal ganglia/ventricles in the middle, and high convexity cortex at the bottom rows - and comparing signal symmetry, white matter character, ventricular size, and presence of any mass effect or abnormal signal focus.
Sources: Neuroanatomy through Clinical Cases, 3rd Ed. (Table 4.3); Adams and Victor's Principles of Neurology, 12th Ed. (MRI chapter); MRI Basics - Case Western Neurology; MRI Master T1 vs T2 vs FLAIR
This is a shared conversation. Sign in to Orris to start your own chat.