
Diabetes incepidus
"diabetes insipidus"[MeSH Terms] AND ("diagnosis" OR "treatment")
diabetes insipidus ADH vasopressin mechanism diagram
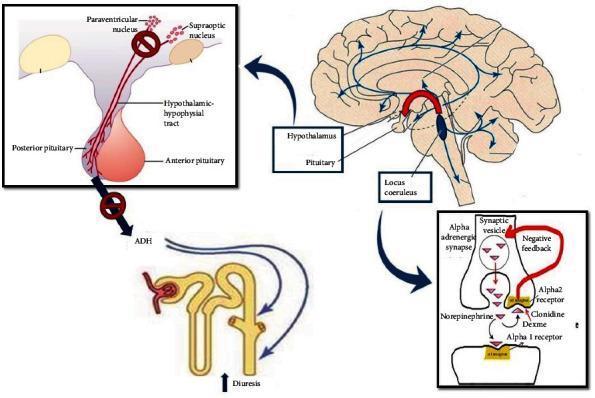
This pathophysiology diagram illustrates the neural and endocrine pathways involved in dexmedetomidine-induced central diabetes insipidus. The graphic features four interconnected panels: 1) A sagittal brain illustration showing the locus coeruleus projecting noradrenergic pathways to the hypothalamus and cortex. 2) A detailed view of the hypothalamic-hypophysial tract, highlighting the paraventricular and supraoptic nuclei. A prohibition sign over the tract indicates impaired signaling to the posterior pituitary, resulting in decreased Antidiuretic Hormone (ADH) release. 3) A molecular view of an alpha-adrenergic synapse where dexmedetomidine (Dexme) and clonidine act as alpha-2 receptor agonists, mediating negative feedback that inhibits norepinephrine release. 4) A renal tubule schematic showing that the inhibition of ADH leads to increased diuresis at the collecting duct. This educational visual explains how alpha-2 adrenergic stimulation at the locus coeruleus modulates ADH secretion and impacts water reabsorption in the kidney, which is clinically relevant to understanding medication-induced polyuria in critical care settings.
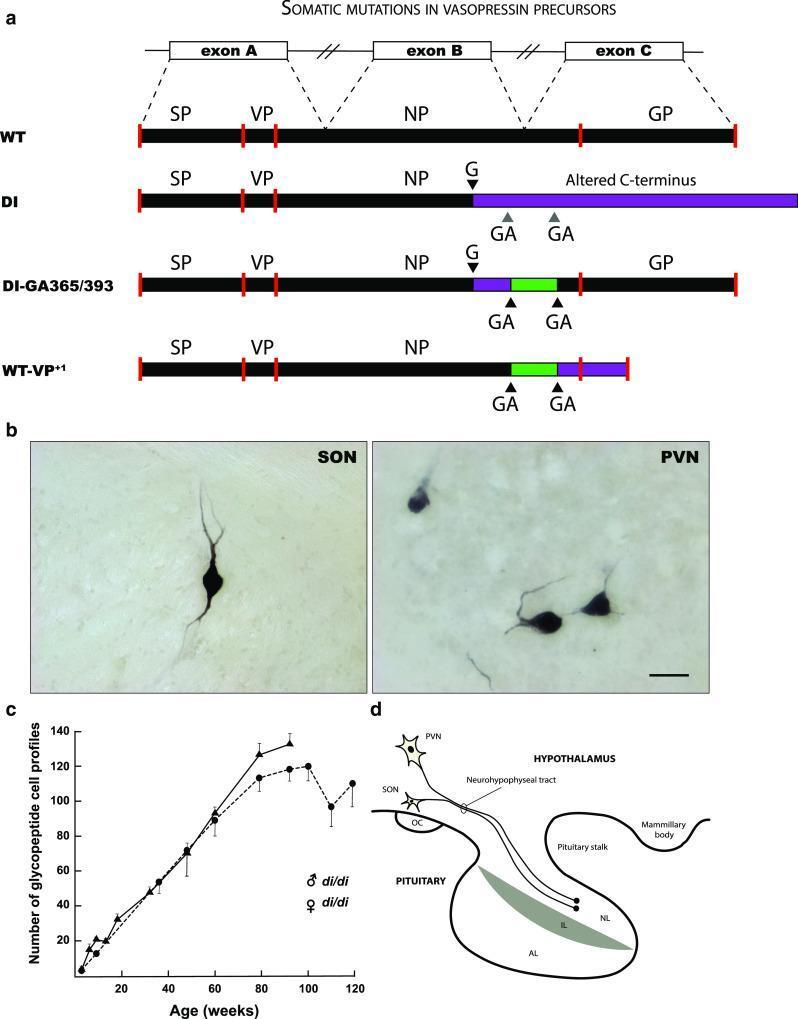
This composite educational image illustrates somatic mutations in vasopressin (VP) precursors, focusing on the homozygous Brattleboro rat model of diabetes insipidus. Panel (a) presents a molecular genetics schematic comparing wild-type (WT) VP gene structure (exons A, B, and C) with mutant forms (DI, DI-GA365/393, and WT-VP+1). It highlights a single base deletion (G) in the DI mutant causing an altered C-terminus, and secondary GA deletions that restore the reading frame in the DI-GA365/393 variant. Panel (b) features immunohistochemistry of the rat hypothalamus, showing VP-immunoreactive neurons in the supraoptic nucleus (SON) and paraventricular nucleus (PVN), demonstrating the visual result of frame-restoring somatic mutations. Panel (c) is a line graph depicting the age-dependent increase of glycopeptide-positive cell profiles in both male and female rats, indicating a steady rate of post-mitotic mutation. Panel (d) provides an anatomical diagram of the hypothalamus-pituitary axis, illustrating the axonal transport of neurosecretory granules from SON and PVN neurons through the neurohypophyseal tract to the neural lobe (NL) of the pituitary gland.
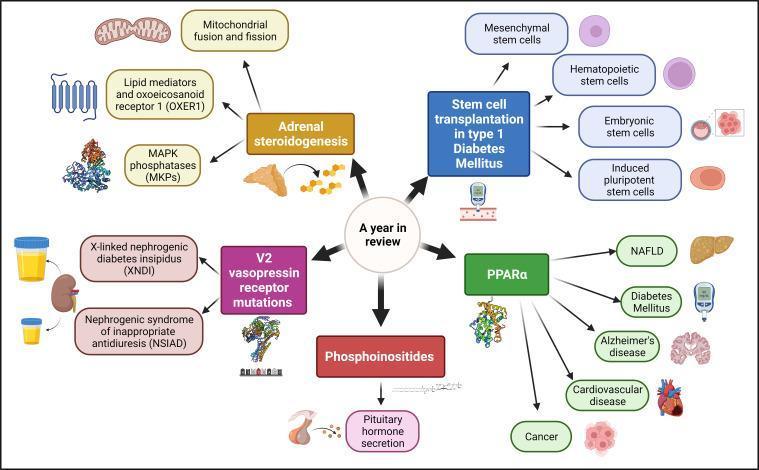
Educational infographic and concept map summarizing key research topics in cellular endocrinology. Centered on the theme 'A year in review,' the diagram branches into five primary pillars: Adrenal steroidogenesis, Stem cell transplantation in type 1 Diabetes Mellitus, PPARα, Phosphoinositides, and V2 vasopressin receptor mutations. Each pillar connects to specific sub-topics and clinical conditions through arrows and illustrative icons. Key anatomical and physiological concepts shown include mitochondrial dynamics (fusion/fission), adrenal gland function, and pituitary hormone secretion. Pathological associations are highlighted via icons representing NAFLD (liver), Alzheimer's disease (brain), cardiovascular disease (heart), and renal conditions like X-linked nephrogenic diabetes insipidus (kidney/urine specimens). Molecular biology elements include G protein-coupled receptors (GPCRs), MAPK phosphatases, and various stem cell types (mesenchymal, hematopoietic, embryonic, and iPSCs). This visual serves as a comprehensive overview of hormonal signaling pathways, metabolic disorders, and regenerative medicine within the endocrine system, tailored for advanced medical students and researchers.
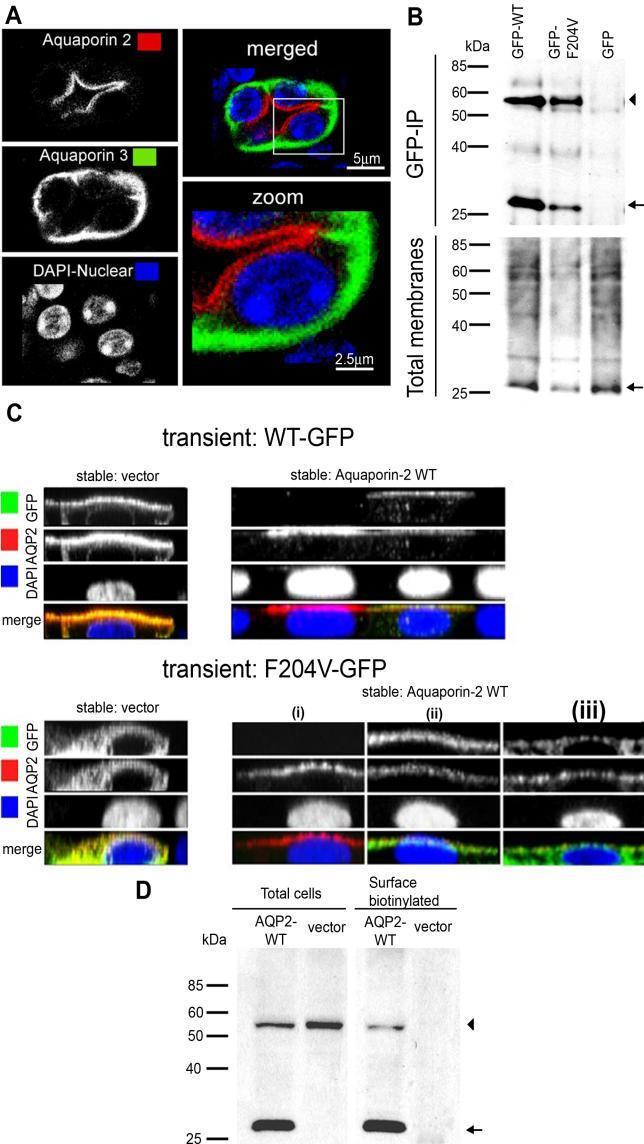
This composite image illustrates the molecular mechanisms of Aquaporin 2 (AQP2) trafficking and the rescue of the F204V mutation in Nephrogenic Diabetes Insipidus (NDI) models. Panel A shows immunohistochemistry of kidney sections from heterozygous Aqp2 F204V/+ mice, demonstrating normal dDAVP-stimulated apical localization of AQP2 (red) relative to the basolateral marker AQP3 (green). Nuclei are counterstained with DAPI (blue). Panel B presents a Western blot of a GFP-immunoprecipitation (GFP-IP) assay in MDCK cells, confirming a physical interaction between wild-type AQP2 and the F204V mutant protein. Panel C displays confocal immunocytochemistry and z-sectional images of polarized MDCK cells. It compares the localization of transiently transfected WT-GFP and F204V-GFP. While F204V-GFP is cytoplasmic/perinuclear in vector-only cells, it shows rescued apical surface localization when co-expressed with stable AQP2-WT. Panel D provides biochemical evidence via surface biotinylation, showing that AQP2-F204V is only present at the cell surface when co-expressed with wild-type AQP2, supporting a 'piggy-back' rescue mechanism relevant to heterozygous clinical phenotypes.
Diabetes Insipidus (DI)
Definition
Pathophysiology & Classification
1. Central (Neurogenic) DI
- The hypothalamus-posterior pituitary fails to secrete vasopressin (ADH) in response to elevated osmolality
- As few as 10-15% of normal vasopressinergic hypothalamic neurons is sufficient to prevent symptoms - loss of even a small fraction beyond this triggers rapid symptomatic polyuria
- Without ADH, the collecting duct cannot insert aquaporin water channels (AQP2) into luminal membranes, so dilute filtrate is excreted unchanged
- Plasma vasopressin is unmeasurable or inappropriately low for the plasma osmolality
- Causes: tumors, head injury, hemorrhage, neurosurgery (especially transsphenoidal pituitary resection), neurosarcoidosis, histiocytosis, tuberculous meningitis, multiple sclerosis, or idiopathic
- Autosomal dominant hereditary forms exist (mutations in the signal peptide or neurophysin portion of the pre-prohormone)
2. Nephrogenic DI
- The kidney does not respond to normal or elevated ADH levels
- Congenital:
-
90% - mutations in the AVPR2 gene (V2 vasopressin receptor) - X-linked, prevalence ~4-8 per million male births
- <10% - mutations in the AQP2 gene (aquaporin 2 water channel) - autosomal dominant or recessive
-
- Acquired (more common than congenital):
- Lithium (most common drug cause - interferes with AQP2 insertion)
- Hypercalcemia
- Hypokalemia
- Ureteric obstruction
- CKD
- Demeclocycline
- Goldman-Cecil Medicine, p. 1204; Tietz Textbook, p. 1895
3. Osmoreceptor Dysfunction
4. Primary Polydipsia (not true DI, but important differential)
- Psychogenic polydipsia - excess intake due to psychiatric illness (schizophrenia, mania, OCD); prevalence up to 40% in psychiatric hospitals
- Dipsogenic DI - resetting of thirst threshold below the ADH secretion threshold; idiopathic or from hypothalamic lesions
- Sustained high fluid intake washes out the medullary concentrating gradient, so patients may fail to concentrate urine even with vasopressin administration
5. Gestational DI
- Increased placental vasopressinase degrades circulating ADH during pregnancy
- Responds to desmopressin (which is resistant to vasopressinase)
Clinical Features
| Feature | Central DI | Nephrogenic DI |
|---|---|---|
| Urine volume | Up to 18-24 L/day | Up to 20 L/day |
| Onset | Often abrupt (days to weeks) | Congenital: from birth; acquired: variable |
| Thirst | Prominent; preference for cold liquids | Prominent |
| Nocturia | Yes - impairs sleep | Yes |
| Serum Na | High-normal to elevated if thirst impaired | Elevated if severe |
| Serum osmolality | Elevated or high-normal | Elevated |
- If thirst is also impaired (damage to thirst center co-localised with hypothalamus), dangerous hyperosmolarity and irreversible brain damage can result
- In children with congenital disease from birth: massive dilatation of the renal pelvis, ureters, and bladder can develop - Goldman-Cecil Medicine, p. 1205
Diagnosis
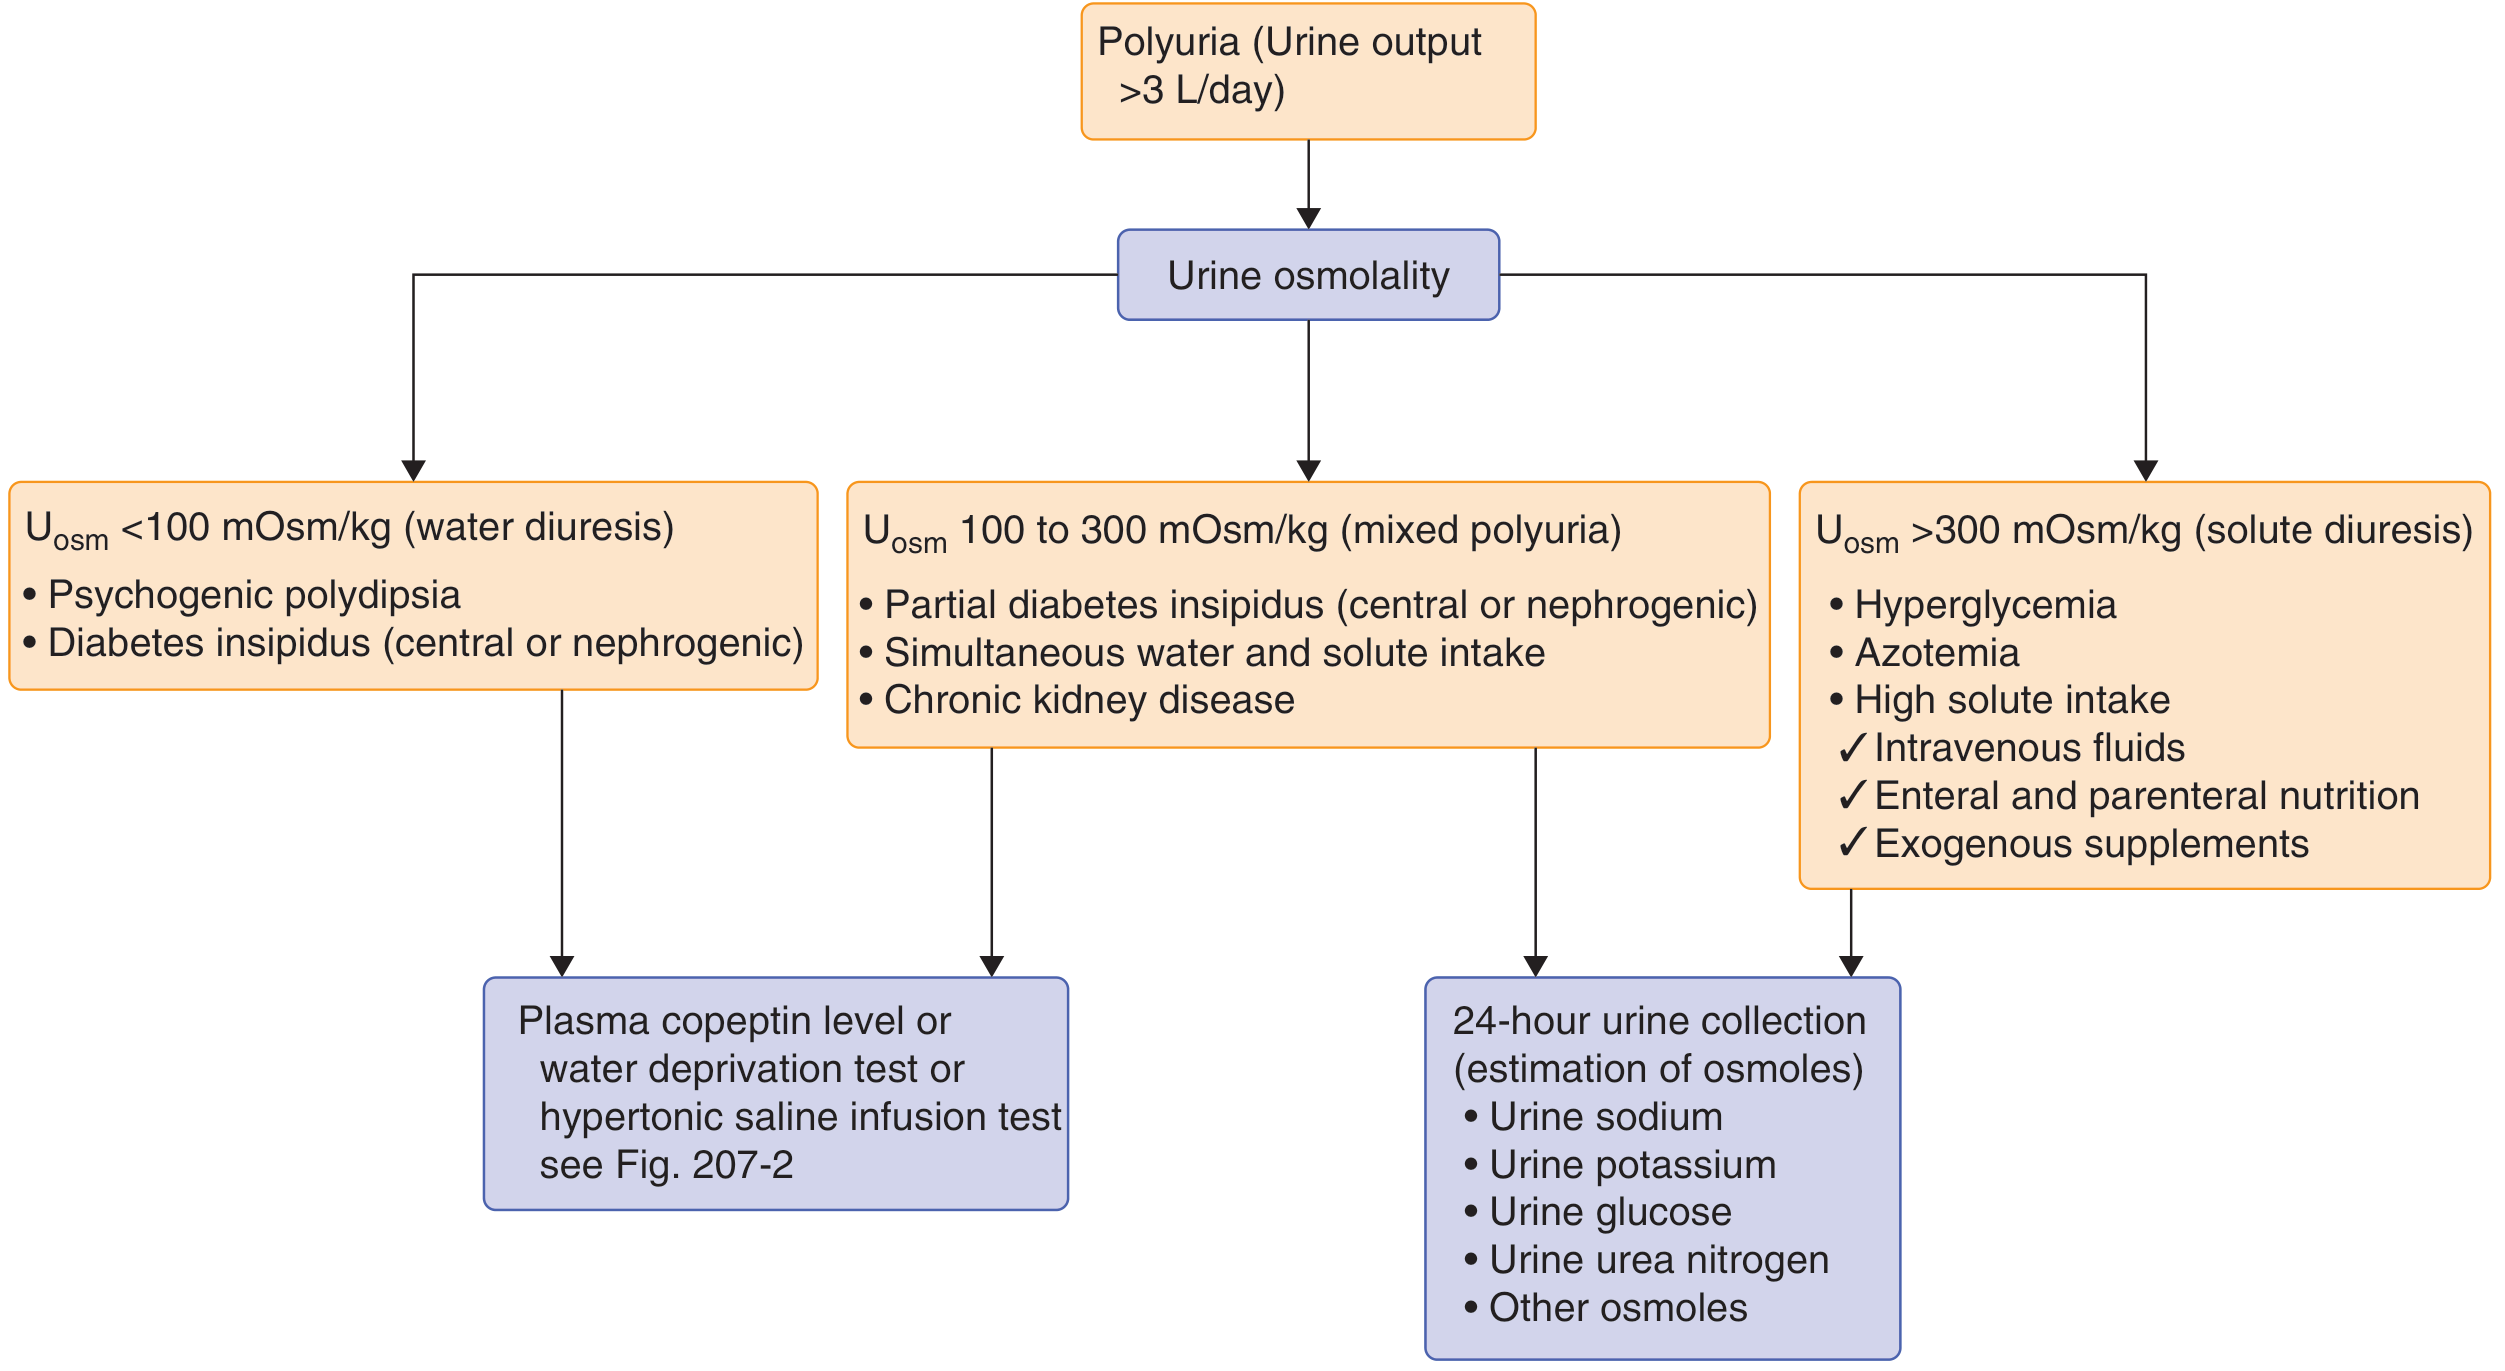
- Uosm <300 mOsm/kg = hypotonic (water diuresis) → consider DI or primary polydipsia
- Uosm >300 mOsm/kg = solute diuresis → investigate for hyperglycemia, azotemia, etc.
- ≥21.4 pmol/L → confirms partial or complete nephrogenic DI
- <2.6 pmol/L → confirms complete central DI
- Intermediate → proceed to water deprivation test or hypertonic saline infusion test
- Withhold all fluid; collect hourly urine volume and osmolality; monitor weight and BP
- Stop when Uosm plateaus (<30 mOsm/kg rise over 3 consecutive hours), weight drops 3-5%, or BP falls >20 mmHg systolic
- Measure plasma vasopressin, then administer 2 µg desmopressin IV/SC
- Measure Uosm at 30, 60, 120 min after injection
| Diagnosis | Baseline Uosm | After Desmopressin |
|---|---|---|
| Normal | Rises >800 mOsm/kg | Minimal further rise |
| Complete central DI | Low (<300) | >50% rise |
| Partial central DI | Partial rise | 10-50% rise |
| Complete nephrogenic DI | Low | <10% rise (no response) |
| Primary polydipsia | Partial rise | Minimal additional rise |
- Henry's Clinical Diagnosis and Management, p. 735
Treatment
Central DI
- Desmopressin (DDAVP) - synthetic vasopressin V2 receptor agonist, first-line treatment
- Routes: intranasal (10-40 µg/day), oral (0.1-1.2 mg/day), or parenteral
- Eliminates nocturia; reduces urine volume dramatically
- Risk: hyponatremia if fluid intake is not reduced appropriately
- Carbamazepine, chlorpropamide, clofibrate - augment residual ADH secretion in partial DI
Nephrogenic DI
- Remove the causative agent if possible (e.g., stop lithium, correct hypercalcemia or hypokalemia)
- Low-sodium, low-protein diet - reduces solute load delivered to collecting duct
- Thiazide diuretics (e.g., hydrochlorothiazide) - cause mild volume depletion → increase proximal tubular reabsorption → less fluid reaches the collecting duct → reduced urine output (paradoxical antidiuretic effect)
- Amiloride - blocks lithium entry into principal cells; useful for lithium-induced NDI
- NSAIDs (indomethacin) - reduce prostaglandin synthesis → enhance the limited tubular response to ADH
- Desmopressin generally has little/no effect in complete nephrogenic DI
Primary Polydipsia
- Fluid restriction
- Treat underlying psychiatric illness
Key Distinguishing Points: DI vs. Diabetes Mellitus
| Feature | Diabetes Insipidus | Diabetes Mellitus |
|---|---|---|
| Urine glucose | Absent | Present |
| Blood glucose | Normal | Elevated |
| Urine osmolality | Very low | High (due to glycosuria) |
| Response to fluid restriction | Minimal urine concentration | Urine concentrates normally |
Recent Evidence (2024-2026)
- Copeptin for diagnosing DI in children (PMID 39409072) confirms copeptin's diagnostic utility in pediatric polyuria-polydipsia syndrome, supporting the shift away from the classical water deprivation test
- Copeptin post-pituitary surgery (PMID 39393633) supports early postoperative copeptin measurement for predicting DI after pituitary surgery - important for surgical practice
- Gestational DI (PMID 40440645) - a 2025 systematic review of case reports characterising this rare pregnancy-related form
Generate a patient education sheet on DI management and symptoms
What format would you like for the patient education sheet? · Which type of DI should the sheet focus on?
🩺 Patient Education Sheet
Diabetes Insipidus (DI) - Understanding Your Condition
What Is Diabetes Insipidus?
Why Does It Happen?
Type 1 - Central DI
- A head injury or brain surgery
- A tumour near the pituitary gland or hypothalamus
- An infection or inflammation in the brain
- Sometimes no clear cause is found (idiopathic)
Type 2 - Nephrogenic DI
- Certain medications - especially lithium (used for mood disorders)
- High calcium levels in the blood
- Low potassium levels
- An inherited (genetic) condition
- Chronic kidney disease
Symptoms - What to Watch For
Common Symptoms
- Passing very large amounts of urine - often 4-20 litres per day
- Extreme thirst - especially a craving for cold or iced drinks
- Waking at night to urinate (nocturia) - this is very common and disrupts sleep
- Pale or colourless urine
In Children, Also Watch For
- Unexplained crying or irritability
- Slow weight gain or poor growth
- High fever without an obvious cause
- Preferring cold drinks to warm ones
Warning Signs - Seek Medical Help Immediately If You Notice
- Confusion or difficulty thinking clearly
- Severe headache
- Nausea or vomiting with low urine output
- Signs of dehydration: dry mouth, sunken eyes, dizziness, rapid heartbeat
- Inability to keep up with fluid losses (e.g., during illness or heat)
Important: If your thirst mechanism is impaired (your doctor will tell you if this applies), you are at higher risk of dangerous dehydration. You must drink on a strict schedule, not just when you feel thirsty.
How Is It Diagnosed?
- Urine tests - to measure how concentrated your urine is
- Blood tests - to measure sodium and osmolality (the concentration of your blood)
- Copeptin blood test - a newer, reliable test that measures a substance released alongside ADH
- Water deprivation test - done in hospital under supervision; fluid is withheld for a period to see how your kidneys respond
- MRI of the brain - to look at the pituitary gland and hypothalamus
Treatment - Managing Your DI
For Central DI (brain does not make enough ADH)
- Available as a nasal spray, tablet, or injection
- Usually taken once or twice a day
- You should notice a big reduction in urine output within hours
- Take it at the same time each day
- Do not drink extra fluid beyond what your thirst calls for - too much fluid with desmopressin can cause dangerously low sodium (hyponatremia)
- Tell your doctor if you develop headache, nausea, or swelling - these may be signs of too much fluid retention
- If you are unwell and cannot eat or drink, contact your medical team - your dose may need adjusting
For Nephrogenic DI (kidneys do not respond to ADH)
- Identify and remove the cause - if a medication such as lithium is responsible, your doctor will discuss whether it can be stopped or reduced. Do not stop any medication without advice.
- Low-salt, low-protein diet - reduces the workload on your kidneys; a dietitian can help with this
- Thiazide diuretics (a type of water tablet, e.g., hydrochlorothiazide) - paradoxically reduce urine volume by causing mild volume depletion
- Amiloride - sometimes added, especially for lithium-related DI
- Anti-inflammatory drugs (NSAIDs) such as indomethacin - used in some cases to help the kidneys respond better
Living With DI - Day-to-Day Tips
Hydration
- Carry a water bottle at all times
- In hot weather or during exercise, increase your fluid intake to match what you lose - discuss specific targets with your doctor
- Avoid alcohol and caffeine where possible - both increase urine production
Diet
- A low-salt diet helps reduce urine output in both types
- Avoid very high-protein meals - protein breakdown increases the load on the kidneys
- If on desmopressin, do not drink excessive fluid "just in case" - this is dangerous
Sleep
- Nocturia (waking to urinate at night) is common. Taking desmopressin in the evening can help significantly.
- Keep a water bottle by the bed in case you wake thirsty
Travel
- Always carry your medication (desmopressin) in your hand luggage when flying
- Carry a letter from your doctor explaining your condition and medications - especially for travel with injectable forms
- Inform travel companions about your condition and what to do if you become unwell
Work and Daily Life
- Access to a toilet at all times is important - discuss reasonable adjustments with your employer if needed
- You can live a normal, active life with well-managed DI
Medical Alert
- Consider wearing a medical alert bracelet or carrying a card stating you have diabetes insipidus. Emergency staff need to know - DI can be confused with other conditions.
Monitoring - What Your Doctor Will Check
| Test | Why | How Often |
|---|---|---|
| Blood sodium level | Checks for dehydration or too much water retention | Every 3-6 months (more often when newly diagnosed) |
| Blood osmolality | Monitors overall fluid balance | Alongside sodium |
| Urine osmolality | Checks how well kidneys are concentrating | Periodically |
| Blood pressure and weight | Overall fluid status | Each visit |
| MRI brain (central DI) | Monitor any underlying cause (e.g., tumour) | As directed by specialist |
Frequently Asked Questions
When to Call Your Doctor
- A sudden increase in urine output or thirst
- Signs of dehydration (dizziness, dry mouth, confusion)
- Swelling, sudden weight gain, or headache (may indicate too much desmopressin)
- You are unable to take your medication due to illness or vomiting
- Any new symptoms you are unsure about
Your Healthcare Team
| Role | Contact |
|---|---|
| Endocrinologist | |
| GP / Family Doctor | |
| Specialist Nurse | |
| Pharmacist | |
| Dietitian | |
| Emergency | 999 / 112 / 911 |
What is ADH
ADH vasopressin synthesis release hypothalamus pituitary kidney mechanism
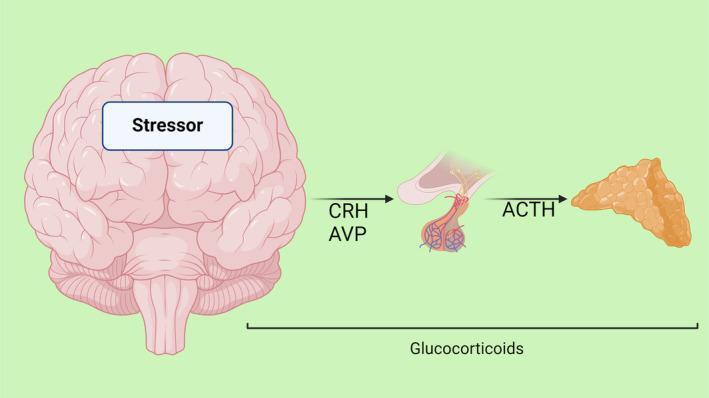
This pathophysiology diagram illustrates the hypothalamic-pituitary-adrenal (HPA) axis, the primary neuroendocrine system responsible for the human stress response. The process begins on the left with a stylized anatomical brain labeled with a 'Stressor'. An arrow indicates the transport of Corticotropin-Releasing Hormone (CRH) and Arginine Vasopressin (AVP) from the hypothalamus toward the pituitary gland. The pituitary is shown in cross-section, highlighting its anterior and posterior lobes with internal vascular structures. A subsequent arrow shows Adrenocorticotropic Hormone (ACTH) signaling from the pituitary to a tan, granular, bumpy representation of the adrenal gland on the right. Below the primary pathway, a long bracket labeled 'Glucocorticoids' spans from the adrenal gland back toward the central nervous system, representing the systemic release of cortisol and the negative feedback mechanism essential for homeostasis. This visual summarizes the endocrine cascade required to mobilize metabolic energy and coordinate physiological adaptations to acute or chronic stress.
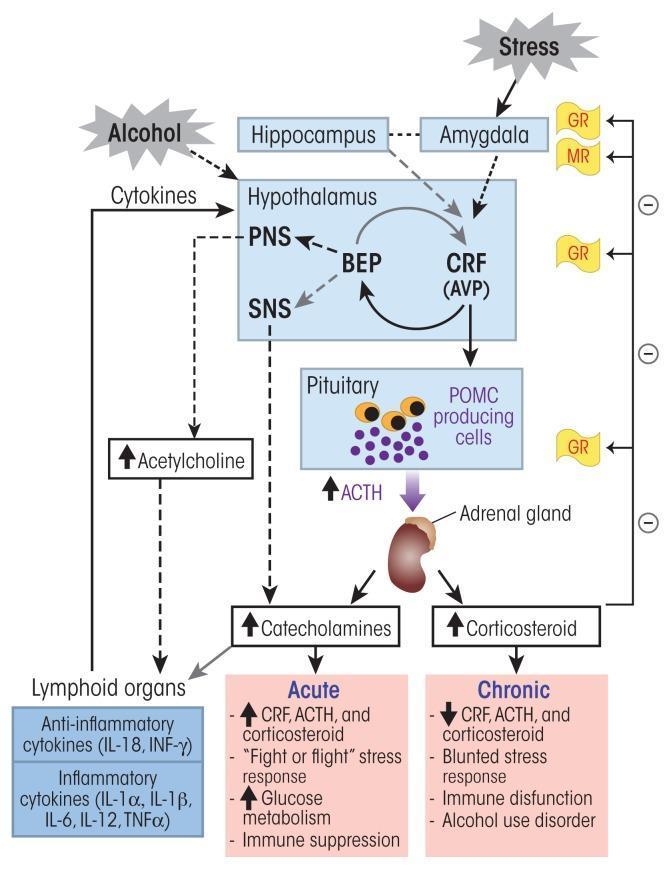
This pathophysiology diagram illustrates the hypothalamic-pituitary-adrenal (HPA) axis signaling pathway and its modulation by stress and alcohol exposure. The pathway begins with stress and alcohol stimulating the hypothalamus, hippocampus, and amygdala. The hypothalamus releases Corticotropin-Releasing Factor (CRF) and Arginine Vasopressin (AVP), which act on POMC-producing cells in the anterior pituitary to secrete Adrenocorticotropic Hormone (ACTH). ACTH stimulates the adrenal gland to release corticosteroids and catecholamines. Beta-endorphin (BEP) release from the arcuate nucleus is shown modulating the peripheral (PNS) and sympathetic nervous systems (SNS). A negative feedback loop is depicted where corticosteroids bind to glucocorticoid (GR) and mineralocorticoid receptors (MR) in the pituitary and brain. The diagram contrasts acute alcohol exposure, which leads to HPA activation (increased CRF, ACTH, and corticosteroids), 'fight or flight' responses, and immune suppression, with chronic alcohol exposure, which results in a blunted HPA response, immune dysfunction, and increased pro-inflammatory cytokines (IL-6, TNFα). It highlights the bidirectional interaction between the HPA axis and lymphoid organs through cytokine and acetylcholine signaling.
This pathophysiology diagram illustrates the neural and endocrine pathways involved in dexmedetomidine-induced central diabetes insipidus. The graphic features four interconnected panels: 1) A sagittal brain illustration showing the locus coeruleus projecting noradrenergic pathways to the hypothalamus and cortex. 2) A detailed view of the hypothalamic-hypophysial tract, highlighting the paraventricular and supraoptic nuclei. A prohibition sign over the tract indicates impaired signaling to the posterior pituitary, resulting in decreased Antidiuretic Hormone (ADH) release. 3) A molecular view of an alpha-adrenergic synapse where dexmedetomidine (Dexme) and clonidine act as alpha-2 receptor agonists, mediating negative feedback that inhibits norepinephrine release. 4) A renal tubule schematic showing that the inhibition of ADH leads to increased diuresis at the collecting duct. This educational visual explains how alpha-2 adrenergic stimulation at the locus coeruleus modulates ADH secretion and impacts water reabsorption in the kidney, which is clinically relevant to understanding medication-induced polyuria in critical care settings.
ADH - Antidiuretic Hormone (Vasopressin)
What It Is
Where It Is Made and Released
- Supraoptic nucleus (SON)
- Paraventricular nucleus (PVN)
- Vasopressin (9 amino acids) - the active hormone
- Neurophysin II (95 amino acids) - a carrier protein that stabilises ADH
- Copeptin (39 amino acids) - a glycopeptide released in equimolar amounts with ADH; used as a surrogate marker in blood tests because it is more stable than ADH itself
- Goldman-Cecil Medicine, p. 2417
What Triggers Its Release
| Stimulus | Mechanism |
|---|---|
| Increased plasma osmolality (concentrated blood) | Osmoreceptors in the anterior hypothalamus detect high osmolality and signal ADH release - the primary stimulus under normal conditions |
| Decreased blood volume / low blood pressure | Baroreceptors in the carotid sinus and aortic arch signal the hypothalamus via non-osmotic pathways - a powerful override during haemorrhage or severe dehydration |
How It Works - The Mechanism of Action
V2 Receptors (main antidiuretic action) - on kidney collecting duct cells
- ADH binds to V2 receptors on principal cells of the collecting duct
- This activates adenylyl cyclase via Gs protein → increases intracellular cAMP
- cAMP activates protein kinase A, which triggers the synthesis and insertion of aquaporin-2 (AQP2) water channels into the luminal (apical) membrane of the cell
- Water moves from the dilute tubular fluid into the hypertonic medullary interstitium, down the osmotic gradient
- Result: concentrated, small-volume urine
V1 Receptors - on vascular smooth muscle
- At high concentrations, ADH binds V1 receptors → activates phospholipase C via Gq protein → vasoconstriction
- This is why it is also called "vasopressin" - relevant in haemorrhagic shock management
Extrarenal V2-like Receptors
-
Regulate release of coagulation factor VIII and von Willebrand factor - used clinically (desmopressin given to treat mild haemophilia A and von Willebrand disease)
-
Comprehensive Clinical Nephrology 7th Ed., p. 127; Katzung, p. 1063
Normal Function Summary
High plasma osmolality
         ↓
Hypothalamus osmoreceptors activated
         ↓
ADH released from posterior pituitary
         ↓
ADH binds V2 receptors on collecting duct
         ↓
AQP2 water channels inserted into luminal membrane
         ↓
Water reabsorbed back into blood
         ↓
Concentrated urine produced
Plasma osmolality returns to normal
What Happens When ADH Is Absent or Ineffective
| Problem | Result | Disease |
|---|---|---|
| Brain does not make/release ADH | Collecting duct has no signal; AQP2 channels not inserted; water pours out as dilute urine | Central Diabetes Insipidus |
| Kidney does not respond to ADH (AQP2 or V2 receptor defect) | Same end result despite normal/high ADH levels | Nephrogenic Diabetes Insipidus |
| Too much ADH (inappropriate secretion) | Excessive water retention; sodium becomes diluted | SIADH (Syndrome of Inappropriate ADH) |
Key Facts at a Glance
| Property | Detail |
|---|---|
| Chemical type | Nonapeptide (9 amino acids) |
| Made in | Hypothalamus (supraoptic + paraventricular nuclei) |
| Released from | Posterior pituitary |
| Half-life | ~15 minutes |
| Primary stimulus | Rising plasma osmolality (>280 mOsm/kg) |
| Main action | Inserts AQP2 channels in kidney collecting duct → water reabsorption |
| Receptor for antidiuresis | V2 (Gs/cAMP pathway) |
| Receptor for vasoconstriction | V1 (Gq/phospholipase C pathway) |
| Surrogate biomarker | Copeptin (more stable, easier to measure) |
| Synthetic analogue | Desmopressin (DDAVP) - V2-selective, antidiuretic-to-pressor ratio 4000x that of vasopressin |