
Pathogenesis of type 2 diabetes mellitus in flow chart from ROBBINS AND COTRANS PATHOGENESIS OF DISEASE
Reading File
Now let me search the medical library for the Type 2 DM pathogenesis content from Robbins and Cotran.
Finding Sources
Finding Sources
Both Robbins books are available. Let me search within them for T2DM pathogenesis content and images.
Finding Sources
Finding Sources
Excellent! Found the exact sections. Let me read the full pathogenesis content from Robbins & Cotran.
Reading File
Reading File
I found the key diagram. Let me fetch it and also read the remaining content on beta-cell dysfunction.
Loading Image
Reading File
I now have everything I need - the original Fig. 24.32 flowchart from Robbins & Cotran and the complete pathogenesis text. Let me compile a comprehensive answer with the flowchart and a detailed textual flow chart.
Pathogenesis of Type 2 Diabetes Mellitus
Robbins, Cotran & Kumar - Pathologic Basis of Disease (Fig. 24.32)
Here is the original diagram from Robbins & Cotran (Fig. 24.32, p. 1020):
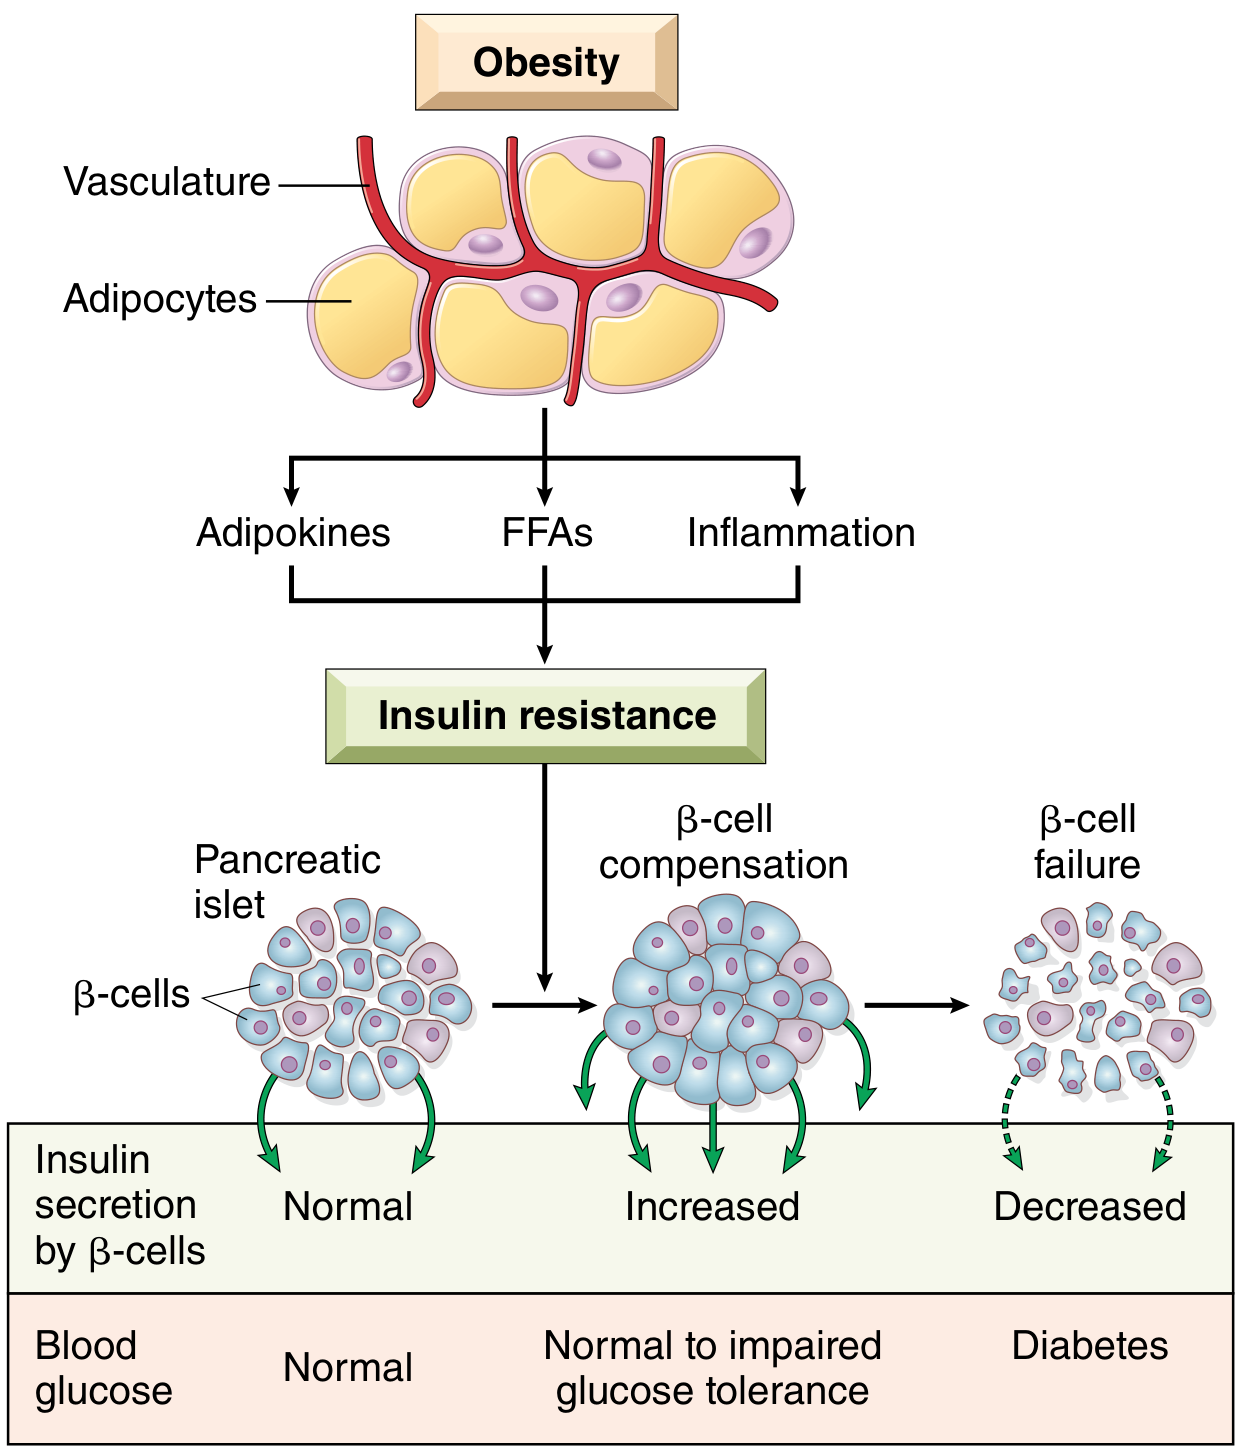
Detailed Flowchart (Text Format)
Based on Robbins & Cotran Pathologic Basis of Disease, the pathogenesis flows as follows:
GENETIC SUSCEPTIBILITY                    ENVIRONMENTAL FACTORS
(>30 GWAS loci; concordance >90%         (Obesity, sedentary lifestyle,
in monozygotic twins; genes in           sleep disorders, circadian
adipose function, β-cell function,       disruption)
obesity)
        │                                        │
        └──────────────────┬─────────────────────┘
                           ▼
                     CENTRAL/VISCERAL OBESITY
                  (BMI↑; visceral >> subcutaneous fat)
                           │
          ┌────────────────┼──────────────────────┐
          ▼                ▼                       ▼
    ADIPOKINES          FREE FATTY ACIDS        INFLAMMATION
  (↓Adiponectin,        (FFAs ↑)             (Proinflammatory
   ↑Resistin,          Central fat is         cytokines;
   ↑Leptin)            more lipolytic         IL-1β activation
  → Impair insulin                            via inflammasome)
    signaling                │
          │                  ▼
          │       DAG, ceramides, sphingolipids
          │       (toxic lipid intermediates)
          │       → Block insulin receptor
          │         tyrosine phosphorylation
          │       → ↓ IRS protein signaling
          │       → ↓ GLUT-4 translocation
          └────────────────┬──────────────────────┘
                           ▼
                    INSULIN RESISTANCE
          ┌────────────────┼──────────────────────┐
          ▼                ▼                       ▼
       LIVER          SKELETAL MUSCLE         ADIPOSE TISSUE
  ↑Gluconeogenesis   ↓Glucose uptake         Failure to inhibit
  (↓inhibition of   ↓Glycogen synthesis     hormone-sensitive
  PEPCK) →          → Postprandial          lipases → ↑FFA
  ↑Fasting glucose  hyperglycemia           release (vicious cycle)
          │
          ▼
  LIVER STEATOSIS (MASLD)
  (excess FFA → hepatic fat accumulation)

                           │
                           ▼
              ┌────────────────────────────┐
              │ EARLY: β-CELL COMPENSATION │
              │  (β-cell hyperfunction,    │
              │   hyperinsulinemia,        │
              │   β-cell mass ↑)           │
              │  Blood glucose: NORMAL or  │
              │  IMPAIRED GLUCOSE TOLERANCE│
              └────────────────────────────┘
                           │
                           │ Sustained demand over time
                           ▼
              ┌────────────────────────────┐
              │    β-CELL DYSFUNCTION       │
              │  Mechanisms:               │
              │  1. Lipotoxicity (FFAs)    │
              │  2. Glucotoxicity          │
              │     (chronic hyperglycemia)│
              │  3. ↓Incretin effect       │
              │     (↓GIP, ↓GLP-1)        │
              │  4. Islet amyloid          │
              │     deposition (>90%       │
              │     of T2D islets)         │
              │  5. Genetic polymorphisms  │
              │     in insulin secretion   │
              └────────────────────────────┘
                           │
                           ▼
              ┌────────────────────────────┐
              │      β-CELL FAILURE         │
              │  (Relative insulin         │
              │   deficiency; insulin ↓    │
              │   inadequate for blood     │
              │   glucose level)           │
              └────────────────────────────┘
                           │
                           ▼
              ┌────────────────────────────┐
              │    OVERT TYPE 2 DIABETES    │
              │  Chronic hyperglycemia →   │
              │  Long-term complications   │
              └────────────────────────────┘
Key Mechanisms - Summary Table
| Component | Mechanism | Consequence |
|---|---|---|
| Genetic factors | >30 GWAS loci; β-cell function genes | Predisposition to β-cell failure & insulin resistance |
| Obesity | Visceral > subcutaneous fat | ↑FFAs, ↑adipokines, ↑inflammation |
| FFAs | Overwhelm oxidation → DAG, ceramides | Block insulin receptor signaling; lipotoxicity to β-cells |
| Adipokines | ↓Adiponectin, ↑resistin | Impair insulin signaling |
| Inflammation | IL-1β via inflammasome; cytokines | Insulin resistance + β-cell damage |
| Insulin resistance | ↓GLUT-4, ↓IRS signaling | ↑Gluconeogenesis (liver), ↓glucose uptake (muscle) |
| β-cell compensation | Hyperfunction + hyperinsulinemia | Maintains euglycemia early; impaired glucose tolerance |
| Glucotoxicity | Chronic glucose exposure | Further impairs β-cell insulin secretion |
| Incretin defect | ↓GIP and ↓GLP-1 | Reduced glucose-stimulated insulin release |
| Amyloid deposition | IAPP deposits in islets (>90% of T2D) | β-cell "burnout" (cause or effect unclear) |
| β-cell failure | Relative insulin deficiency | Overt diabetes with chronic complications |
Source: Robbins, Cotran & Kumar - Pathologic Basis of Disease, Fig. 24.32, p. 1020. The two cardinal abnormalities are insulin resistance (preceded by obesity/environmental factors) and β-cell dysfunction (initially compensatory, ultimately failing) - neither alone is sufficient; both are required for overt T2D.
Pathogenesis of melanoma according to robbins
Searching sources...
Finding Sources
Finding Sources
Found in both Robbins books. Let me read both simultaneously for maximum detail.
Reading File
Reading File
Excellent! The key diagram (Fig. 22.21) is in Robbins Basic Pathology. Let me fetch it and also read the remaining molecular details from both books.
Loading Image
Reading File
Reading File
I also need the signaling pathway figure and the remaining content on telomerase/immune evasion from Robbins & Cotran. Let me read that.
Reading File
Let me also fetch the signaling pathway diagram (Fig. 25.7).
Loading Image
I now have all the content and both key diagrams. Here is the complete answer:
Pathogenesis of Melanoma
Robbins & Kumar - Pathologic Basis of Disease + Basic Pathology
Original Figures from Robbins
Fig. 22.21 / Fig. 25.7 - Morphologic and Molecular Steps in Melanoma Development:
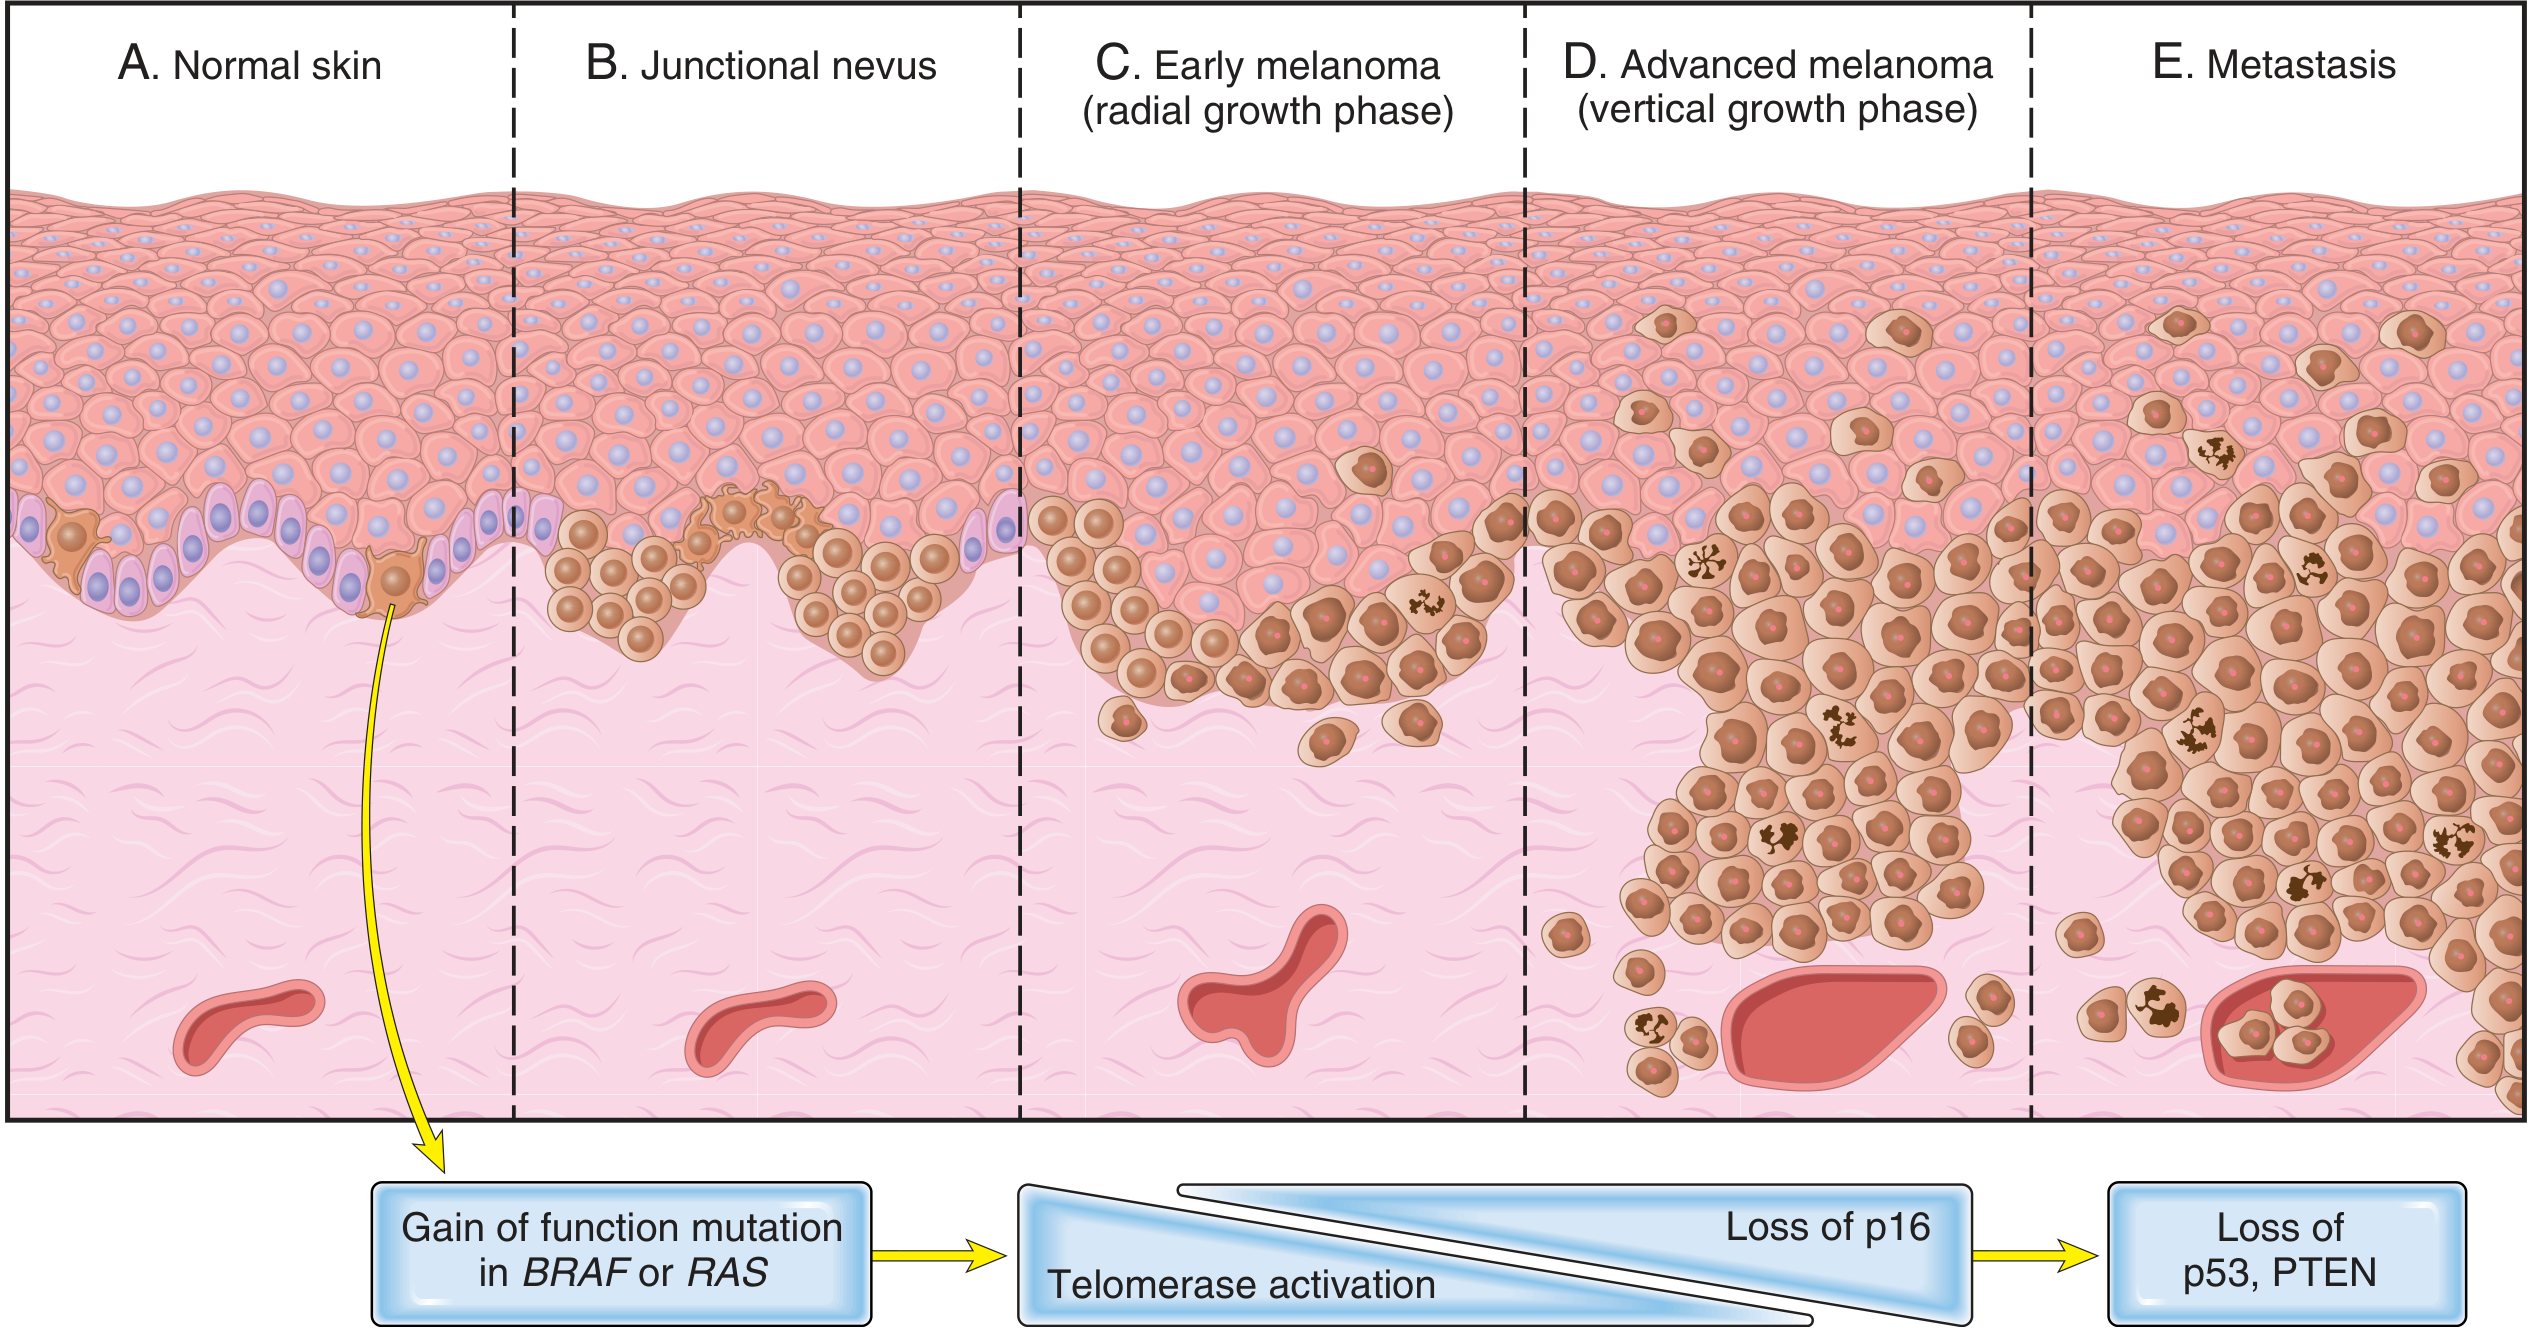
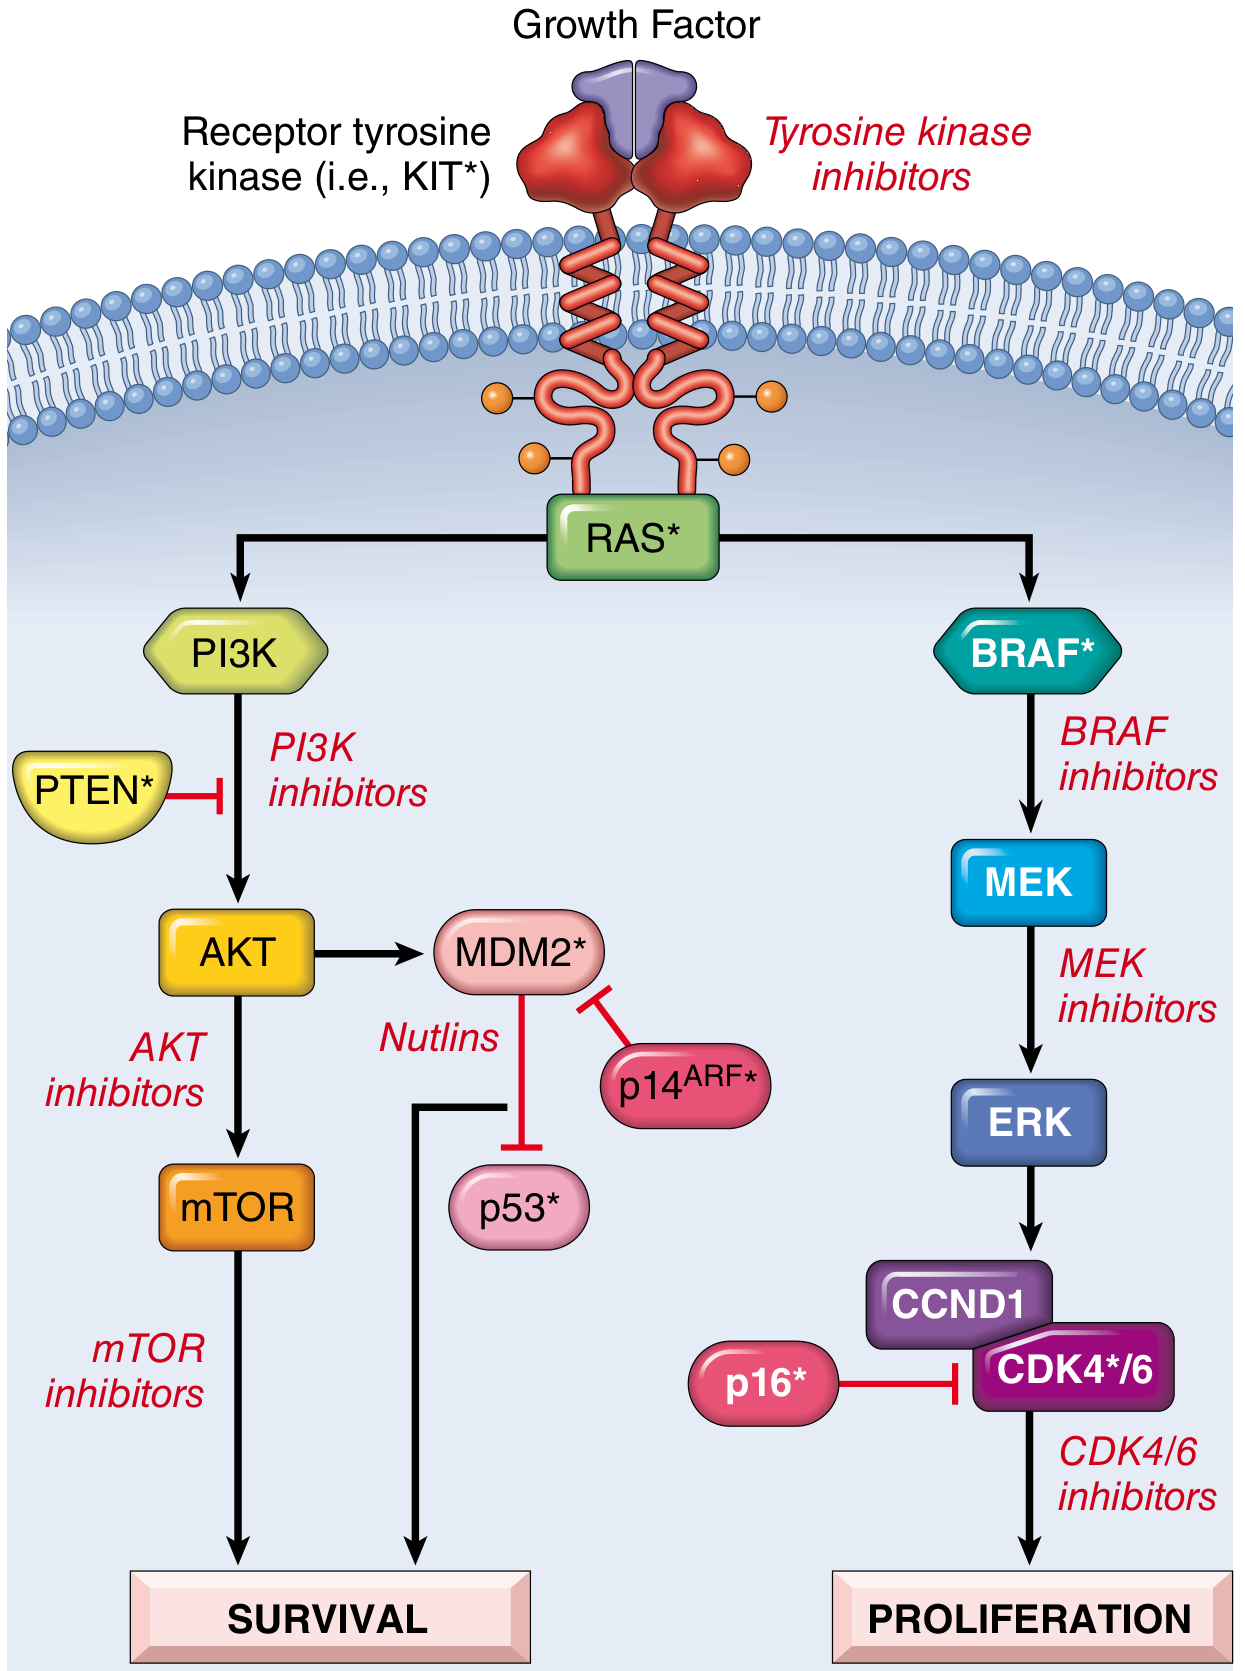
Fig. 25.7 - Signaling Pathways in Melanoma (with drug targets):
Pathogenesis Flowchart (Text)
PREDISPOSING FACTORS
        │
   ┌────┴─────────────────────────────────────────┐
   │                                              │
HEREDITARY (10%)                        SPORADIC (90%)
- Autosomal dominant,                   - UV radiation (sunlight)
  variable penetrance                   - Intermittent severe
- Germline CDKN2A mutations               sunburns early in life
  (40% of familial cases)              - Fair-skinned individuals
  → Loss of p16 (↓CDK4/6              - UV creates characteristic
    inhibition; ↑G1→S)                  point mutation signature
  → Loss of ARF (↓p53                   in melanocyte genome
    protection)                       - Non-sun-exposed sites:
- Germline TERT promoter                 KIT mutations (acral/
  mutations → ↑telomerase               mucosal), GNAQ/GNA11
                                         (uveal melanoma)
        │                                              │
        └──────────────────┬───────────────────────────┘
                           ▼
                 NORMAL MELANOCYTE
                           │
              ─────────────────────────
              STEP 1: INITIATING MUTATION
              ─────────────────────────
                           ▼
           ACTIVATING MUTATION IN BRAF (40–50%)
              or RAS (15–20%) [sun-exposed sites]
              or KIT [acral/mucosal sites]
           → Activates RAS-BRAF-MEK-ERK pathway
           → Uncontrolled cell proliferation signal
                           │
                           ▼
            JUNCTIONAL MELANOCYTE PROLIFERATION
            (lentiginous hyperplasia / benign nevus)
            ↓ Oncogene-induced SENESCENCE arrests
              further progression at this stage
                           │
              ─────────────────────────
              STEP 2: TELOMERASE ACTIVATION
              ─────────────────────────
                           ▼
          TERT PROMOTER MUTATION (~70% of sporadic)
          → ↑Telomerase expression
          → Preservation of telomere length
          → Escape from SENESCENCE
                           │
                           ▼
            EARLY MELANOMA – RADIAL GROWTH PHASE
            (horizontal spread within epidermis
             and superficial dermis)
            - No metastatic capacity yet
            - Types: superficial spreading (most common),
              lentigo maligna, acral/mucosal lentiginous
                           │
              ─────────────────────────
              STEP 3: LOSS OF CELL CYCLE CONTROL
              ─────────────────────────
                           ▼
          LOSS/MUTATION OF CDKN2A LOCUS
          (commonly mutated in sporadic melanoma)
          → Loss of p16: ↓CDK4/6 inhibition
            → ↑Cyclin D1-CDK4/6 activity
            → RB inactivated → uncontrolled S-phase entry
          → Loss of ARF: ↓MDM2 inhibition
            → ↑MDM2 → ↑p53 degradation → ↓apoptosis
                           │
                           ▼
            ADVANCED MELANOMA – VERTICAL GROWTH PHASE
            (invasive nodule; downward dermal invasion)
            - Loss of cellular maturation
            - Metastatic subclone emerges
            - Clinically: appearance of nodule in flat lesion
                           │
              ─────────────────────────
              STEP 4: SURVIVAL PATHWAY DYSREGULATION
              ─────────────────────────
                           ▼
          LOSS OF PTEN (~20% of tumors; more in
          non-sun-exposed sites)
          → Uncontrolled PI3K→AKT→mTOR signaling
          → ↑Cell survival, ↑proliferation

          LOSS OF TP53
          → Failure of apoptosis after DNA damage
          → Accumulation of aneuploidy and genomic
            copy number alterations
                           │
              ─────────────────────────
              STEP 5: IMMUNE EVASION
              ─────────────────────────
                           ▼
          High UV-induced mutational burden
          → Neoantigens on tumor surface
          → Tumor must suppress/evade host immune response
          → Upregulation of immune checkpoints
            (PD-L1, CTLA-4 pathway exploitation)
          → Muzzles melanoma-specific T cells
                           │
                           ▼
              ┌─────────────────────────┐
              │        METASTASIS        │
              │ - Lymphatic and          │
              │   hematogenous spread   │
              │ - Aneuploidy and genetic │
              │   heterogeneity ↑       │
              └─────────────────────────┘
Key Mutations - Summary Table
| Mutation | Frequency | Pathway | Effect |
|---|---|---|---|
| BRAF (activating) | 40-50% | RAS-BRAF-MEK-ERK | ↑Proliferation |
| RAS (activating) | 15-20% | Same as above + PI3K | ↑Proliferation + survival |
| TERT promoter | ~70% | Telomerase | Escape from senescence |
| CDKN2A / p16 (loss) | ~40% familial; common sporadic | CDK4/6-RB axis | Uncontrolled G1→S transition |
| CDKN2A / ARF (loss) | ~40% familial | MDM2-p53 axis | ↓p53, ↓apoptosis |
| PTEN (loss) | ~20% | PI3K-AKT-mTOR | ↑Survival signaling |
| TP53 (loss) | Late event | DNA damage response | Aneuploidy, metastasis |
| KIT (activating) | Acral/mucosal | RAS + PI3K upstream | Alternate initiation |
| GNAQ/GNA11 | Uveal melanoma | GTP-binding | Uveal-specific driver |
| NF1 (loss) | Subset | Negative RAS regulator | Unleashes RAS signaling |
Growth Phase Correlation
| Phase | Morphology | Biology | Metastatic Risk |
|---|---|---|---|
| Lentiginous / Junctional | Flat, pigmented macule | BRAF/RAS mutation; senescent | None |
| Radial growth | Flat spreading lesion | Telomerase activation; intraepidermal | Very low |
| Vertical growth | Nodule in flat lesion | p16 loss; dermal invasion | Present; increases with Breslow thickness |
| Metastatic | Distant deposits | PTEN/p53 loss; aneuploidy | Lymph nodes → viscera |
Source: Robbins & Kumar Basic Pathology (Fig. 22.21, p. 894-895) and Robbins, Cotran & Kumar Pathologic Basis of Disease (Fig. 25.7, p. 1050-1051). The stepwise accumulation of driver mutations - BRAF/RAS → TERT → p16 loss → PTEN/p53 loss - defines the progression from benign nevus to lethal metastatic melanoma.
This is a shared conversation. Sign in to Orris to start your own chat.