
Mi
Myocardial infarction
What would you like to know about myocardial infarction? · What level of detail do you need?
myocardial infarction ECG STEMI pathology diagram
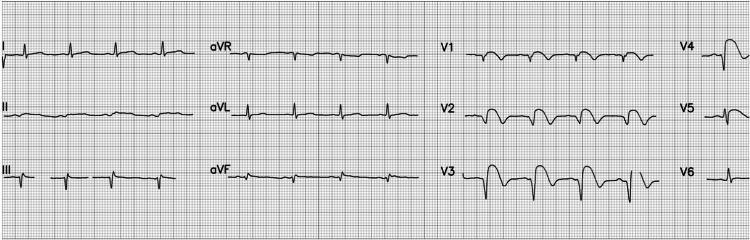
A 12-lead electrocardiogram (ECG) demonstrating an acute ST-elevation myocardial infarction (STEMI) with characteristic anterior and anterolateral findings. The tracing displays a normal sinus rhythm with a heart rate of approximately 84 beats per minute and normal P wave morphology. Significant pathology is localized to the precordial leads, specifically V2 through V5, which exhibit pronounced ST-segment elevation. This elevation presents with a convex 'tombstoning' morphology, a high-risk indicator of extensive myocardial injury. Additionally, evolving QS waves are visible in leads V2 and V3, indicating necrotic changes or transmural infarction. These findings are clinically consistent with an acute occlusion of the left anterior descending (LAD) coronary artery. The limb leads (I, II, III, aVR, aVL, aVF) show relatively stable baselines, though mild reciprocal changes or secondary ST-T wave abnormalities may be present in the inferior leads. This diagnostic image serves as a classic educational example of early-stage STEMI progression and the visual identification of localized ischemic injury on electrocardiography.
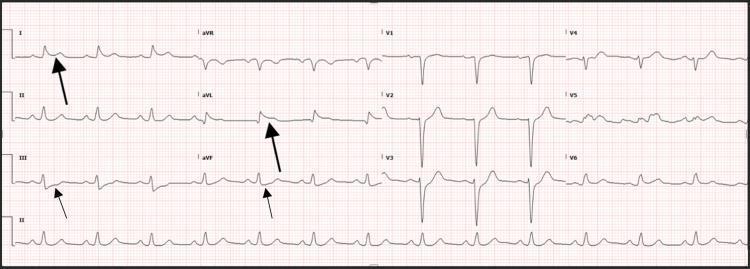
This diagnostic image is a 12-lead electrocardiogram (ECG) displayed on standard grid paper, illustrating findings characteristic of high lateral ST-segment elevation myocardial infarction (STEMI). The primary visual pathology includes significant ST-segment elevation (STE) in the high lateral leads, specifically lead I and lead aVL, marked by large black arrows. This is accompanied by prominent reciprocal ST-segment depression (STD) in the inferior leads, III and aVF, highlighted by small black arrows. The QRS complexes appear relatively narrow without evidence of pathological Q waves at this stage. The ECG serves as an educational tool for identifying early ischemic changes and reciprocal patterns in the setting of acute coronary syndrome (ACS). It is highly relevant for medical training in cardiology, emergency medicine, and critical care, demonstrating the visual cues used to diagnose arterial occlusion (such as the left anterior descending or diagonal branches) in a post-cardiac arrest clinical context.
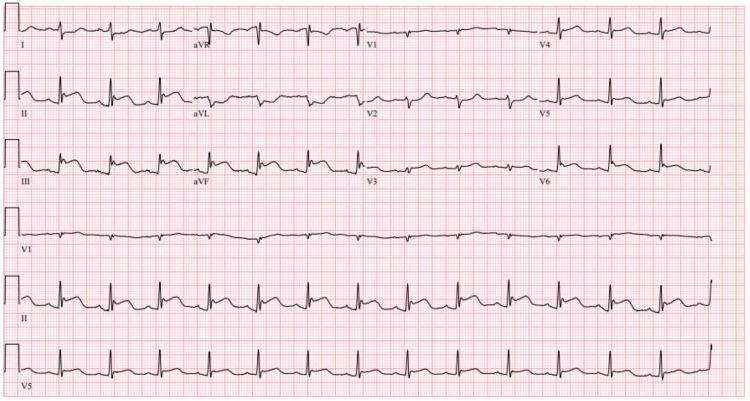
A standard 12-lead electrocardiogram (ECG) printed on standard red grid paper, demonstrating findings consistent with an acute inferior wall myocardial infarction (STEMI). The primary visual pathology includes significant ST-segment elevation in the inferior leads (II, III, and aVF). In lead III, the ST elevation is more pronounced than in lead II, a feature often associated with right ventricular involvement or a right coronary artery (RCA) occlusion. Reciprocal ST-segment depressions are visible in the lateral leads, particularly in lead I and aVL. The precordial leads (V1-V6) show mild ST-segment changes, with some flattening in V2 and V3. The QRS complexes are relatively narrow, and the baseline rhythm appears to be a regular sinus rhythm. This diagnostic image serves as a classic educational example of an ST-elevation myocardial infarction (STEMI) involving the inferior myocardial wall, highlighting the importance of recognizing regional lead patterns and reciprocal changes in emergency cardiology.
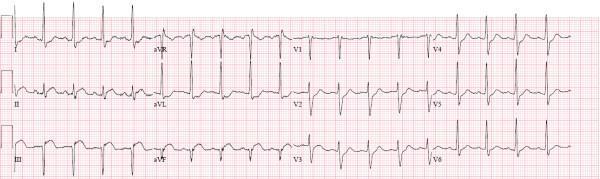
A standard 12-lead electrocardiogram (ECG) demonstrating findings characteristic of an acute inferior wall myocardial infarction (STEMI). The tracing reveals significant pathology in the inferior leads (II, III, and aVF), most notably a 2 mm coved (convex) ST-segment elevation. Lead III and aVF also display prominent pathologic Q waves, indicating evolving myocardial tissue injury or necrosis. Reciprocal ST-segment depression is visible in the high lateral leads (I and aVL), a classic finding in inferior STEMI. The precordial leads (V1-V6) show relatively normal R-wave progression and QRS morphology, though there is subtle ST-segment depression in V2 and V3, which may represent reciprocal changes or posterior extension. This diagnostic image is intended for cardiovascular education, illustrating the key electrocardiographic hallmarks used to identify acute coronary syndromes involving the right coronary artery or left circumflex distributions.
"myocardial infarction"[MeSH Terms] AND management
Myocardial Infarction (MI) - Complete Overview
Definition
Classification
| Type | Mechanism | ECG | Biomarkers |
|---|---|---|---|
| STEMI | Full/transmural occlusion | ST elevation | Elevated troponin |
| NSTEMI | Partial occlusion / subendocardial | No ST elevation | Elevated troponin |
| Type 1 MI | Atherosclerotic plaque rupture + thrombosis | - | - |
| Type 2 MI | Oxygen supply/demand mismatch (demand ischemia) | - | - |
| Unstable Angina | Ischemia, no biomarker elevation | Variable | Normal |
Pathogenesis
- Plaque disruption - An atheromatous plaque is eroded or suddenly disrupted by endothelial injury, intraplaque hemorrhage, or mechanical forces, exposing subendothelial collagen and necrotic plaque contents to blood.
- Platelet activation - Platelets adhere, aggregate, and release thromboxane A₂, ADP, and serotonin - causing further platelet aggregation and vasospasm.
- Coagulation cascade - Tissue factor activates coagulation, adding to the growing thrombus.
- Complete occlusion - Within minutes, the thrombus can completely occlude the coronary artery lumen.
When angiography is performed within 4 hours of symptom onset, coronary thrombosis is demonstrated in almost 90% of cases. By 12-24 hours (without intervention), thrombosis is seen in only 60% - indicating spontaneous lysis occurs in some cases.
- Vasospasm (cocaine, ephedrine)
- Embolism (from AF mural thrombus, infective endocarditis vegetation, prosthetic material)
- Small vessel vasculitis, sickle cell disease, amyloid deposition
Coronary Artery Territories
| Artery | Frequency | Area Infarcted |
|---|---|---|
| LAD | 40-50% | Anterior LV wall (near apex), anterior septum, apex |
| RCA | 30-40% | Inferior/posterior LV wall, posterior septum, RV free wall |
| LCx | 15-20% | Lateral LV wall (except apex) |
- Robbins, Cotran & Kumar Pathologic Basis of Disease
Morphologic Timeline (Gross & Histologic Changes)
| Time | Gross Appearance | Microscopic Changes |
|---|---|---|
| < 12 hrs | Not apparent (TTC stain shows pale zone if >2-3 hrs) | Wavy fibers; subtle nuclear/cytoplasmic changes |
| 12-24 hrs | Reddish-blue discoloration (congestion, extravasated blood) | Coagulative necrosis begins; pyknosis, karyolysis |
| 1-3 days | Pale yellow center, hyperemic border | Neutrophilic infiltration |
| 3-7 days | Hyperemic zone of granulation tissue rims the infarct | Macrophage infiltration, early granulation |
| Weeks | Yellow-tan, soft; progressive fibrosis | Granulation tissue with fibroblasts |
| Months | Dense white fibrous scar | Fibrous scar (electrically silent) |
- Robbins, Cotran & Kumar Pathologic Basis of Disease
ECG Changes
| Defect in Infarcted Cells | Current Flow | ECG Change (leads over infarct) |
|---|---|---|
| Rapid repolarization | Out of infarct | ST elevation |
| Decreased resting membrane potential (K⁺ loss) | Into infarct | TQ depression (seen as ST elevation) |
| Delayed depolarization | Out of infarct | ST elevation |
- Acute: ST elevation (hyperacute T waves)
- Hours-days: ST normalizes, T-wave inversion develops
- Days-weeks: Pathologic Q waves appear (dead myocardium is electrically silent, unable to contribute positivity during systole)
- "Non-Q-wave infarcts" tend to be less severe but carry a high risk of reinfarction
Clinical Features
- Chest pain - severe, crushing, substernal; may radiate to left arm, jaw, neck, back
- Diaphoresis, nausea, vomiting
- Dyspnea (pulmonary congestion)
- Silent MI - more common in diabetics and elderly; no classic chest pain
Cardiac Biomarkers
- Troponin I and T - most sensitive and specific; begin rising within 3-6 hrs, peak at 12-24 hrs, remain elevated 7-14 days
- CK-MB - rises within 4-6 hrs, returns to normal by 48-72 hrs (useful for detecting reinfarction)
- Myoglobin - earliest rise (1-2 hrs) but not cardiac-specific
Management
Immediate (STEMI)
- Reperfusion is the priority - time = myocardium
- Primary PCI (percutaneous coronary intervention): preferred if available within 90 min of first medical contact
- Fibrinolysis (thrombolytics): if timely PCI is unavailable
- Oxygen - supplemental O₂ for hypoxia (SaO₂ < 90%) or respiratory distress
- Nitrates - sublingual or IV for vasodilation and chest pain (avoid in right ventricular MI - reduces preload and can cause catastrophic hypotension)
- Aspirin + P2Y₁₂ inhibitor (e.g., ticagrelor, clopidogrel) - antiplatelet therapy
- Anticoagulation - unfractionated heparin, LMWH, direct thrombin inhibitors, or factor Xa inhibitors
- Beta-blockers - reduce O₂ demand, arrhythmia risk (avoid in cardiogenic shock, hypotension, bradycardia, or reduced EF)
- Morphine/IV opiates - pain control if nitroglycerin insufficient
- Defibrillator immediately available - risk of life-threatening arrhythmias
NSTEMI
-
Intervention can be delayed up to 72 hours in some cases
-
Same antithrombotic and antiplatelet regimen
-
Sabiston Textbook of Surgery; Robbins, Cotran & Kumar
Complications
| Complication | Details |
|---|---|
| Contractile dysfunction | LV failure, hypotension, pulmonary edema; cardiogenic shock in ~10% (requires >40% LV damage) |
| Papillary muscle dysfunction/rupture | Ischemic MR; rupture is a surgical emergency |
| RV infarction | 15-30% of inferior MIs; treat with volume loading, NOT nitrates |
| Arrhythmias | VF (major cause of early death), VT, heart block (especially inferior MI) |
| Pericarditis | Fibrinous pericarditis days 2-4 (early); Dressler's syndrome weeks later (autoimmune) |
| Ventricular free wall rupture | Day 3-7; causes hemopericardium and tamponade |
| Ventricular septal rupture | Sudden new harsh systolic murmur |
| Mural thrombus | Risk of systemic embolism |
| LV aneurysm | Late complication; persistent ST elevation, risk of arrhythmia and thrombus |
| Heart failure / remodeling | Progressive LV dilation and dysfunction |
Recent Evidence (PubMed, 2024-2026)
- Beta-blockers after MI without reduced EF: A 2025 meta-analysis in European Journal of Preventive Cardiology (PMID 39298680) re-evaluated the role of beta-blockers for secondary prevention in patients without heart failure or reduced ejection fraction - a clinically relevant update since current guidelines were established in the pre-reperfusion era.
- Sudden cardiac death post-MI: A 2024 pooled-cohort meta-analysis in European Heart Journal (PMID 39378245) provided updated individual participant data on SCD risk stratification after MI, which may inform ICD implantation decisions.