Ecg
Asking for Preferences
Reading File
Finding Sources
Searching Images
12-lead ECG interpretation diagram
Finding Sources
Finding Sources
Reading File
Finding Sources
Finding Sources
Reading File
Finding Sources
Reading File
Finding Sources
Reading File
Reading File
Searching Images
ECG waveform components P wave QRS T wave labeled diagram
I now have solid textbook content and images. Let me compile a comprehensive guide.
How to Read a 12-Lead ECG — A Systematic Approach
The ECG Paper
Standard ECG paper runs at 25 mm/sec:
- Small square = 1 mm = 0.04 sec
- Large square = 5 mm = 0.2 sec
- Amplitude: 10 mm = 1 mV
The Waveform Components
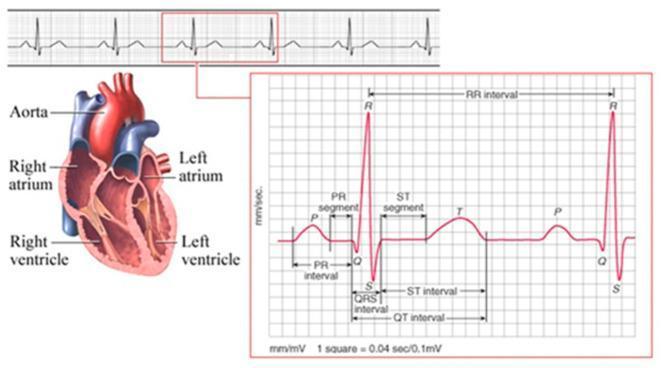
| Wave/Segment | Represents |
|---|---|
| P wave | Atrial depolarization |
| PR interval | AV conduction time (start of P → start of QRS) |
| QRS complex | Ventricular depolarization |
| ST segment | Early ventricular repolarization (J point → T wave) |
| T wave | Ventricular repolarization |
| QT interval | Total ventricular electrical activity |
| U wave | Afterpotentials (prominent in hypokalemia) |
The 8-Step Systematic Approach
Step 1 — Rate
Method: Count the number of large boxes between two R waves, then divide into 300.
- 1 box = 300 bpm | 2 boxes = 150 | 3 boxes = 100 | 4 boxes = 75 | 5 boxes = 60
Normal adult HR: 60–100 bpm
Step 2 — Rhythm
- Sinus rhythm: Every QRS is preceded by a P wave; P wave is upright in leads I and aVF
- Normal respiratory variation in R-R interval (sinus arrhythmia) is expected
- Look for: regular vs. irregular, P before every QRS, QRS after every P
Step 3 — Axis
The QRS axis describes the average direction of ventricular depolarization:
| Axis | Leads I & aVF |
|---|---|
| Normal (−30° to +90°) | Both upright |
| Left axis deviation (LAD) | I upright, aVF negative |
| Right axis deviation (RAD) | I negative, aVF upright |
| Extreme / NW axis | Both negative |
Causes of LAD: LBBB, left anterior fascicular block, inferior MI
Causes of RAD: RVH, RBBB, lateral MI, PE, left posterior fascicular block
Causes of RAD: RVH, RBBB, lateral MI, PE, left posterior fascicular block
Step 4 — Intervals
| Interval | Normal (adults) | Abnormal if... |
|---|---|---|
| PR | 0.12–0.20 sec (3–5 small boxes) | Short = pre-excitation (WPW); Long = heart block |
| QRS | < 0.12 sec (< 3 small boxes) | Wide = BBB, ventricular rhythm, hyperkalemia |
| QTc | ≤ 0.44 sec (males), ≤ 0.46 sec (females) | Prolonged = drugs, electrolytes, channelopathies |
QTc formula (Bazett):
QTc = QT (sec) / √(R-R interval in sec)
Step 5 — P Wave Morphology
- Normal: < 0.12 sec wide, < 2.5 mm tall, upright in I, II, aVF; inverted in aVR
- Broad, notched P (P mitrale) → Left atrial enlargement
- Tall, peaked P (P pulmonale > 2.5 mm in II) → Right atrial enlargement
Step 6 — QRS Morphology
R-wave progression (V1→V6):
- R waves should progressively increase, S waves decrease
- R/S = 1 (transition zone) normally at V3–V4
- Poor R-wave progression → anterior MI or LVH
Bundle Branch Blocks (BBB) — requires QRS ≥ 0.12 sec:
- RBBB: rSR' pattern in V1 ("rabbit ears"), wide S in I & V6 → "W in V1, M in V6" (opposite)
- LBBB: broad, notched R in I, V5, V6; deep QS in V1 → "M in V1, W in V6" (opposite)
Step 7 — ST Segment & T Waves
| Finding | Think of... |
|---|---|
| ST elevation (≥ 1 mm) | STEMI, pericarditis (saddle-shaped, diffuse), Brugada, early repolarization |
| ST depression | NSTEMI, ischemia, digoxin effect ("reverse tick") |
| T wave inversion | Ischemia, LBBB, RVH strain, PE (V1–V4), normal in aVR, V1 |
| Tall peaked T waves | Hyperkalemia, hyperacute STEMI |
| Flat/inverted T waves | Ischemia, hypokalemia, hypothyroidism |
Step 8 — Overall Interpretation
After the above steps, ask:
- Is there a chamber enlargement (atrial or ventricular)?
- Is there evidence of infarction (Q waves, ST/T changes by territory)?
- Is there a conduction abnormality (BBB, hemiblock, WPW, AV block)?
- Are there arrhythmia clues?
12-Lead Anatomy — Which Leads Look Where?
| Territory | Leads | Artery |
|---|---|---|
| Inferior | II, III, aVF | RCA |
| Lateral | I, aVL, V5, V6 | LCx |
| Anterior | V1–V4 | LAD |
| Septal | V1, V2 | LAD (septal perforators) |
| Posterior | Reciprocal changes in V1–V3 (tall R, ST depression) | RCA / LCx |
Quick Memory Aid
"Rate, Rhythm, Axis, Intervals, P waves, QRS, ST-T, Overall"
This systematic approach ensures you never miss a finding. — Harriet Lane Handbook / Braunwald's Heart Disease
Want to go deeper into any specific step — e.g., STEMI patterns, bundle branch blocks, axis interpretation, or a specific arrhythmia?
This is a shared conversation. Sign in to Orris to start your own chat.