
How to read ecg with examples
I'll start by reading the medical library skill, then pull ECG content from the textbooks.
Reading File
Now let me search the library for ECG reading content in parallel with a web search for examples.
Finding Sources
Finding Sources
Searching the Web
how to read ECG step by step examples P wave QRS T wave
Good results. Now let me read the Harrison's ECG section and Tintinalli's ECG section in parallel, plus fetch key ECG images.
Reading File
Reading File
Loading Image
Loading Image
Now let me get the full Harrison's ECG content for details on each parameter, plus fetch the Harrison's ECG figure and search for common ECG pattern examples.
Reading File
Finding Sources
Loading Image
Now let me get the Harrison's normal ECG waves section and bundle branch block images.
Reading File
Loading Image
Now let me get the core ECG waves/intervals section from Harrison's (earlier in the block) and search for MI/atrial fibrillation ECG examples.
Reading File
Finding Sources
Excellent - I have rich content. Let me fetch the Harrison's basic waveform figure and get the MI/ischemia section.
Loading Image
Finding Sources
Finding Sources
I now have all the content I need. Let me read the Harrison's MI/ischemia section quickly and the AF features, then compose the full answer.
Reading File
Reading File
I now have everything needed for a comprehensive, well-illustrated answer. Let me compose it.
How to Read an ECG - A Complete Guide with Examples
The ECG Paper and Calibration
The ECG is recorded on graph paper with 1 mm² boxes. At the standard sweep speed of 25 mm/s:
- Each small square (1 mm) = 40 ms (0.04 s)
- Each large square (5 mm) = 200 ms (0.20 s)
- Voltage: 1 mV = 10 mm (standard calibration)
Always check the calibration marker (a 1 mV square wave pulse) at the start of the ECG before interpreting anything.
The Waveforms - What Each Part Means
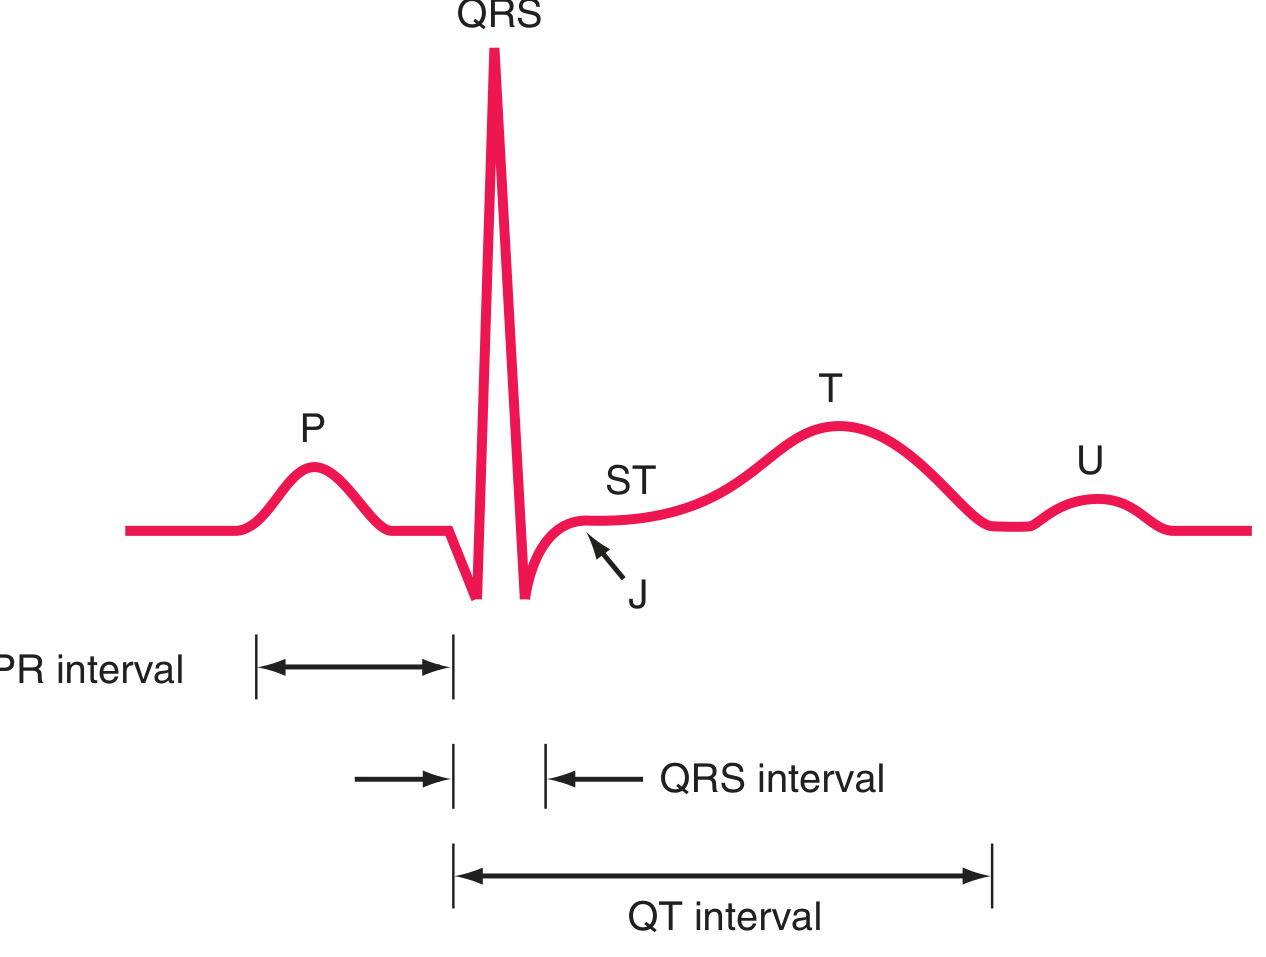
Here is a labeled diagram of a normal ECG complex from Harrison's Principles of Internal Medicine (22nd Ed):
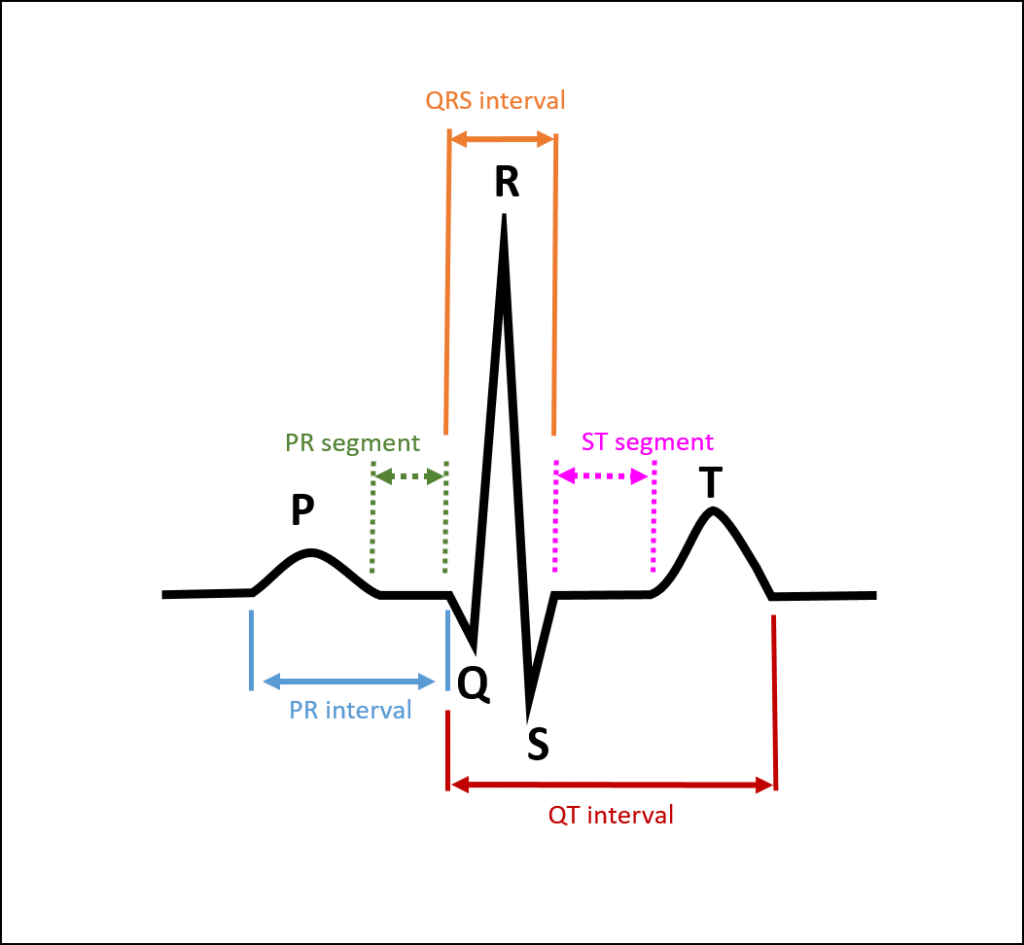
And a clear community diagram showing the same intervals:
| Wave / Segment | What it Represents | Normal Value |
|---|---|---|
| P wave | Atrial depolarization (SA node fires, atria contract) | Duration <120 ms; upright in II, inverted in aVR |
| PR interval | AV conduction time (atria → ventricles via AV node) | 120-200 ms |
| QRS complex | Ventricular depolarization (ventricles contract) | <100-110 ms |
| ST segment | Early ventricular repolarization (plateau phase) | Isoelectric (flat); ±1 mm from baseline |
| T wave | Ventricular repolarization | Upright in most leads; same axis as QRS |
| QT interval | Total ventricular depolarization + repolarization | Corrected QTc: ≤460 ms (women), ≤450 ms (men) |
| U wave | Slow repolarization (Purkinje fibers); seen best in V2-V3 | Small positive deflection after T wave |
The rapid upstroke (phase 0) of the ventricular action potential corresponds to the start of QRS. The plateau (phase 2) corresponds to the isoelectric ST segment. Active repolarization (phase 3) corresponds to the T wave. - Harrison's Principles of Internal Medicine, 22nd Ed
The 12 Leads - What They Look At
A standard ECG has 12 leads - 6 limb leads and 6 precordial (chest) leads:
Limb leads (frontal plane):
- Lead I - Left lateral (RA to LA)
- Lead II - Inferior (RA to LL)
- Lead III - Inferior (LA to LL)
- aVR - Right shoulder (negative of all others; normally has inverted P, QRS, T)
- aVL - Left lateral
- aVF - Inferior (foot)
Precordial leads (horizontal plane):
- V1-V2 - Right heart / septum
- V3-V4 - Anterior wall
- V5-V6 - Lateral wall
Reciprocal changes: Leads facing opposite walls show mirror-image changes. For example, inferior ST elevation (II, III, aVF) often has reciprocal ST depression in anterior leads.
The 14-Step Systematic Approach (Harrison's Framework)
According to Harrison's, these parameters must be analyzed every time in a fixed order to avoid missing findings:
Step 1 - Calibration and Technical Quality
- Confirm 1 mV calibration pulse present
- Check for artifacts, lead reversal (aVR normally has entirely negative deflections), poor contact
- Identify lead placement errors (e.g., limb lead reversal causes unexpected P wave morphology)
Step 2 - Rhythm
Ask: Is the rhythm regular or irregular?
- Regular: Count R-R intervals - they should be equal
- Irregular: Completely irregular (atrial fibrillation) vs. regularly irregular (e.g., Wenckebach block)
Step 3 - Heart Rate
Three methods:
- Large square method (regular rhythms): Count large squares between two R waves, divide 300 by that number. (e.g., 4 large squares between R waves = 300/4 = 75 bpm)
- Small square method (precise): Divide 1500 by the number of small squares between R waves
- 6-second strip method (irregular rhythms): Count R waves in a 30-large-square strip (= 6 sec), multiply by 10
| Rate | Interpretation |
|---|---|
| 60-100 bpm | Normal |
| >100 bpm | Tachycardia |
| <60 bpm | Bradycardia |
Step 4 - PR Interval
Normal: 120-200 ms (3-5 small squares)
- Short PR (<120 ms): pre-excitation (WPW), junctional rhythm
- Long PR (>200 ms): first-degree AV block
- Progressive PR lengthening then dropped beat: Mobitz type I (Wenckebach)
- Fixed PR with occasional dropped beats: Mobitz type II
- No relationship between P and QRS: complete (3rd degree) heart block
Step 5 - QRS Interval
Normal: ≤100-110 ms (≤2.5 small squares)
- Narrow QRS (<100 ms): supraventricular origin
- Wide QRS (≥120 ms): bundle branch block, ventricular rhythm, pacemaker, WPW, hyperkalemia
Step 6 - QT/QTc Interval
- Measured from start of QRS to end of T wave
- Normal upper limits: QTc ≤460 ms (women), ≤450 ms (men)
- Prolonged QT: risk of torsades de pointes (drugs, electrolyte disturbance, congenital channelopathy)
- Short QT: hypercalcemia, digoxin effect, short QT syndrome
Step 7 - Mean QRS Axis
Determined by checking which leads have the tallest and most isoelectric QRS:
- Normal axis: -30° to +90° (Lead I positive, aVF positive)
- Left axis deviation (<-30°): left anterior fascicular block, LBBB, inferior MI
- Right axis deviation (>+90°): right ventricular hypertrophy, RBBB, lateral MI, pulmonary embolism
Quick trick: If Lead I is positive and aVF is positive → normal axis. If Lead I positive and aVF negative → left axis. If Lead I negative and aVF positive → right axis.
Step 8 - P Waves
- Should be present, upright in Lead II, inverted in aVR
- Absent P waves + chaotic baseline → atrial fibrillation
- Biphasic P in V1 (positive then negative deflection, with wide negative portion) → left atrial enlargement (P mitrale)
- Tall peaked P >2.5 mm in II → right atrial enlargement (P pulmonale)
- Saw-tooth flutter waves at ~300/min → atrial flutter (usually 2:1 block giving ventricular rate ~150)
Step 9 - QRS Voltages
- Increased voltage: left or right ventricular hypertrophy (e.g., SV1 + RV5 >35 mm = LVH by Sokolow-Lyon)
- Decreased voltage (<5 mm in limb leads, <10 mm in precordial leads): pericardial effusion, obesity, COPD, hypothyroidism
Step 10 - R-wave Progression (Precordial Leads)
Normal: R wave becomes progressively taller from V1 to V5-V6 (R/S ratio flips from predominantly negative in V1 to predominantly positive in V5-V6)
- Poor R-wave progression (R stays small through V3-V4): anterior MI, LBBB, cardiomyopathy
- Reverse R-wave progression: suggests anterior wall disease
Step 11 - Pathological Q Waves
A Q wave is pathological if it is:
- Width >40 ms (1 small square), OR
- Depth >1/4 the height of the R wave in the same lead
- Pathological Q waves in II, III, aVF → inferior MI
- Pathological Q waves in V1-V4 → anterior MI
- Note: small q waves in lateral leads (I, aVL, V5-V6) are normal septal depolarization
Step 12 - ST Segments
Measured at the J point (junction between QRS and ST segment):
- ST elevation (≥1 mm in limb leads, ≥2 mm in precordial leads) → acute STEMI, pericarditis (diffuse saddle-shaped), Prinzmetal angina, LV aneurysm
- ST depression → subendocardial ischemia, NSTEMI, digoxin effect (reverse tick pattern), LVH strain
From Harrison's: "When the acute ischemia is transmural, the ST vector usually is shifted in the direction of the outer (epicardial) layers, producing ST elevations and sometimes, in the earliest stages of ischemia, tall, positive hyperacute T waves over the ischemic zone. With ischemia confined primarily to the subendocardium, the ST vector typically shifts toward the subendocardium and ventricular cavity, so that overlying anterior precordial leads show ST depression."
Localizing ST changes:
| Leads with ST elevation | Territory | Artery |
|---|---|---|
| V1-V4 | Anterior | LAD |
| II, III, aVF | Inferior | RCA (or circumflex) |
| I, aVL, V5-V6 | Lateral | Circumflex |
| V1-V3 (depression) | Posterior | PDA |
Step 13 - T Waves
- Normally upright in I, II, V3-V6; inverted in aVR; may be inverted in III and V1-V2
- Hyperacute T waves (tall, peaked): earliest sign of acute MI
- T wave inversion: ischemia/NSTEMI, RBBB (in V1-V2), LVH strain, PE (V1-V4), Wellens syndrome
- Peaked, tent-shaped T waves in precordial leads: hyperkalemia
Step 14 - U Waves
- Small positive deflection after T wave, best seen in V2-V3
- Prominent U waves: hypokalemia, bradycardia, drugs (amiodarone, quinidine)
- Negative U waves: LVH, ischemia
Common ECG Patterns with Examples
1. Normal Sinus Rhythm
- Regular P waves, each followed by QRS at fixed PR interval
- Rate 60-100 bpm, narrow QRS, upright P in II
2. Atrial Fibrillation
ECG hallmarks (from Tintinalli's Emergency Medicine):
- Absence of discernible P waves with flat or chaotic isoelectric baseline
- Narrow QRS complexes (unless pre-existing bundle branch block)
- Irregularly irregular ventricular rhythm
3. Bundle Branch Blocks
From Harrison's - comparison of RBBB vs LBBB in V1 and V6:
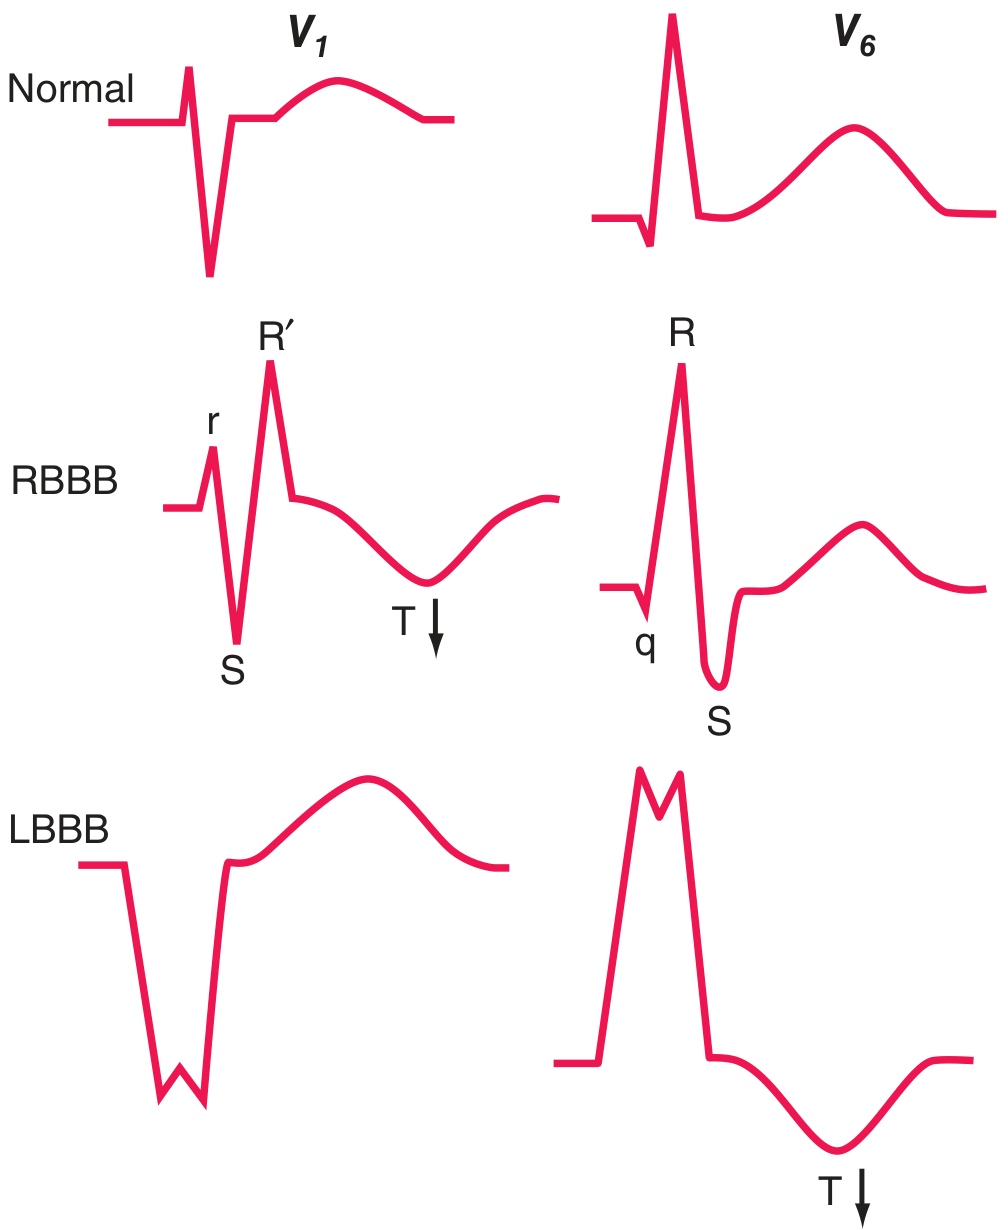
- RBBB: Wide QRS (≥120 ms), rSR' ("rabbit ears") in V1, wide S wave in V5-V6; T wave inverted in V1-V3. Secondary ST-T changes are discordant (opposite to QRS terminal deflection).
- LBBB: Wide QRS, broad negative QS complex in V1, tall broad R in V5-V6, no septal Q waves. Secondary T wave inversion in lateral leads. LBBB often marks underlying disease: CAD, hypertensive heart disease, aortic valve disease, or cardiomyopathy.
4. Acute STEMI - 12-lead example
The 12-lead ECG below (from Harrison's) shows electrical alternans and pericardial effusion features with sinus tachycardia and low-voltage:
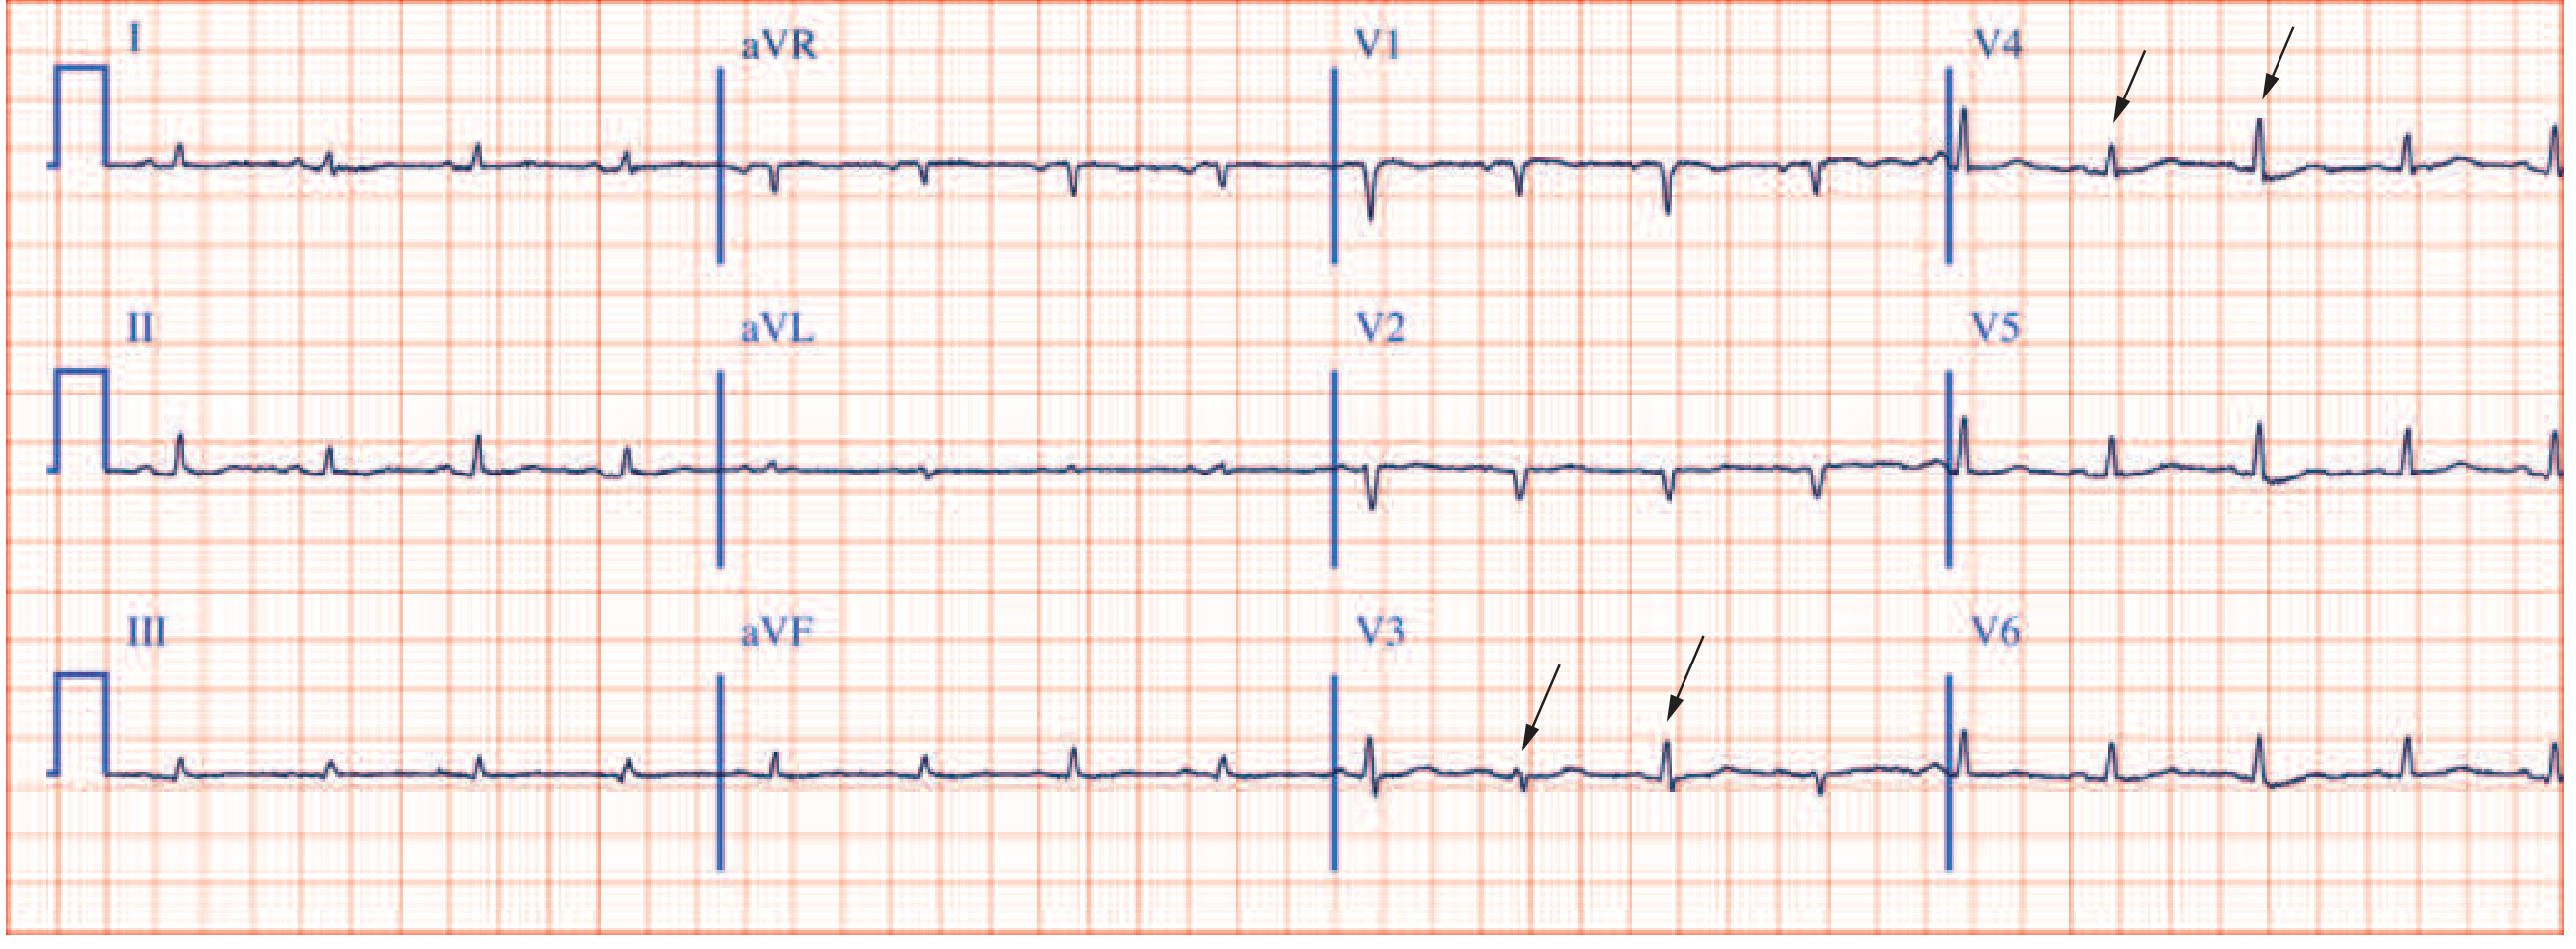
For a typical STEMI, look for:
- Hyperacute (tall peaked) T waves - earliest sign (minutes)
- ST elevation in the territory of the affected artery
- Reciprocal ST depression in mirror leads
- Evolving Q waves (hours to days)
- T wave inversions (hours to days)
Quick Reference Summary Card
| Feature | Normal | Abnormal - Think |
|---|---|---|
| Rate | 60-100 bpm | Tachy/Brady |
| PR interval | 120-200 ms | Long = AV block; Short = WPW |
| QRS duration | <110 ms | Wide = BBB, V-rhythm, hyperkalemia |
| QTc | ≤460 ms (F), ≤450 ms (M) | Long = torsades risk |
| P waves | 1 before every QRS | Absent = AF; Multiple per QRS = flutter |
| ST segment | Flat (isoelectric) | Elevation = STEMI/pericarditis; Depression = ischemia |
| T waves | Upright in I, II, V3-V6 | Inversion = ischemia, BBB, PE |
| Q waves | Small septal q in lateral leads | Wide/deep = old MI |
Tips for Learning ECG Interpretation
- Always use a systematic approach - the mistakes in ECG interpretation are almost always errors of omission. Go through all 14 parameters every time. - Harrison's Principles, 22nd Ed
- Compare with previous ECGs - a change is often more important than an isolated finding
- Correlate with clinical context - age, sex, symptoms, and medication history all affect interpretation
- Practice on real tracings - the ECG Wave-Maven at Harvard BIDMC offers a free self-assessment bank
- Computerized ECG reports have major limitations - always review the tracing yourself; do not rely solely on the machine interpretation
With 10 disease examples in hinglish
Finding Sources
Finding Sources
Finding Sources
Finding Sources
Finding Sources
Finding Sources
Reading File
Finding Sources
Finding Sources
Finding Sources
Finding Sources
I now have all the clinical data needed. Let me write a comprehensive, engaging Hinglish response with 10 disease examples.
🫀 ECG Reading - 10 Bimariyon ke Saath (Hinglish Guide)
Yaar, ECG padhna ek skill hai jo practice se aata hai. Chaliye ek-ek karke 10 common diseases ke ECG patterns samjhte hain - bilkul simple Hindi-English mix mein!
🔑 Pehle Basic Yaad Karo (Quick Recap)
| Wave | Matlab |
|---|---|
| P wave | Atria contract ho rahe hain (SA node ne signal diya) |
| PR interval | Signal atria se ventricle tak pahuncha (120-200 ms normal) |
| QRS complex | Ventricles contract ho rahe hain (<110 ms normal) |
| ST segment | Ventricles relax hone se pehle ka phase (isoelectric hona chahiye) |
| T wave | Ventricles repolarize ho rahe hain |
| QT interval | Poora ventricular cycle (<450 ms men, <460 ms women) |
🔟 10 Bimariyon ke ECG Patterns
🔴 Disease 1 - Acute STEMI (Heart Attack)
"Dil ka dौरा"
Kya hota hai: Coronary artery block ho jaati hai. Blood supply band. Myocardium mar raha hai.
ECG par kya dikhega:
- Hyperacute T waves - sabse pehle tall, peaked T waves aate hain (yeh earliest sign hai, sirf minutes mein)
- ST elevation - affected territory mein ST upar uth jaata hai (≥1 mm limb leads, ≥2 mm precordial leads)
- Reciprocal ST depression - opposite leads mein mirror image ST depression
- Pathological Q waves - hours se days mein develop hote hain (necrosis ka sign - permanent!)
Territory kaise identify karein:
| Kahan ST elevation | Kaunsa area | Kaunsi artery |
|---|---|---|
| V1-V4 | Anterior wall | LAD (Left Anterior Descending) |
| II, III, aVF | Inferior wall | RCA (Right Coronary Artery) |
| I, aVL, V5-V6 | Lateral wall | Circumflex |
Yaad rakho: Inferior MI (II, III, aVF mein ST elevation) ke saath aksar V1-V3 mein reciprocal ST depression bhi hoti hai. - Harrison's Principles, 22nd Ed
🟠 Disease 2 - Atrial Fibrillation (AF)
"Dil ki bhadakti dhadkan"
Kya hota hai: SA node sahi se kaam nahi karta. Atria chaotically fire karte hain ~400-600 bpm. AV node randomly kuch signals pass karta hai.
ECG par kya dikhega (Tintinalli's teen features):
- P waves GAYAB - flat ya chaotic baseline dikhega (fibrillatory waves)
- Narrow QRS - normal hoga (jab tak BBB na ho)
- Irregularly Irregular rhythm - yeh sabse important hai! R-R intervals KABHI equal nahi honge
Trick: Agar rhythm bilkul unpredictable lag rahi ho - sochna AF hai jab tak prove na ho jaye kuch aur.
Clinical danger: Blood clot ban sakta hai atria mein → stroke ka risk! Isliye anticoagulation dete hain. - Tintinalli's Emergency Medicine
🟡 Disease 3 - Atrial Flutter
"Dil ka kaanpna"
Kya hota hai: Atria ek circuit mein ghoomta rehta hai ~300 bpm. AV node 2:1 ya 3:1 block karta hai.
ECG par kya dikhega:
- Sawtooth (aari jaisi) flutter waves - leads II, III, aVF mein clearly dikhti hain ~300/min
- Regular ventricular rate - usually 150 bpm (2:1 block), ya 100 bpm (3:1 block)
- Narrow QRS normally
Trick: Agar rate exactly 150 bpm ho aur regular ho → pehle atrial flutter rule out karo! Lead II ya aVF mein sawtooth pattern dhundho. Carotid sinus massage se AV block badha ke flutter waves expose kar sakte ho.
🟢 Disease 4 - Ventricular Tachycardia (VT)
"Khatarnak tej dhadkan"
Kya hota hai: Ventricle se abnormal rapid rhythm start hoti hai. Medical emergency hai!
ECG par kya dikhega:
- Wide QRS tachycardia - QRS ≥120 ms, rate >100 bpm
- AV dissociation - P waves aur QRS ka koi rishta nahi (dono apni marzi se chal rahe hain)
- Fusion beats - kabhi kabhi normal aur abnormal beat fuse ho jaate hain
- Capture beats - kabhi kabhi SA node ek normal narrow complex nikalta hai
Goldman-Cecil ke anusar: Wide QRS tachycardia mein 12-lead ECG supraventricular tachycardia (with aberrancy) aur ventricular tachycardia distinguish karne mein help karta hai.
Golden rule: Wide complex tachycardia ko VT maano jab tak prove na ho jaye kuch aur - galti se VT treat nahi kiya toh patient stable rahega; galti se SVT treat kiya (kuch drugs se) toh patient mein VF ho sakti hai!
🔵 Disease 5 - Complete Heart Block (3rd Degree AV Block)
"Dil ke do hisse alag alag chal rahe hain"
Kya hota hai: Atria aur ventricles ke beech signal BILKUL pass nahi hota. Dono apni speed se chal rahe hain.
ECG par kya dikhega:
- P waves aur QRS ka koi relationship NAHI - P wave kisi QRS ke pehle, beech mein, baad mein - kahi bhi ho sakta hai
- Atrial rate - normal ya fast (60-100 ya zyada)
- Ventricular rate - bahut slow (20-40 bpm) - yeh escape rhythm hai
- Wide QRS - agar ventricular escape rhythm ho
Danger: Rate itna slow ki blood pressure gir jaata hai, syncope ho sakta hai, ya patient unconscious. Pacemaker lagana pad sakta hai!
🟣 Disease 6 - Hyperkalemia (High Potassium)
"Khoon mein potassium bahut zyada"
Kya hota hai: Potassium >5 mEq/L. Kidney failure, ACE inhibitors ya crash injury se ho sakta hai.
ECG par kya dikhega (progressive changes with rising K+):
| Potassium Level | ECG Change |
|---|---|
| 5.5-6.5 mEq/L | Tall, peaked, symmetric T waves (sabse pehla sign) |
| 6.5-7.5 mEq/L | P waves chote ya gayab + PR interval lamba |
| >7 mEq/L | Wide QRS complex + ST changes |
| Severe | "Sine wave" pattern - medical emergency, cardiac arrest aane wala hai! |
Miller's Anesthesia ke anusar: "The 'sine wave' is a sign of impending cardiac arrest."
Yaad rakho: Hyperkalemia ek "great mimicker" hai - wide QRS deta hai jo VT jaisa lag sakta hai. Isliye electrolytes check karo!
🟤 Disease 7 - Pericarditis (Pericardium ki sujan)
"Dil ke ghilaf ki sujan"
Kya hota hai: Pericardium (dil ka outer layer) inflamed ho jaata hai - viral infection, TB, ya autoimmune.
ECG par kya dikhega (4 stages hoti hain):
- Stage 1: Diffuse ST elevation (STEMI se alag - yahan SAARE leads mein, saddle-shaped hoti hai) + PR depression (almost pathognomonic!)
- Stage 2: ST aur PR normalize ho jaate hain
- Stage 3: T wave inversions
- Stage 4: ECG normal ho jaata hai
STEMI se kaise alag karein:
| Feature | STEMI | Pericarditis |
|---|---|---|
| ST elevation location | Specific territory | Diffuse (almost all leads) |
| Reciprocal changes | Haan | Nahi (except aVR mein) |
| PR depression | Nahi | Haan ✓ |
| Q waves | Develop hote hain | Nahi hote |
Goldman-Cecil ke anusar: "Acute pericarditis mein ECG typically diffuse ST elevation dikhaata hai PR depression ke saath."
🔶 Disease 8 - Wolff-Parkinson-White (WPW)
"Dil ka short-circuit"
Kya hota hai: Atria aur ventricle ke beech ek extra abnormal pathway hota hai (Bundle of Kent). Signal normal AV node se PEHLE ventricle mein pahunch jaata hai.
ECG par kya dikhega (classic triad):
- Short PR interval - <120 ms (kyunki AV node ka delay bypass ho gaya)
- Delta wave - QRS ka slurred, slow upstroke - pre-excitation ka sign
- Wide QRS - kyunki ventricle abnormal tarike se activate ho raha hai
Danger: Agar AF ho jaaye WPW mein toh bahut rapid ventricular rate (>300 bpm) ho sakta hai → Ventricular Fibrillation → Death! Isliye WPW mein AV node blockers (digoxin, verapamil, adenosine) BILKUL mat do!
🔷 Disease 9 - Left Ventricular Hypertrophy (LVH)
"Dil ka baayaan chamber mota ho gaya"
Kya hota hai: Chronic hypertension, aortic stenosis, ya cardiomyopathy se left ventricle ki wall thick ho jaati hai.
ECG par kya dikhega:
- Tall R waves in left-sided leads (V5, V6, I, aVL)
- Deep S waves in right-sided leads (V1, V2)
- Sokolow-Lyon Criteria: S wave V1 + R wave V5 >35 mm → LVH
- "Strain pattern" - ST depression + T wave inversion in lateral leads (I, aVL, V5-V6)
- Left axis deviation aksar saath mein hoti hai
Clinical context: Hypertensive patient mein LVH ECG par dikhna matlab end-organ damage ho chuka hai - BP management aur tight karna hai.
⚫ Disease 10 - Pulmonary Embolism (PE)
"Phephadoon mein khoon ka thakka"
Kya hota hai: Lungs ki arteries mein clot jam jaata hai. Right heart par sudden pressure increase.
ECG par kya dikhega:
- Sinus tachycardia - sabse common finding (90% cases mein)
- S1Q3T3 pattern (classic but sirf 20% mein milta hai):
- S wave in Lead I (deep)
- Q wave in Lead III
- T wave inversion in Lead III
- Right heart strain signs:
- T wave inversions in V1-V4
- New RBBB
- Right axis deviation
- P pulmonale (peaked P >2.5mm in II)
Important: ECG PE mein normal bhi ho sakta hai! Normal ECG PE rule out nahi karta. CT pulmonary angiography (CTPA) gold standard hai.
🧠 Ek Saath Yaad Karne ka Shortcut
STEMI = ST elevation + Q waves (territory specific)
AF = Irregularly irregular + no P waves
Flutter = Sawtooth at 300/min + regular ventricular rate
VT = Wide QRS + fast rate + AV dissociation
3° Block = P aur QRS ka koi rishta nahi
Hyperkalemia = Peaked T → P gayab → Wide QRS → Sine wave
Pericarditis = Diffuse ST elevation + PR depression
WPW = Short PR + Delta wave + Wide QRS
LVH = Tall R in V5 + Deep S in V1 (>35mm)
PE = Tachycardia + S1Q3T3 + right heart strain
💡 Pro Tips - ECG Padhte Waqt
- Systematic rehna - kabhi bhi koi ek cheez dhundhte hue baaki bhool mat jao. Harrison's ke anusar, "Most ECG mistakes are errors of omission" - matlab kuch miss kar diya.
- Clinical context - 50 saal ka diabetic chest pain ke saath aaya toh ECG alag nazar se dekho vs 20 saal ke student ki routine ECG
- Compare karo - purani ECG se compare karna bahut important hai - change is often more significant than an isolated finding
- Machine pe blind trust mat karo - computerized ECG reports mein major limitations hoti hain, khud padhna seekho!
- Practice karo - Harvard ECG Wave-Maven pe free ECG cases practice kar sakte ho
Sources: Harrison's Principles of Internal Medicine 22nd Ed (2025) | Tintinalli's Emergency Medicine | Goldman-Cecil Medicine | Miller's Anesthesia | Braunwald's Heart Disease
With image ke sath samjhayo
Bilkul! Images ke saath samjhaata hoon. Pehle textbooks se ECG images dhundta hoon.
Finding Sources
Finding Sources
Finding Sources
Reading File
Reading File
Reading File
Good - found image URLs. Now let me read more sections for VT, WPW, Hyperkalemia, Pericarditis, Heart Block, LVH, PE images in parallel.
Reading File
Reading File
Reading File
Good. Now let me find the pericarditis ECG image, STEMI image, hyperkalemia image, heart block image, and LVH image in parallel.
Finding Sources
Finding Sources
Finding Sources
Reading File
Reading File
Reading File
Excellent! I have image URLs for all key conditions. Now let me find STEMI ECG image and hyperkalemia ECG image, then fetch all images in parallel.
Finding Sources
Finding Sources
Reading File
Reading File
I now have all image URLs. Let me fetch all 10 ECG images in parallel now.
Loading Image
Loading Image
Loading Image
Loading Image
Loading Image
Now let me fetch the remaining 5 images - pericarditis, hyperkalemia, heart block, RBBB/LBBB, and torsades/long QT.
Loading Image
Loading Image
Loading Image
Loading Image
Loading Image
All 10 images fetched. Now I have everything needed to write the complete guide.---
🫀 ECG - 10 Bimariyon ke Saath Images ke Saath (Hinglish Guide)
🔴 Disease 1 - Acute Inferior STEMI (Heart Attack)
"Dil ka dourra - neeche wali wall"
Kya hota hai: RCA (Right Coronary Artery) block ho gayi. Khoon nahi pahuncha. Dil ki inferior wall mar rahi hai. EMERGENCY!
ECG par kya dhundho:
- ST elevation - leads II, III, aVF mein upar uthega (≥1 mm)
- Reciprocal ST depression - leads I, aVL mein mirror image neeche jaayega
- Hyperacute T waves - sabse pehle tall, peaked T waves aate hain
- Q waves - kuch ghanton mein develop hote hain (necrosis = permanent damage ka sign)
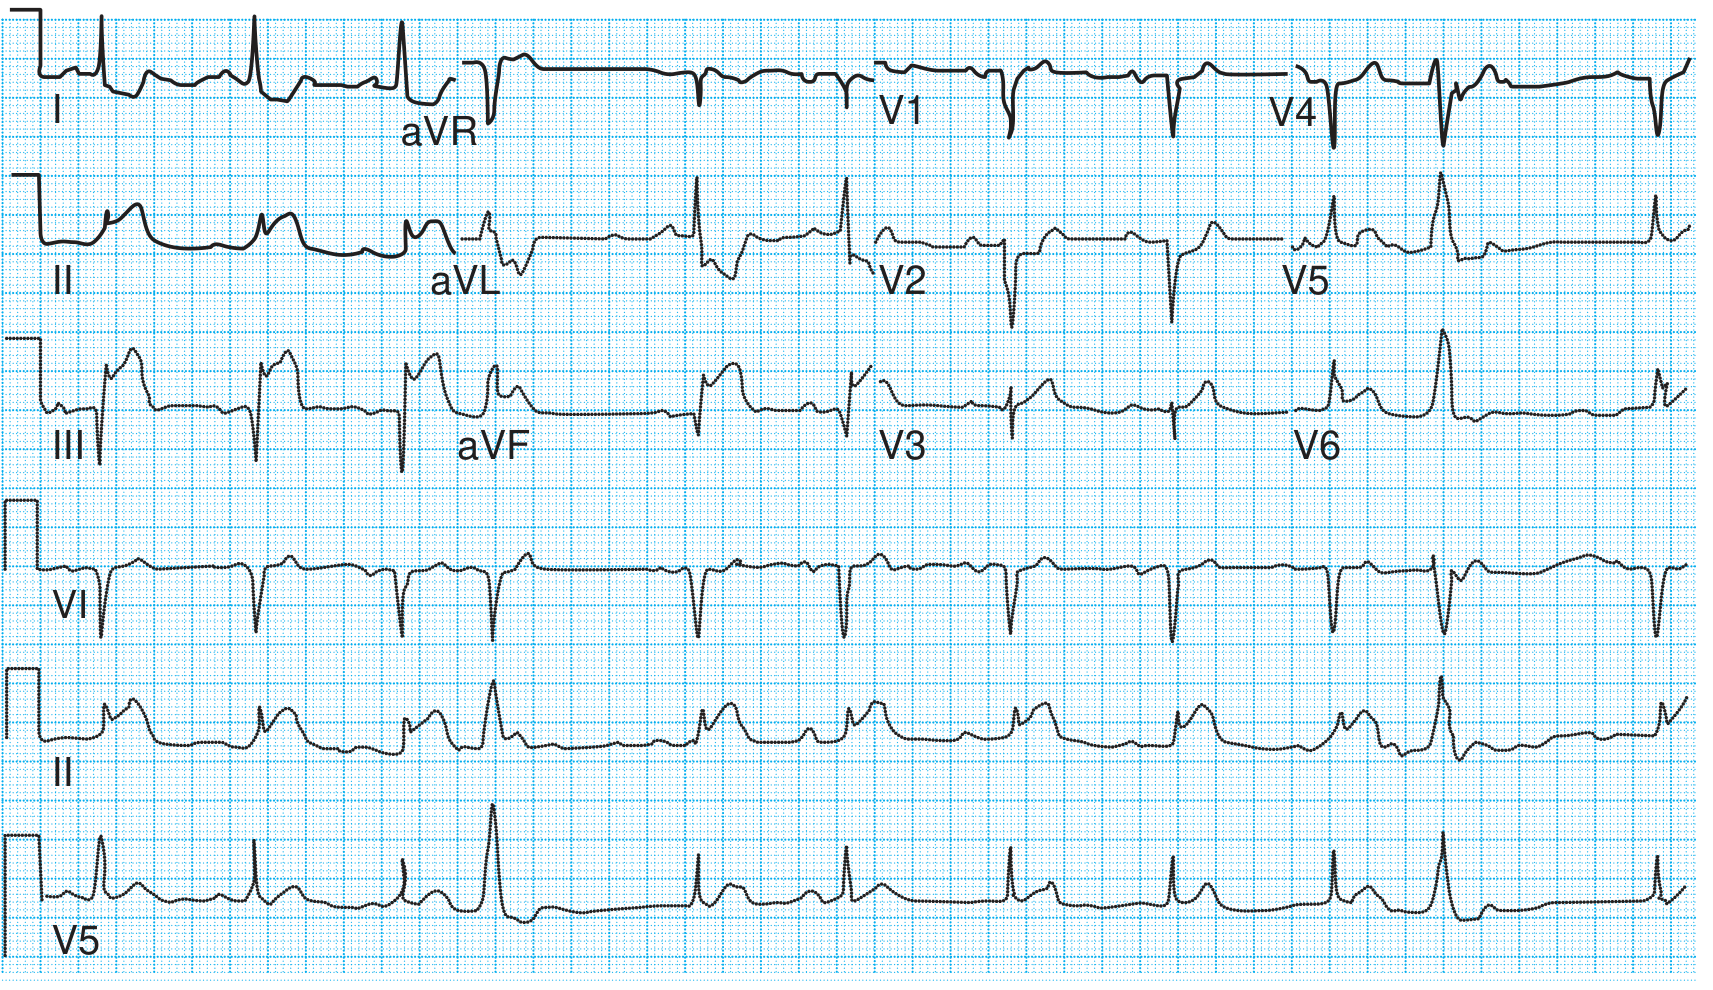
Image mein dekho: II, III, aVF mein ST utha hua hai - yeh inferior wall MI hai. Leads I aur aVL mein ST neeche gaya (reciprocal changes). - Textbook of Family Medicine, 9th Ed
Yaad rakho - Territory map:
| ST elevation kahaan | Wall | Artery |
|---|---|---|
| V1-V4 | Anterior | LAD |
| II, III, aVF | Inferior | RCA |
| I, aVL, V5-V6 | Lateral | Circumflex |
🟠 Disease 2 - Atrial Fibrillation (AF)
"Dil ki chaotic dhadkan - bhadakna"
Kya hota hai: Atria 400-600 bpm pe chaotically fire kar raha hai. AV node randomly kuch signals pass karta hai ventricles tak. Dil ki "atri" wali compartment kaanp rahi hai.
ECG par kya dhundho (Teen golden signs):
- P waves GAYAB - chaotic, wavy ya flat baseline (fibrillatory waves) dikhega
- Narrow QRS - normal width (jab tak BBB ya WPW na ho)
- Irregularly Irregular rhythm - R-R interval KABHI equal nahi - yeh sabse important sign hai!
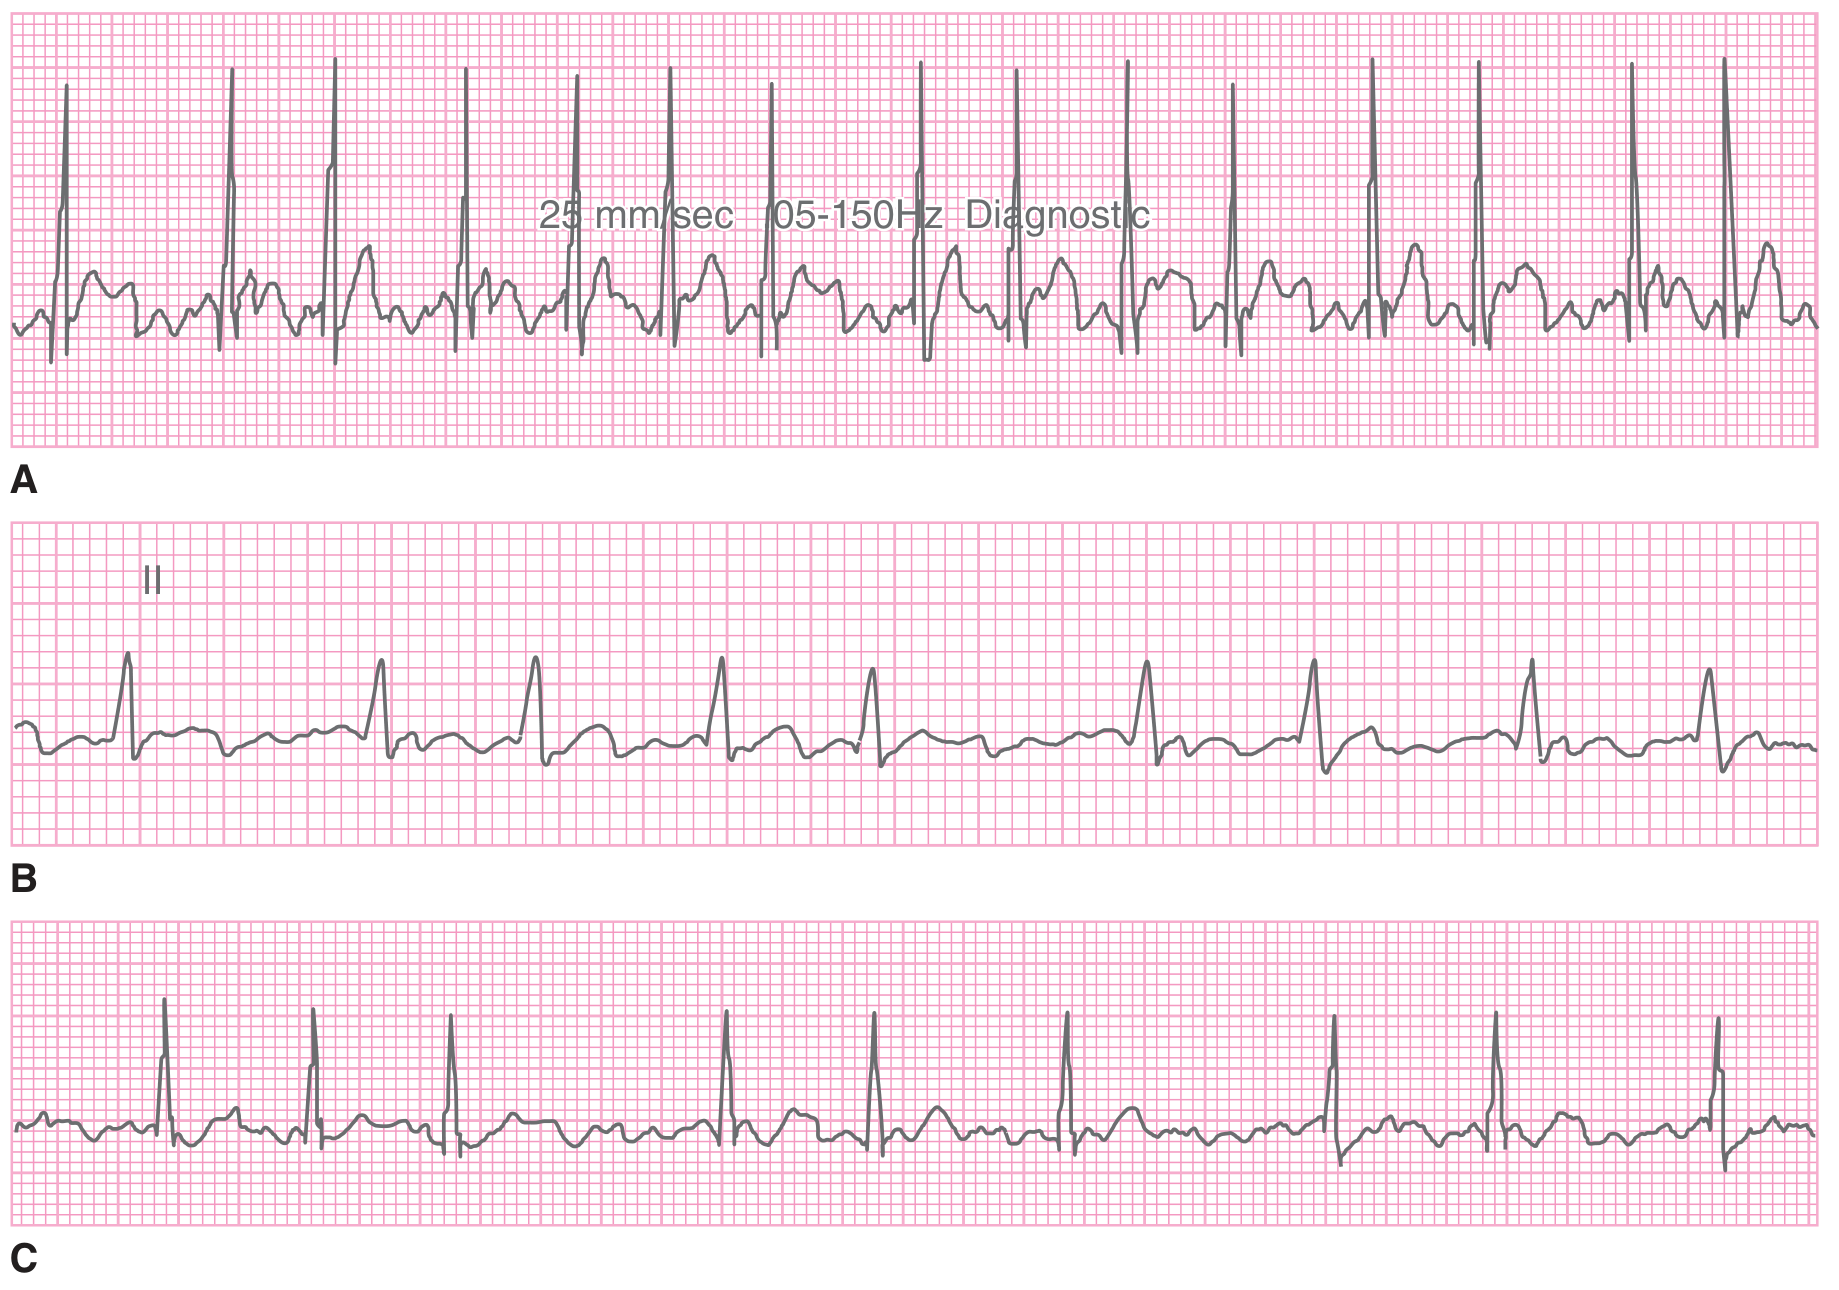
Image mein dekho: Teeno strips (A, B, C) mein P waves nahi hain. Beats ka pattern completely irregular hai - kabhi paas kabhi door. Yahi AF ki pehchaan hai. - Tintinalli's Emergency Medicine
Danger: Atria mein clot ban sakta hai → stroke ho sakta hai! CHA2DS2-VASc score se risk assess karo, anticoagulation do.
🟡 Disease 3 - Atrial Flutter aur AF Comparison
"Sawtooth wali dhadkan"
Kya hota hai: Atria ek loop mein ghoomta hai ~300/min. AV node usually 2:1 block karta hai.
ECG par kya dhundho:
- Sawtooth flutter waves - II, III, aVF mein saw ki tarah pattern - ~300/min
- Regular ventricular rate - usually 150 bpm (2:1 block)
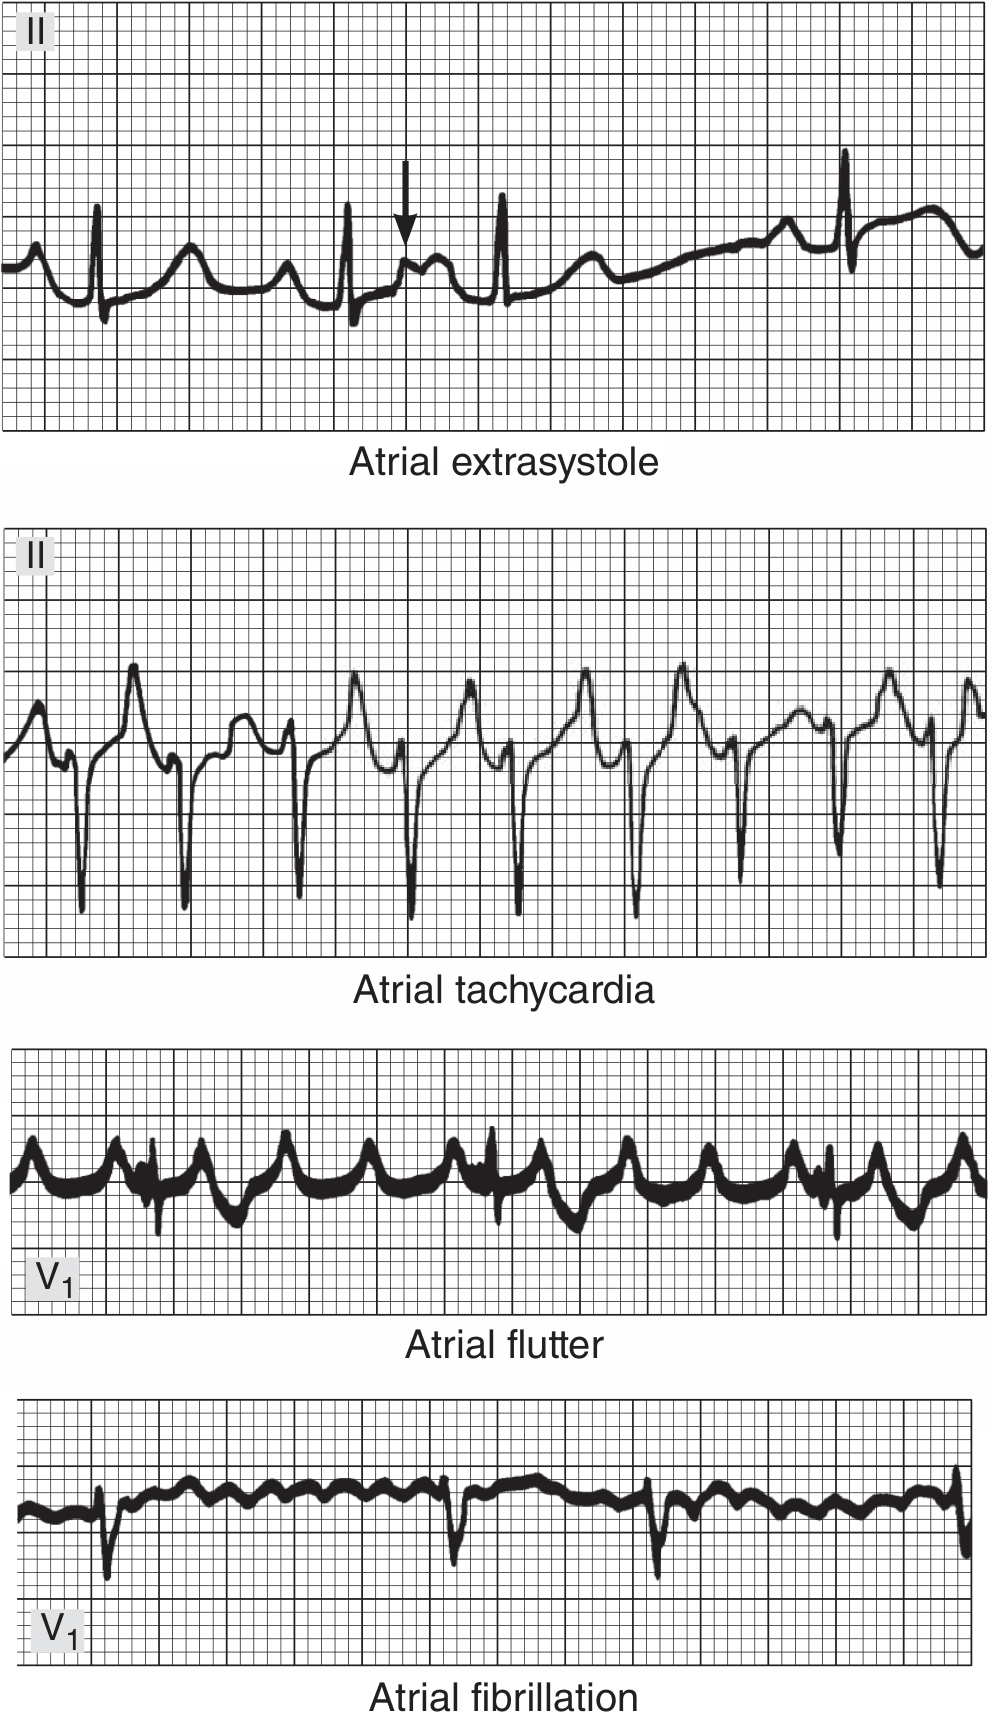
Image mein dekho (upar se neeche):
- Row 1 - Atrial extrasystole: ek early beat aa gayi (arrow se mark hai)
- Row 2 - Atrial tachycardia: fast but regular P waves hain
- Row 3 - Atrial flutter (V1): Classic sawtooth pattern - aari ki tarah teeth dikh rahi hain
- Row 4 - Atrial fibrillation (V1): Chaotic baseline, koi P wave nahi, completely irregular
Trick: Agar rate exactly 150 bpm ho aur regular ho → pehle atrial flutter 2:1 socho! - Ganong's Review of Medical Physiology
🟢 Disease 4 - Ventricular Tachycardia (VT) aur Torsades
"Ventricle se nikal rahi khatarnak tez dhadkan"
Kya hota hai: Ventricle se hi abnormal rapid rhythm shuru hoti hai. Cardiac output gir jaata hai. Life-threatening emergency!
ECG par kya dhundho:
- Wide QRS tachycardia - QRS ≥120 ms + fast rate >100 bpm
- AV dissociation - P waves aur QRS ka koi rishta nahi, dono apni marzi se chal rahe hain
- Regular, monomorphic - ek jaise wide complexes bar bar
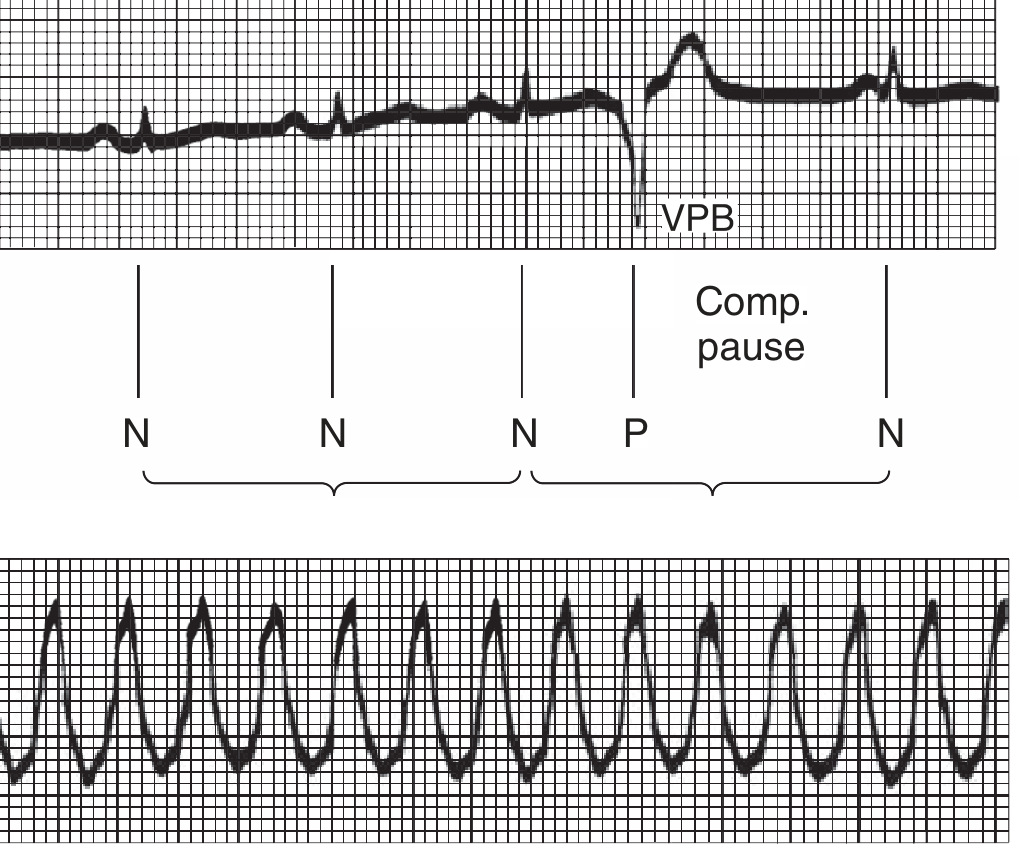
Image mein dekho:
- Upar wali strip: Normal beats (N), phir ek VPB (P) jo bilkul alag aur wide hai, phir compensatory pause
- Neeche wali strip: Ventricular Tachycardia - rapid, wide, regular complexes har jagah
Special type - Torsades de Pointes:
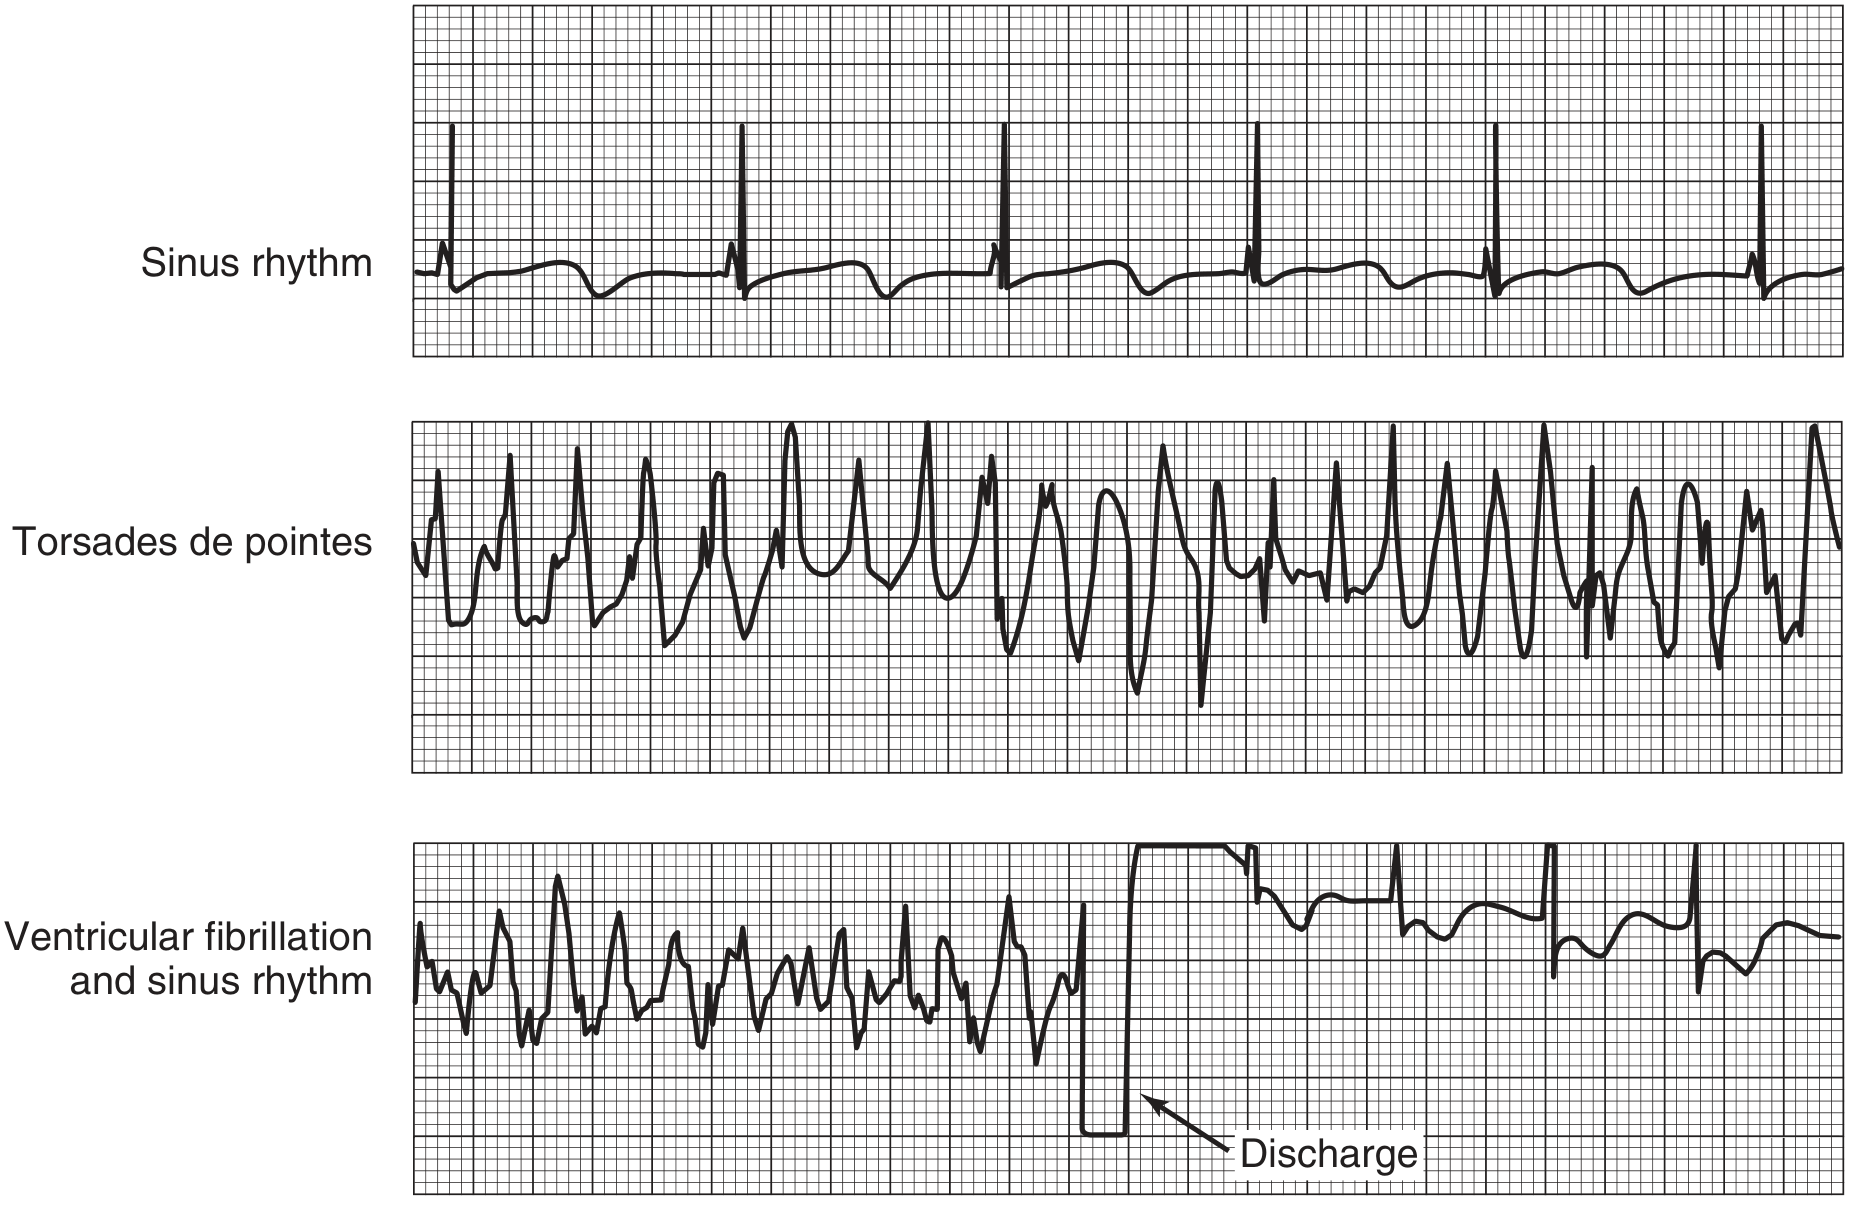
Image mein dekho:
- Top: Normal sinus rhythm - seedhe beats
- Middle: Torsades de Pointes - QRS ka shape ghoomta hai, kabhi upar kabhi neeche (spindle pattern) - yeh Long QT ka complication hai
- Bottom: Ventricular Fibrillation - complete chaos, phir defibrillator ka discharge aur sinus rhythm wapas
Golden rule: Wide complex tachycardia = VT samjho jab tak prove na ho jaye kuch aur! - Ganong's Review of Medical Physiology
🔵 Disease 5 - Complete Heart Block (3rd Degree AV Block)
"Atria aur Ventricle ki talaq ho gayi!"
Kya hota hai: AV node mein signal bilkul block hai. Atria aur ventricles alag-alag apni apni speed se chal rahe hain. Dono ka koi rishta nahi raha!
ECG par kya dhundho:
- P waves aur QRS ka KUCH RISHTA NAHI - P wave QRS ke pehle, beech mein, baad mein - kahi bhi ho sakta hai
- Atrial rate - normal (~80/min)
- Ventricular rate - bahut slow (<40/min) - escape rhythm
- Wide QRS - agar ventricular escape focus ho
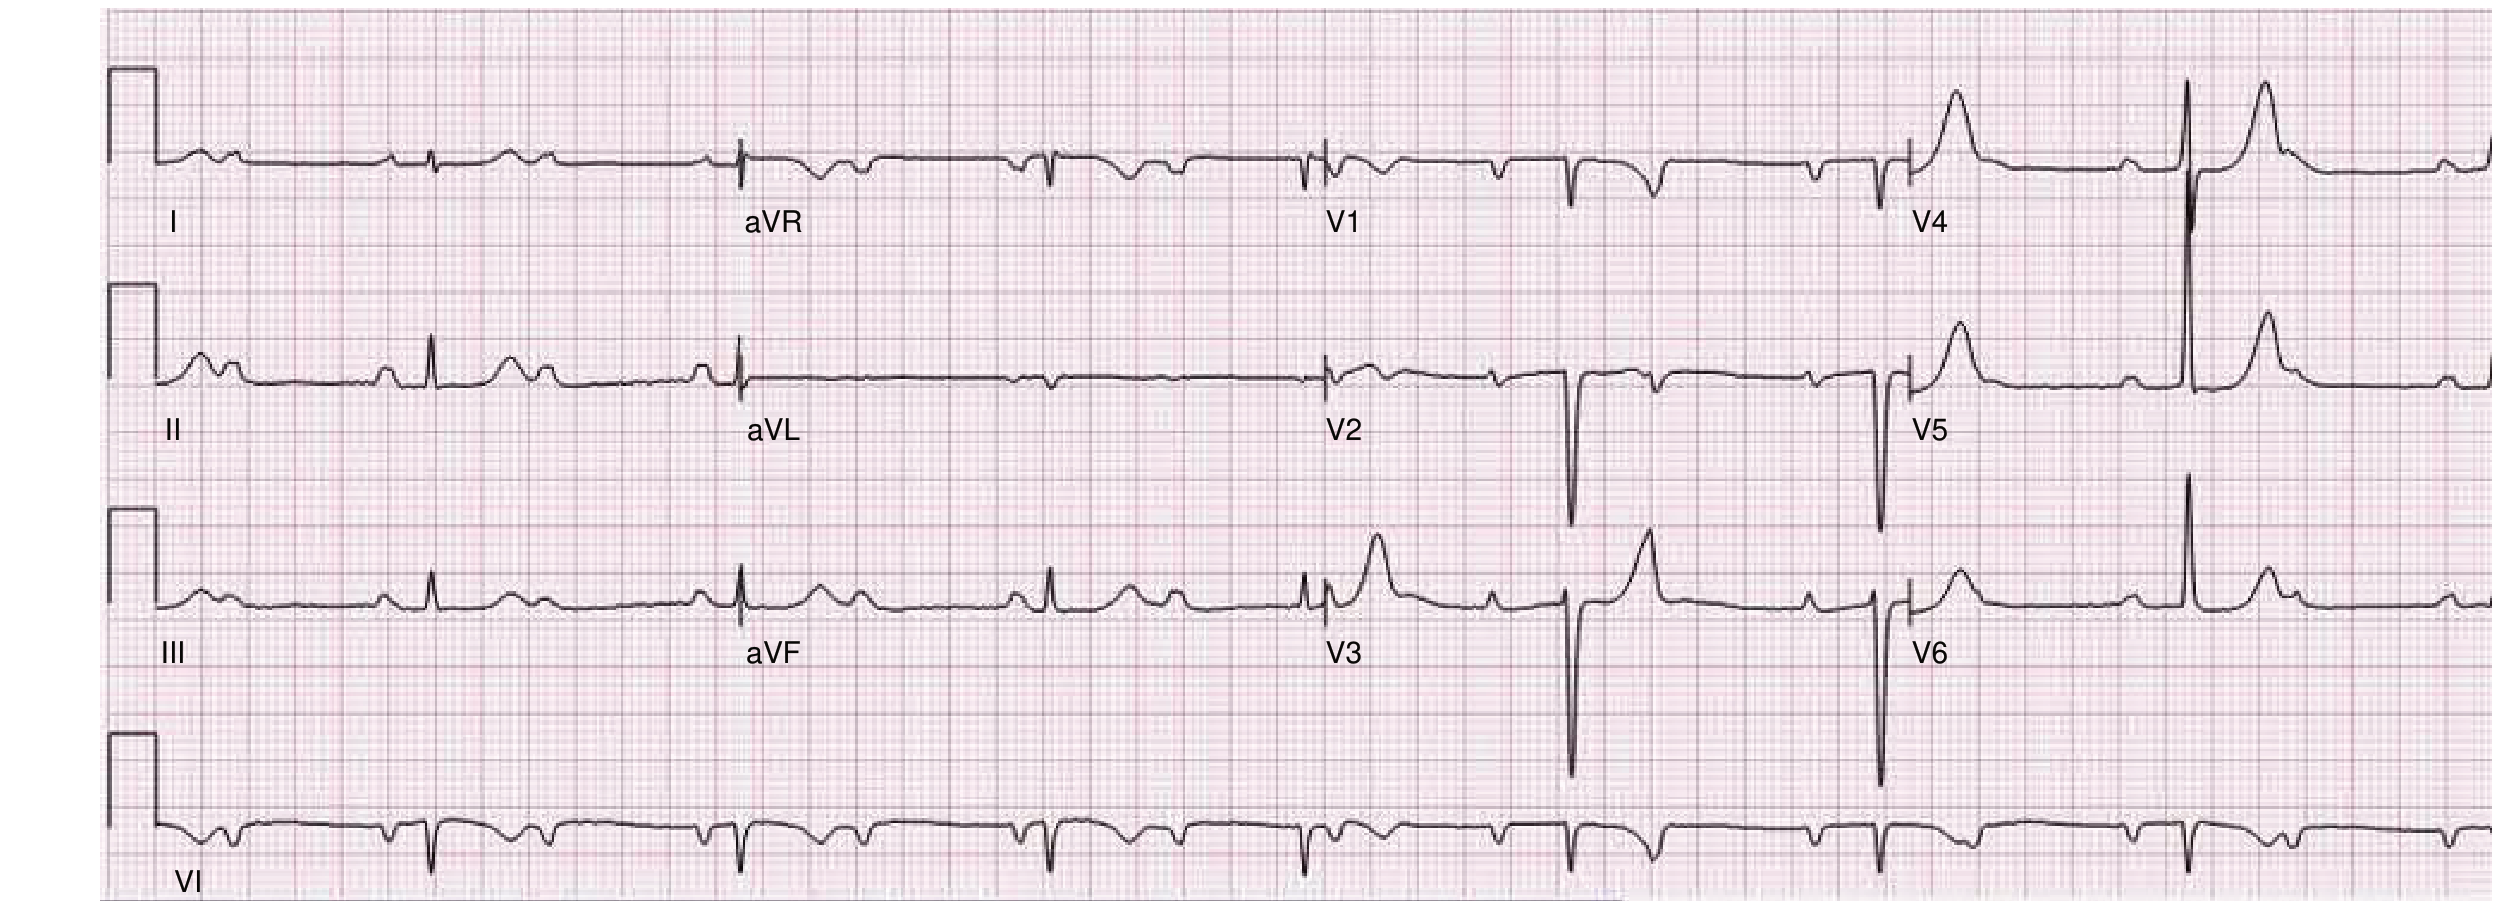
Image mein dekho: P waves aur QRS complexes alag-alag rate pe chal rahe hain. Koi fixed relationship nahi hai P aur QRS ke beech. Yeh high-grade heart block hai. Sinus rate 82/min hai lekin RR intervals variable hain. - Braunwald's Heart Disease
Danger: Rate itna slow ki patient syncope (behosh) ho sakta hai. Temporary/permanent pacemaker laganaa padhta hai.
🟣 Disease 6 - Hyperkalemia (Potassium Bahut Zyada)
"Kidney fail hai ya kuch galat khaya - potassium ka zeher!"
Kya hota hai: Serum K⁺ >5 mEq/L. Causes: renal failure, ACE inhibitors, trauma, Addison's disease.
ECG par kya dhundho (Potassium badhne ke saath badlte hain signs):
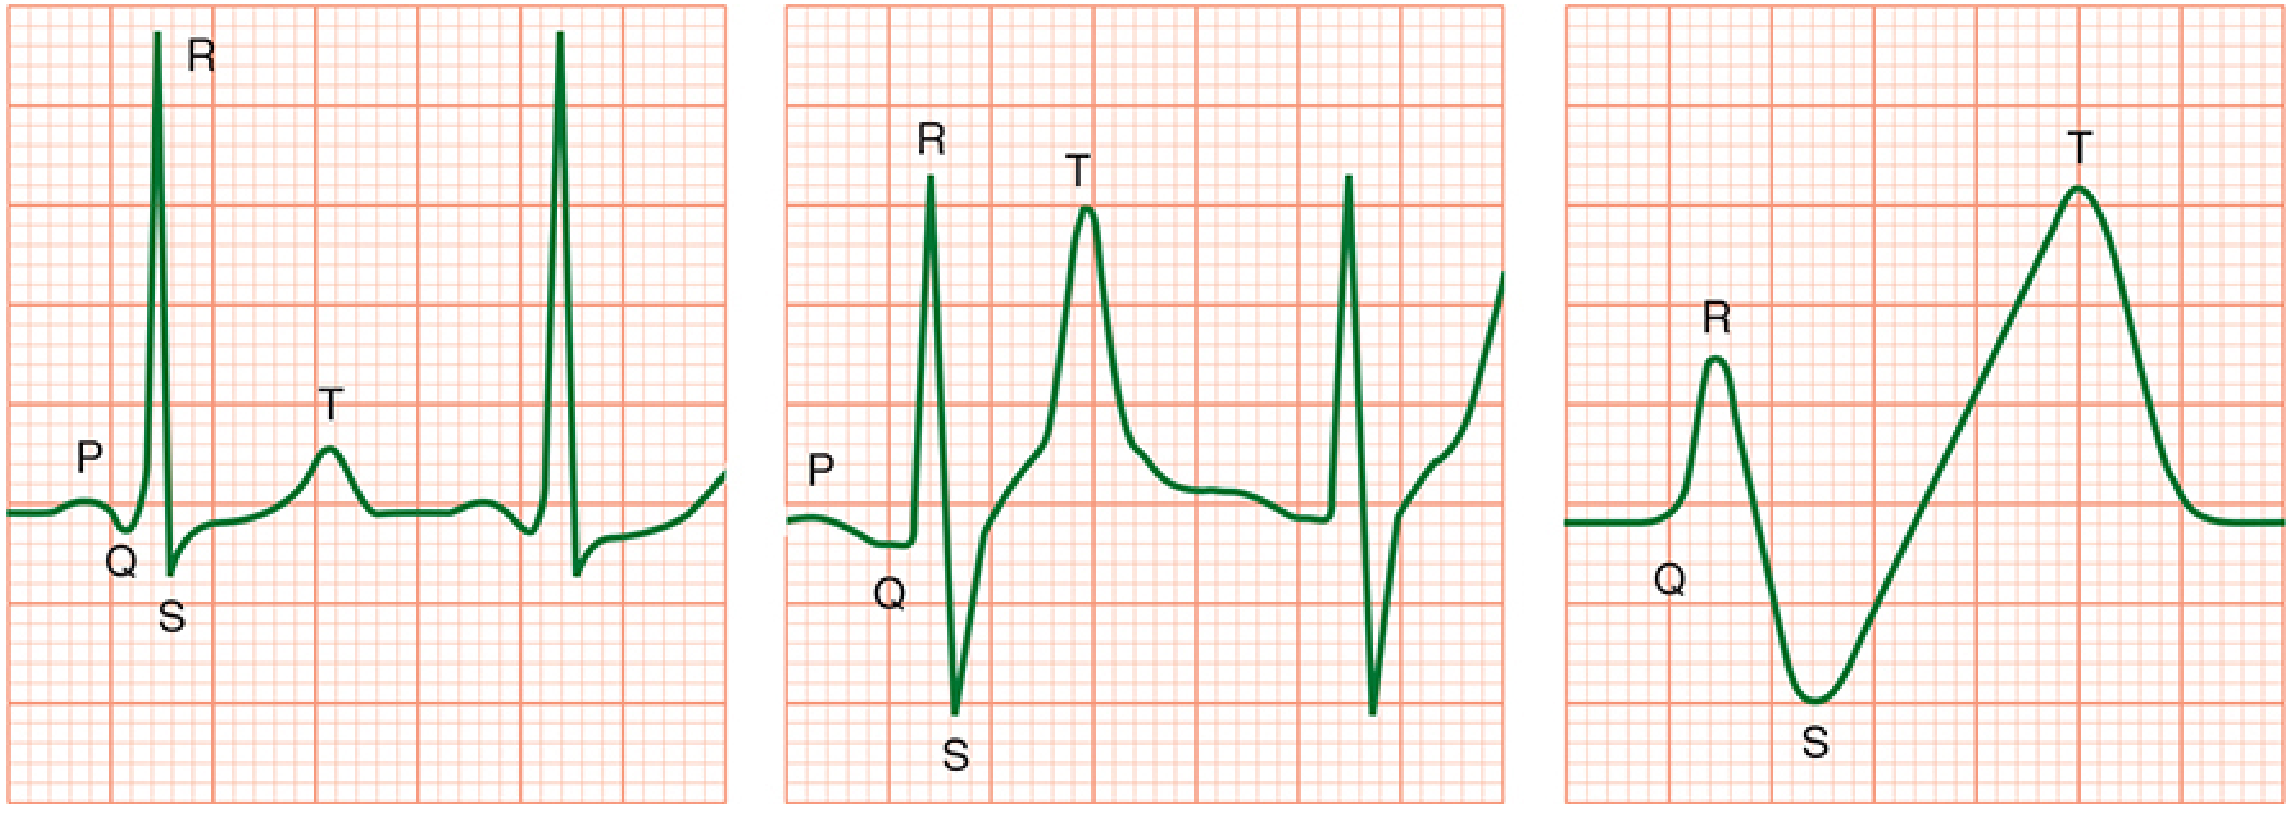
Image mein dekho (Left to right, K⁺ badhta ja raha hai):
- Left panel: Normal ECG - P, Q, R, S, T sab theek hain
- Middle panel: K⁺ badh gaya - T wave TALL ho gayi (peaked symmetric T), R wave chota, QRS wide hone laga
- Right panel: Sine wave pattern - P wave gaayab, QRS aur T wave mil gaye - CARDIAC ARREST AANE WALA HAI!
Stage by stage progression:
| K⁺ Level | ECG Change |
|---|---|
| 5.5-6.5 mEq/L | Tall, peaked, symmetric T waves (earliest sign) |
| 6.5-7.5 mEq/L | P waves chote ya gayab, PR lamba |
| >7 mEq/L | Wide QRS, ST changes |
| Severe | Sine wave - cardiac arrest aane wala hai |
Morgan & Mikhail's Clinical Anesthesiology ke anusar: "Sine wave is a sign of impending cardiac arrest."
🟤 Disease 7 - Acute Pericarditis (Pericardium ki Sujan)
"Dil ke ghilaf mein sujan - stages mein badalta ECG"
Kya hota hai: Dil ka outer layer (pericardium) inflame ho jaata hai. Viral infection, TB, ya autoimmune causes ho sakte hain.
ECG mein 4 stages hoti hain:
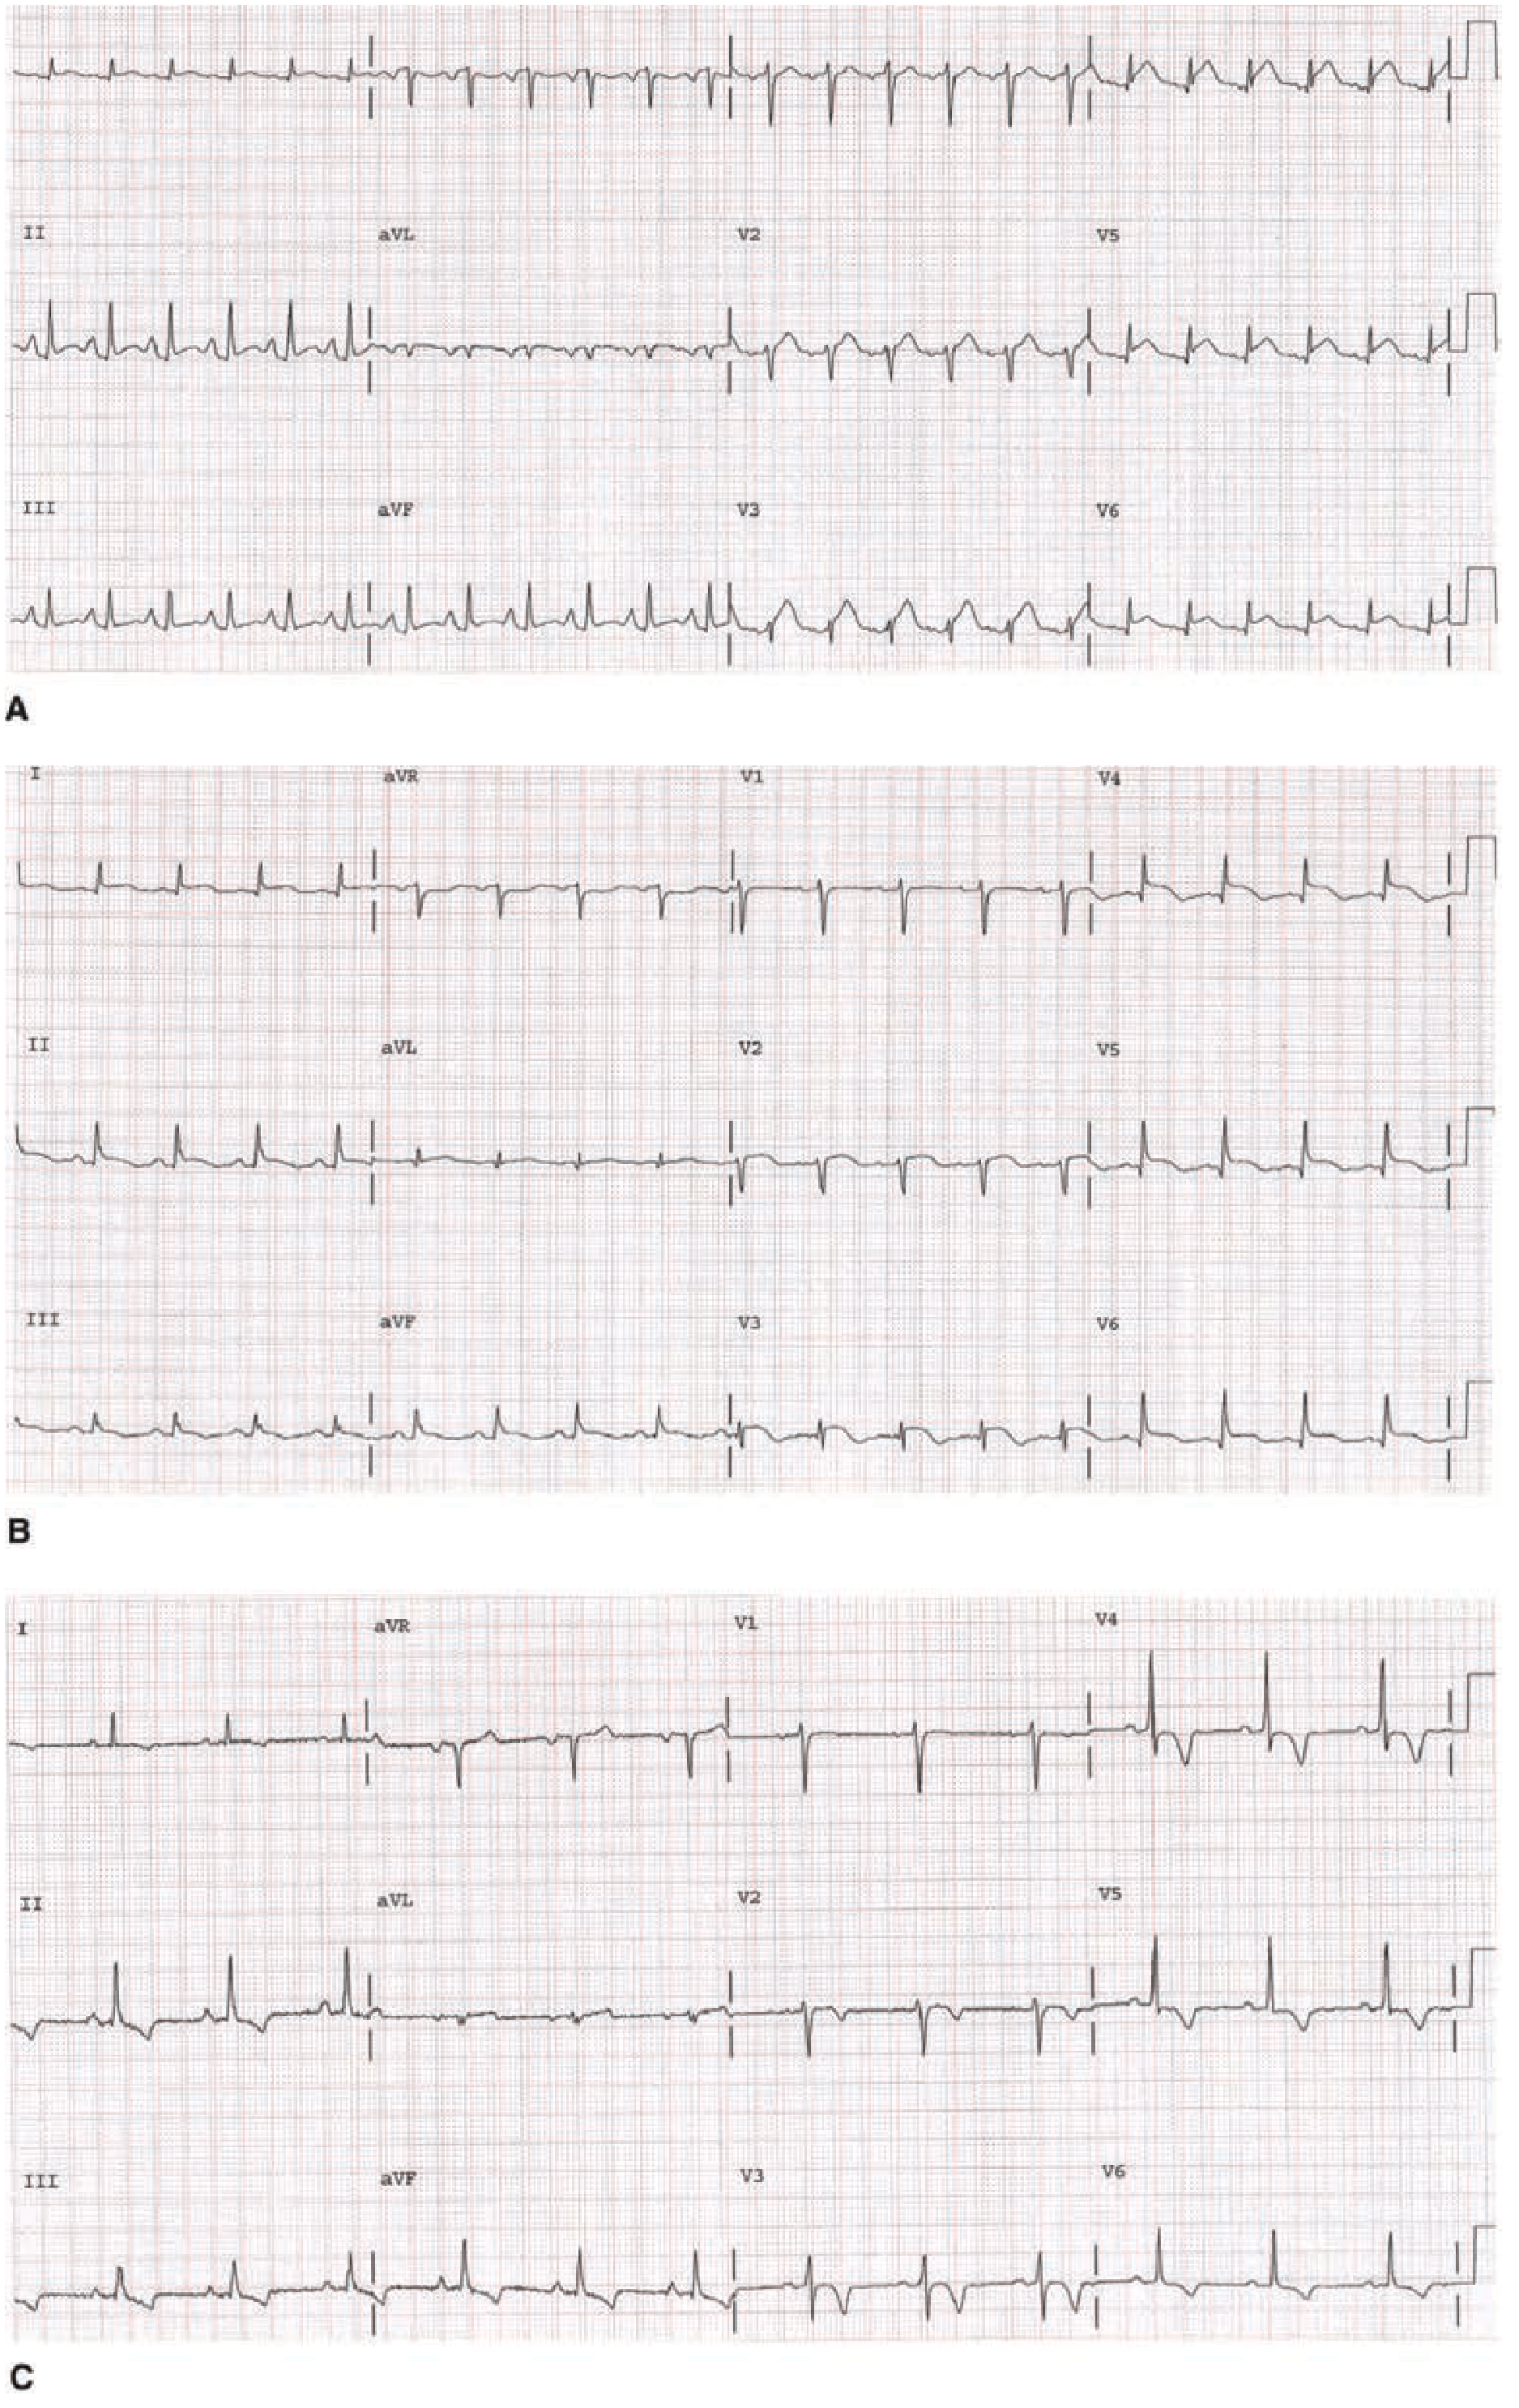
Image mein dekho:
- Panel A (Stage I): Leads I, II, III, aVF mein diffuse ST elevation + PR depression - yeh pericarditis ki pehchaan hai
- Panel B (Stage II): ST segments wapas baseline par aa rahe hain
- Panel C (Stage III): ST normal ho gaya, ab T wave inversion widely dikhne lagi
Aur ek aur image - Braunwald's Heart Disease se pericarditis ka classic ECG:
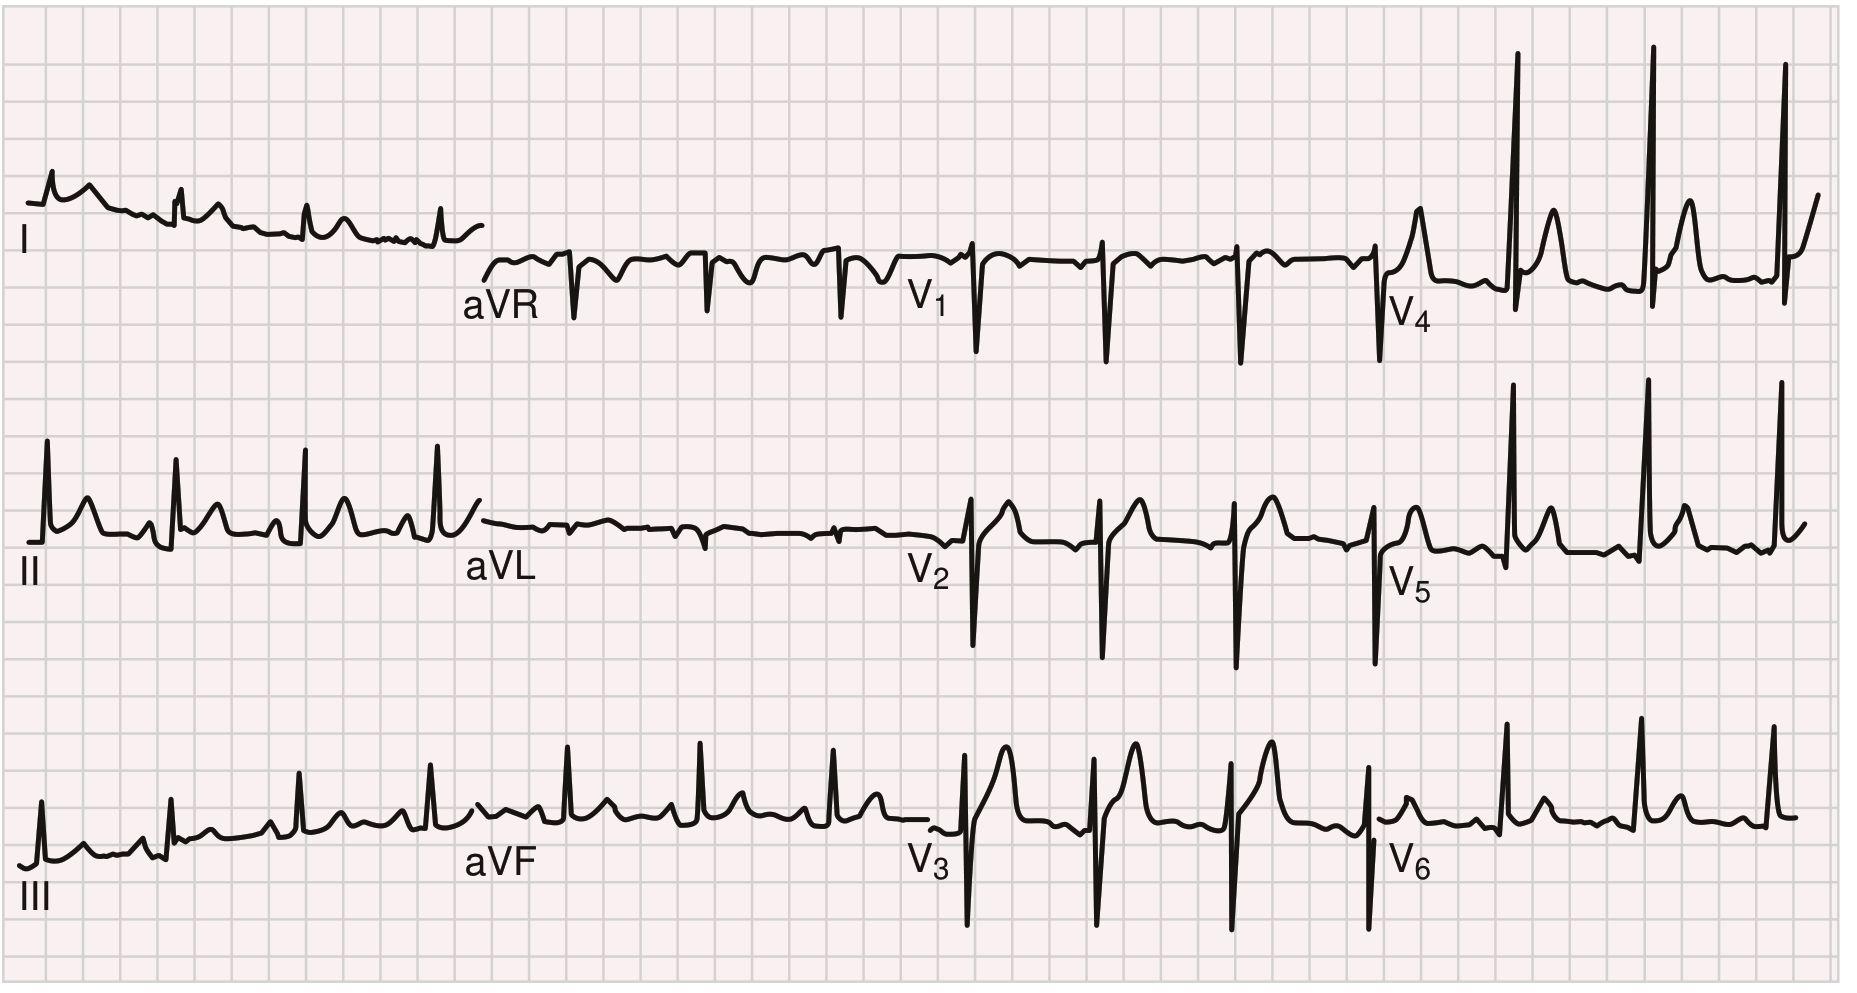
Image mein dekho: Multiple leads mein ST elevation hai - yeh diffuse hai (STEMI mein ek territory mein hota). PR segment neeche gaya hai (depression) - yeh almost pathognomonic for pericarditis hai!
STEMI se kaise alag karein:
| Feature | STEMI | Pericarditis |
|---|---|---|
| ST elevation | Specific territory | Diffuse (almost all leads) |
| Reciprocal depression | Haan ✓ | Nahi (except aVR) |
| PR depression | Nahi | Haan ✓ |
| Q waves | Develop hote hain | Nahi hote |
Goldman-Cecil Medicine ke anusar: "Early in acute pericarditis, ECG typically displays diffuse ST elevation in association with PR depression."
🔶 Disease 8 - Wolff-Parkinson-White (WPW)
"Dil ka short-circuit - extra raasta"
Kya hota hai: Atria aur ventricle ke beech ek extra abnormal conduction pathway hota hai (Bundle of Kent). Signal AV node ko bypass karke ventricle mein jaldi pahunch jaata hai.
ECG par Teen classic signs:
- Short PR interval - <120 ms (AV node ka delay skip ho gaya)
- Delta wave - QRS ka slurred, slow upstroke - pre-excitation ka sign
- Wide QRS - kyunki ventricle abnormal tarike se activate ho raha hai
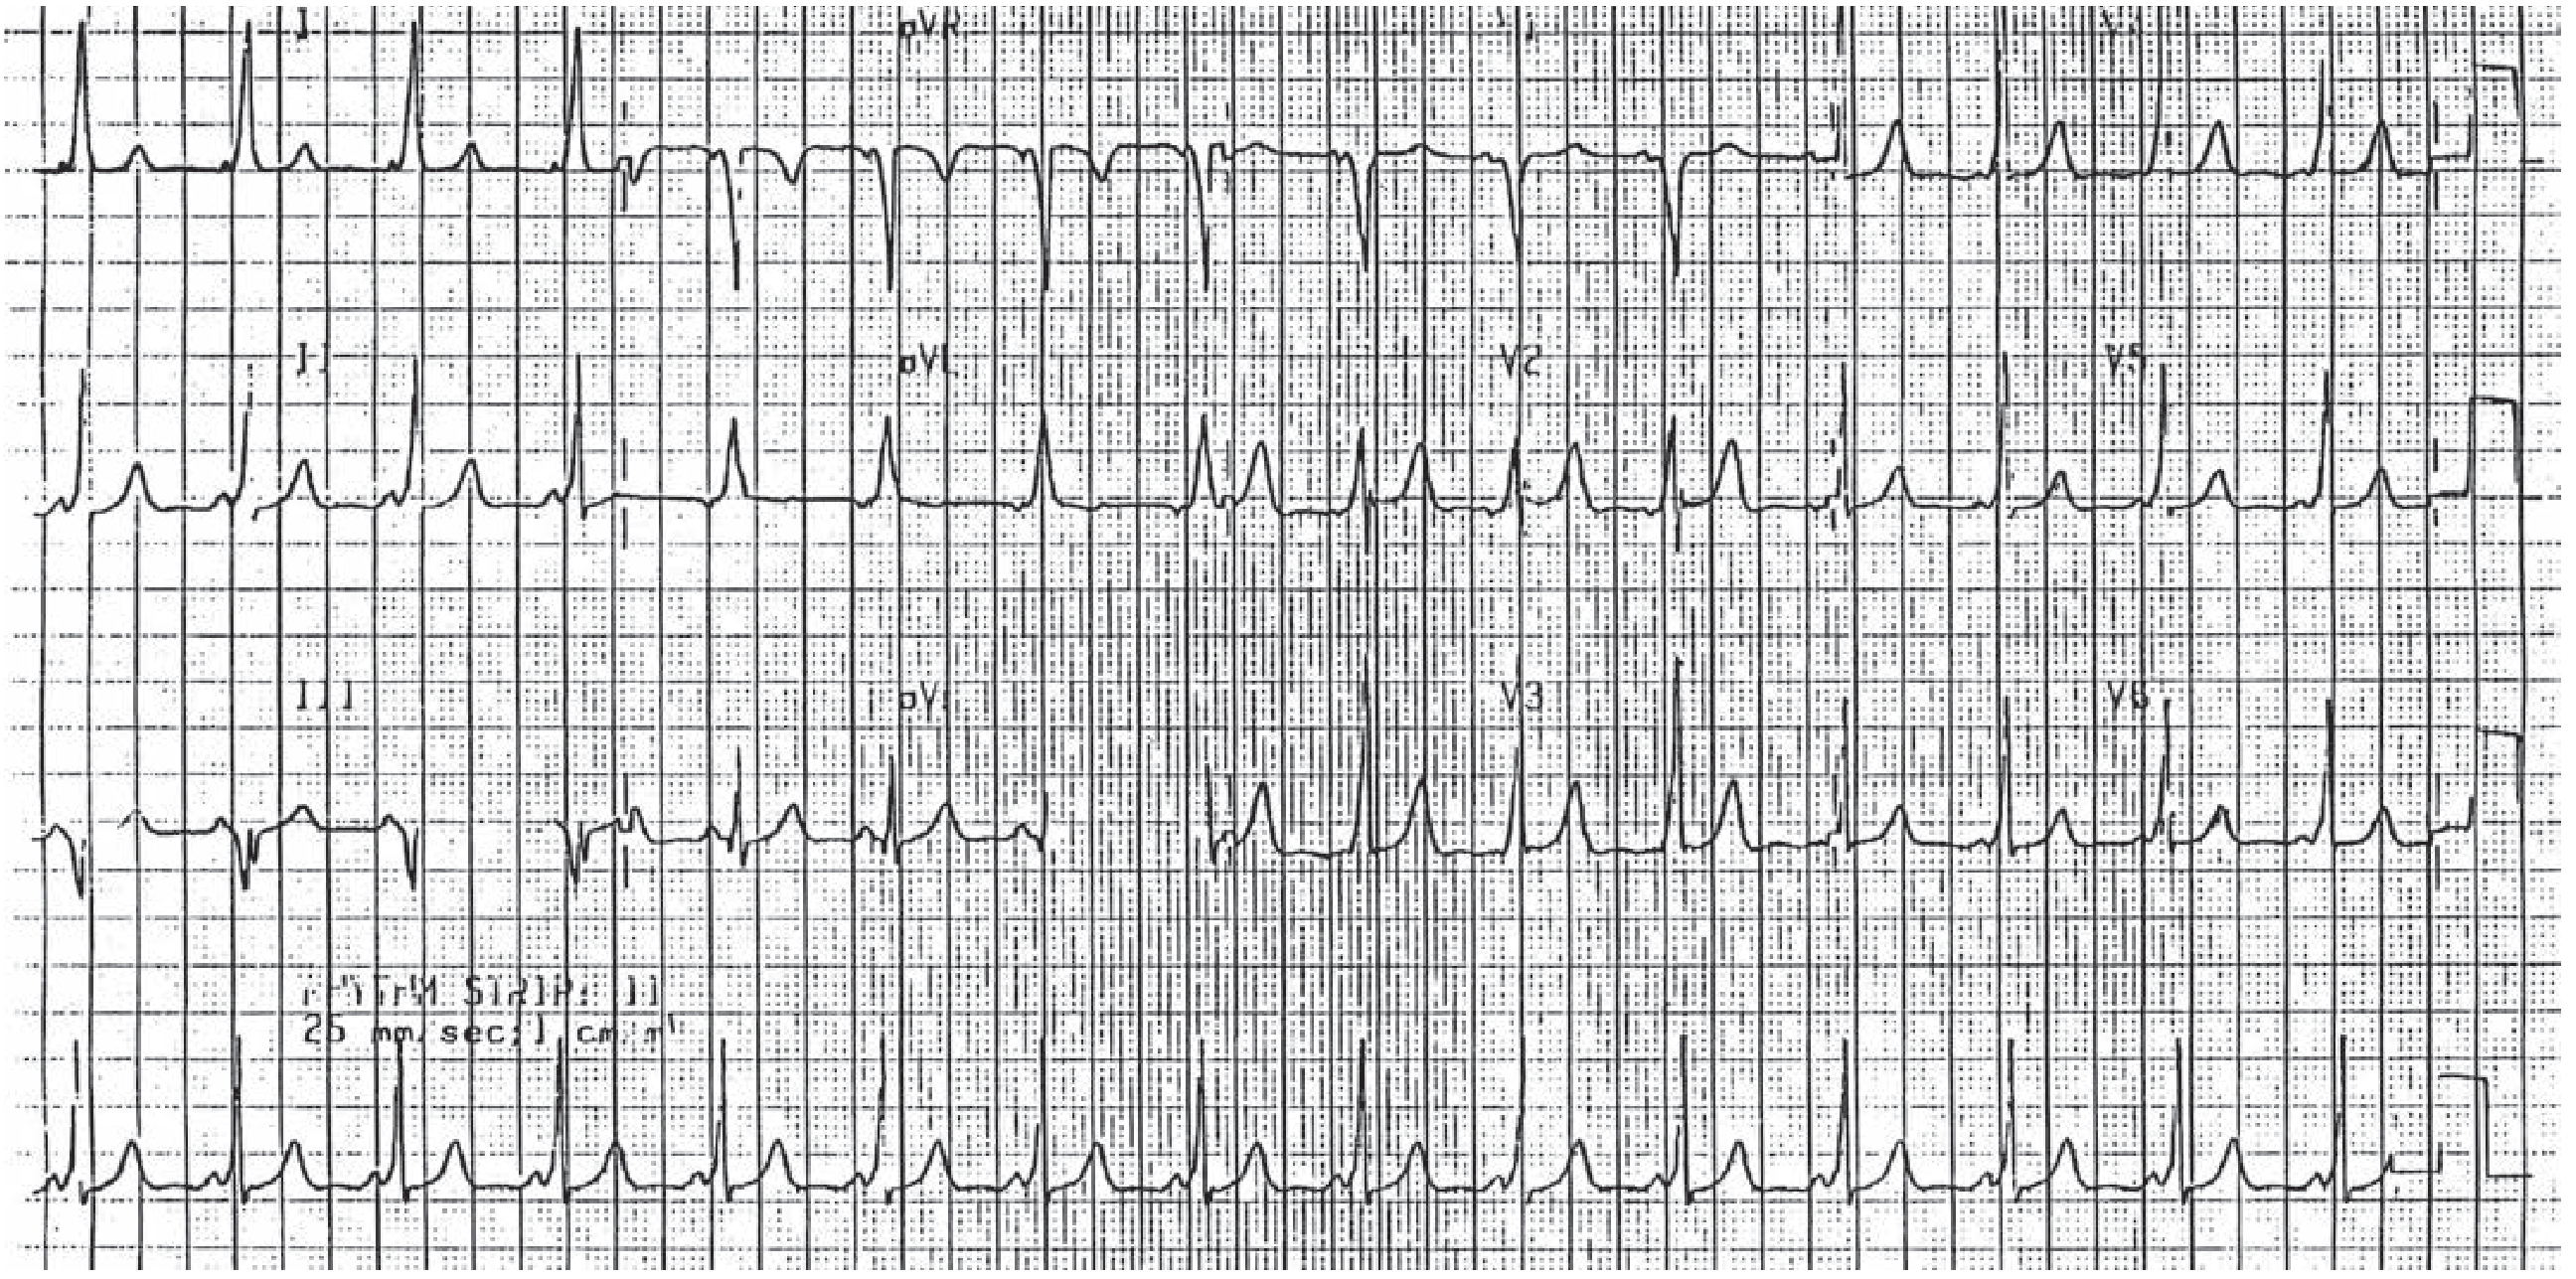
Image mein dekho: Is 12-lead ECG mein PR interval chota hai. QRS ka upstroke smooth nahi hai - slurred hai (delta wave). Yeh WPW ka classic pattern hai. - Tintinalli's Emergency Medicine, Pediatric section
KHATARNAK FACT: Agar WPW mein AF ho jaaye toh AV node bypass ho jaata hai aur ventricular rate >300/min tak pahunch sakta hai → Ventricular Fibrillation → Sudden Death!
FORBIDDEN drugs in WPW + AF:
- ❌ Digoxin
- ❌ Verapamil
- ❌ Adenosine (relative caution)
Treatment: Radiofrequency catheter ablation - ek hi baar mein extra pathway destroy kar do!
🔷 Disease 9 - Bundle Branch Blocks (RBBB vs LBBB)
"Dil ki wiring ka fault"
Kya hota hai: Left ya Right bundle branch mein conduction ruktaa hai. Ventricle slowly aur abnormally depolarize hota hai.
ECG par kya dhundho - RBBB vs LBBB:
Image mein dekho (V1 aur V6 compare karo):
| V1 mein | V6 mein | |
|---|---|---|
| Normal | rS pattern | qR pattern |
| RBBB | rSR' (rabbit ears/M shape) | Wide S wave |
| LBBB | Wide deep QS | Broad tall R wave |
Dono mein T wave inversion hoti hai jo QRS ke last deflection ke opposite hoti hai - yeh "secondary" change hai aur normal hai BBB mein.
Kab LBBB concern ka sign hai: Harrison's ke anusar - LBBB aksar 4 underlying diseases mein milta hai:
- Coronary artery disease
- Hypertensive heart disease
- Aortic valve disease
- Cardiomyopathy
Braunwald's Heart Disease ke anusar: "RBBB mein V1 par rSR' (rabbit ears), LBBB mein V1 par wide QS aur V6 par broad R."
⚫ Disease 10 - Long QT Syndrome (LQTS) aur Torsades
"QT lamba hua toh Torsades aa sakti hai"
Kya hota hai: Ventricular repolarization slow ho jaati hai - QT interval lamba ho jaata hai. Inherited (channelopathy) ya acquired (drugs, electrolytes) ho sakta hai.
ECG par kya dhundho:
- Prolonged QTc - >450 ms men, >460 ms women
- T wave - broad, bizarre shape, ya biphasic
- Torsades de Pointes - complication jo Long QT ke baad aati hai
Hyperkalemia se alag - Hyperkalemia ECG mein QT CHOTA hota hai, Long QT mein QT LAMBA hota hai!
Image mein dekho:
- Top: Normal sinus rhythm - lekin QT interval lamba lag raha hai (P se T ka end tak)
- Middle: Torsades de Pointes - QRS ka axis ghoomta hai, kabhi oopar kabhi neeche, spindle jaisi shape - yeh LQTS ka deadly complication hai
- Bottom: VF + defibrillator ne discharge kiya → wapas sinus rhythm
Causes of Long QT (Acquired - "ABCDE" mnemonic):
- Antiarrhythmics (amiodarone, sotalol, quinidine)
- Bradycardia
- Cardiac - hypokalemia, hypomagnesemia, hypocalcemia
- Drugs (antibiotics - azithromycin, antihistamines, antipsychotics)
- Electrolyte imbalance
🧠 Ek Nazar mein - Image ke Saath Summary
| # | Bimari | Sabse Important ECG Sign | Emergency? |
|---|---|---|---|
| 1 | STEMI | ST elevation (territory specific) + Q waves | 🚨 Haan |
| 2 | Atrial Fibrillation | Irregularly irregular + no P waves | ⚠️ Rate control |
| 3 | Atrial Flutter | Sawtooth ~300/min + regular ~150/min rate | ⚠️ Moderate |
| 4 | Ventricular Tachycardia | Wide QRS + fast + AV dissociation | 🚨 Haan |
| 5 | Complete Heart Block | P aur QRS ka koi rishta nahi + slow rate | 🚨 Pacemaker chahiye |
| 6 | Hyperkalemia | Peaked T → wide QRS → sine wave | 🚨 Haan |
| 7 | Pericarditis | Diffuse ST elevation + PR depression | ⚠️ Moderate |
| 8 | WPW | Short PR + Delta wave + wide QRS | ⚠️ AF ke saath 🚨 |
| 9 | BBB (RBBB/LBBB) | Wide QRS + rSR' (RBBB) ya QS (LBBB) in V1 | ⚠️ Context dependent |
| 10 | Long QT / Torsades | Long QTc + twisting VT (Torsades) | 🚨 Haan |
Sources: Harrison's Principles 22nd Ed (2025) | Braunwald's Heart Disease | Tintinalli's Emergency Medicine | Goldman-Cecil Medicine | Ganong's Review of Medical Physiology | Morgan & Mikhail's Clinical Anesthesiology | Textbook of Family Medicine 9th Ed
This is a shared conversation. Sign in to Orris to start your own chat.