
TEACH ME EVERYTHING I
It looks like your message got cut off! You started with "TEACH ME EVERYTHING I" but didn't finish the thought.
What would you like to learn about? Feel free to complete your question and I'll dive in!
Teach me everything that i need to know about the ECG starting from the basics of lead placement and
Your message seems to have been cut off again at "and" - but I have enough context to give you a thorough ECG lesson! Let me pull from authoritative medical textbooks to give you the best possible answer.
Searching sources...
Reading File
Finding Sources
Finding Sources
Finding Sources
Finding Sources
Finding Sources
Searching the Web
ECG lead placement 12-lead electrocardiogram basics waveforms interpretation complete guide
Now let me read the key ECG sections from Braunwald's Heart Disease and other textbooks in parallel:
Reading File
Finding Sources
Finding Sources
Finding Sources
Reading File
Reading Web Page
https://litfl.com/ecg-library/basics
Finding Sources
Finding Sources
Now let me read the key ECG sections from Harrison's, Guyton, Goldman-Cecil, and Harriet Lane in parallel:
Reading File
Reading File
Reading File
Reading File
Excellent - I now have rich source material. Let me read more from Goldman-Cecil and Harriet Lane ECG sections, and fetch key ECG images:
Reading File
Reading File
Loading Image
Reading File
Reading File
Loading Image
Loading Image
Loading Image
I now have excellent source material and images. Let me get a bit more content on common ECG abnormalities and arrhythmias, then compile the complete guide:
Reading File
Now I have all the material I need. Here is the complete, textbook-sourced ECG guide:
The Complete ECG Guide - From Basics to Advanced Interpretation
PART 1: THE ELECTRICAL FOUNDATION
Why Does the Heart Generate Electricity?
Every heartbeat starts with an electrical impulse. As Goldman-Cecil Medicine explains: "Electrical activation of the heart depends on the spread of a depolarizing wave front from pacemaker cells through cardiac muscle, as well as via specialized conducting tissues."
At the cellular level, ion channels (mainly Na⁺, K⁺, and Ca²⁺) open and close in sequence, creating an action potential - the voltage change that both triggers and represents electrical activity. This electrical current doesn't stay inside the heart; it spreads through body tissues to the skin surface, where electrodes can detect it.
The Cardiac Conduction System
This is the "wiring" of the heart, and understanding it is essential to reading any ECG:
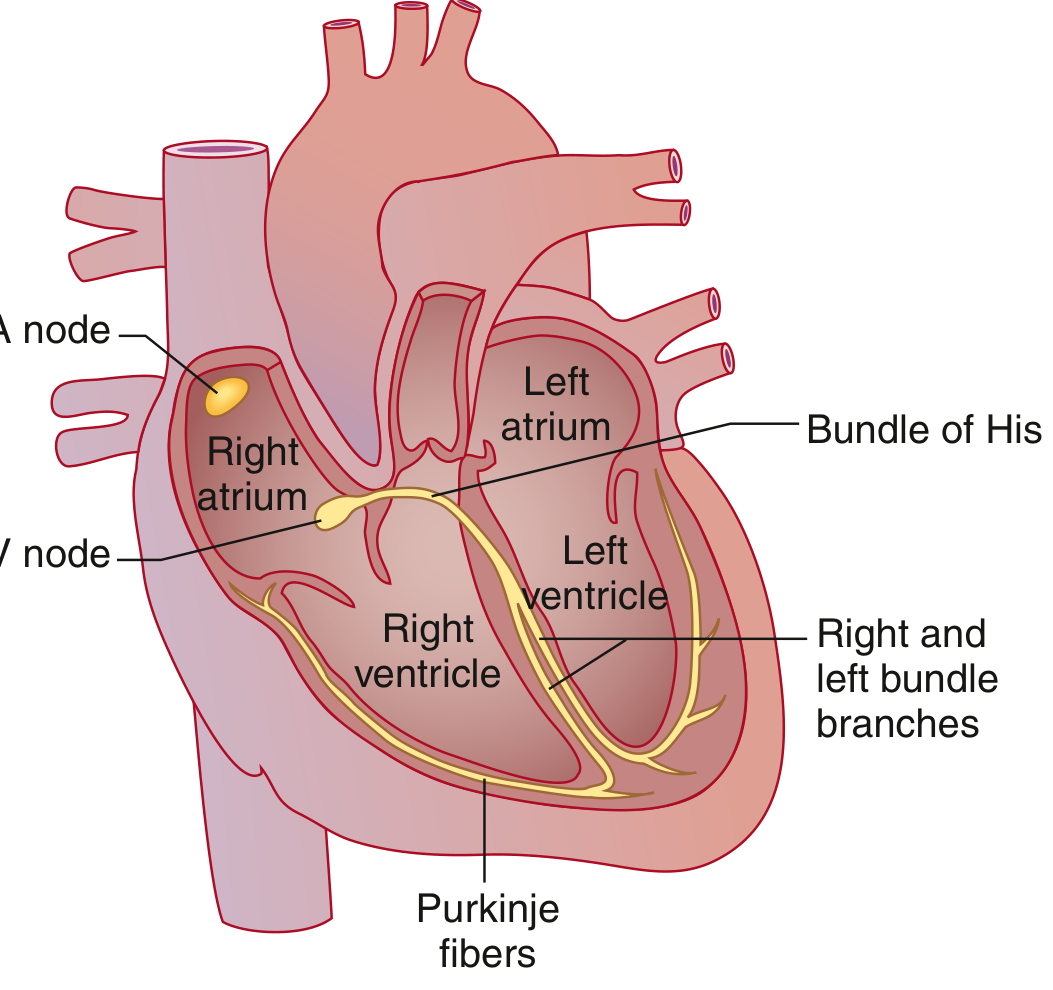
The normal sequence is:
- SA Node (sinoatrial node) - the dominant pacemaker, located in the high lateral right atrium near the superior vena cava. It fires spontaneously and fastest (60-100 bpm at rest), setting the heart rate.
- Bachmann Bundle - a specialized tract that rapidly conducts the impulse to the left atrium.
- AV Node (atrioventricular node) - the only normal electrical bridge between atria and ventricles. It creates a physiologic delay (allowing atria to finish contracting before ventricles begin). The AV valve rings are electrically insulated everywhere else.
- Bundle of His - exits the AV node; capable of rapid conduction.
- Bundle Branches - the His bundle splits into the right bundle branch and the left bundle branch. The left further divides into the left anterior fascicle and left posterior fascicle.
- Purkinje System - the fine distal network that rapidly distributes the impulse throughout both ventricles, triggering near-simultaneous contraction.
PART 2: THE ECG MACHINE AND LEAD PLACEMENT
What the ECG Records
The ECG machine records voltage difference between two points over time. The standard 12-lead ECG uses 10 physical electrodes but mathematically creates 12 different "views" (leads) of the heart. Think of it like photographing an object from 12 angles to understand its full 3D shape.
Electrode Placement
Limb Electrodes (4 electrodes)
| Electrode | Location |
|---|---|
| RA (Right Arm) | Anywhere between right shoulder and right wrist/elbow |
| LA (Left Arm) | Anywhere between left shoulder and left wrist/elbow |
| LL (Left Leg) | Anywhere below left torso, above left ankle |
| RL (Right Leg) | Below right torso, above right ankle - serves as ground/reference only |
Precordial (Chest) Electrodes (6 electrodes - V1 through V6)
| Lead | Placement |
|---|---|
| V1 | 4th intercostal space (ICS), right sternal border |
| V2 | 4th intercostal space, left sternal border |
| V3 | Midway between V2 and V4 |
| V4 | 5th ICS, midclavicular line |
| V5 | Anterior axillary line, same horizontal level as V4 |
| V6 | Mid-axillary line, same horizontal level as V4 and V5 |
Clinical tip: In female patients, place leads V3-V6 under the left breast. Never use nipples as landmarks - they vary considerably between patients.
Important: The limb electrodes can be placed on upper arms and thighs rather than wrists and ankles, but must be consistent (e.g., don't put RA on the wrist and LA on the upper arm).
PART 3: THE 12 LEADS AND WHAT THEY "SEE"
Limb Leads - View the Frontal Plane (from in front of the body)
Standard Bipolar Limb Leads (Einthoven's triangle):
- Lead I = Left Arm (+) minus Right Arm (-) → looks at the lateral left side of the heart
- Lead II = Left Leg (+) minus Right Arm (-) → looks inferiorly and is the most commonly used rhythm strip lead
- Lead III = Left Leg (+) minus Left Arm (-) → looks inferiorly
Augmented Unipolar Limb Leads (the "aV" leads):
- aVR = Right Arm (+) → looks at the cavity of the heart / right shoulder; P and QRS are normally inverted here
- aVL = Left Arm (+) → looks at the high lateral wall
- aVF = Left Leg (Foot) (+) → looks at the inferior wall
Precordial Leads - View the Horizontal Plane (cross-section of the chest)
The V leads "wrap" around the heart from right to left, crossing the front of the chest:
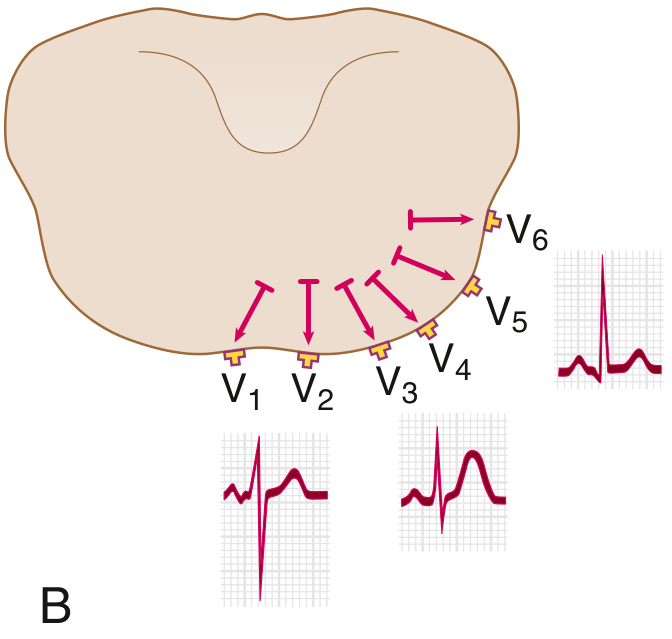
- V1-V2: Right ventricular view (right precordial)
- V3-V4: Septal/anterior view
- V5-V6: Lateral left ventricular view
Which Leads Look at Which Walls?
| Territory | Leads | Coronary Artery |
|---|---|---|
| Inferior | II, III, aVF | Right coronary artery (RCA) |
| Lateral | I, aVL, V5, V6 | Left circumflex (LCx) |
| Anterior | V1-V4 | Left anterior descending (LAD) |
| Septal | V1-V2 | LAD (septal perforators) |
This territorial mapping is the key to locating myocardial infarctions on the ECG.
PART 4: THE ECG PAPER AND WAVEFORMS
ECG Paper Basics
- Paper runs at 25 mm/second
- 1 small square = 1 mm = 0.04 seconds
- 1 large square (5 small squares) = 5 mm = 0.20 seconds
- Amplitude standard: 10 mm = 1 mV
The Normal ECG Waveform
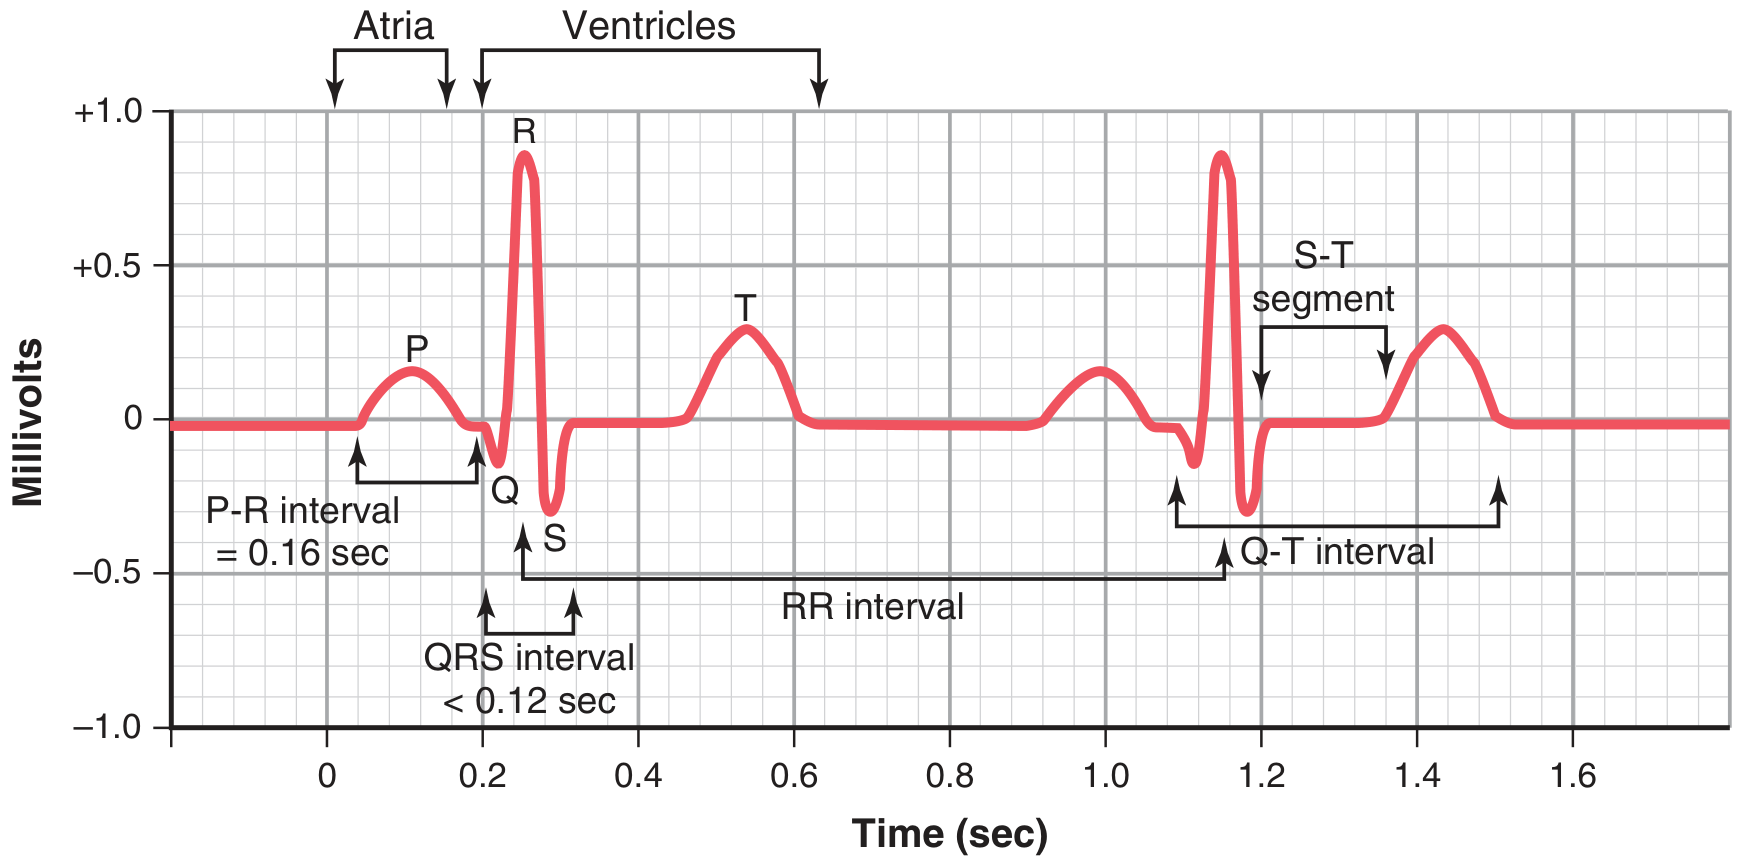
As Guyton & Hall explains: "The normal ECG is composed of a P wave, a QRS complex, and a T wave. The QRS complex is often, but not always, three separate waves: the Q wave, the R wave, and the S wave."
Each Component Explained
P Wave - Atrial Depolarization
- Represents electrical activation of the atria
- Normally: small, rounded, upright in leads I, II, aVF; inverted in aVR
- Duration: < 0.12 sec (3 small squares)
- Amplitude: < 2.5 mm (in II), < 1.5 mm in V1
- Every P wave should be followed by a QRS in sinus rhythm
PR Interval - AV Conduction Time
- Measured from the start of P wave to the start of QRS
- Represents the time for the impulse to travel from the SA node, through the AV node, bundle of His, and bundle branches, to the ventricles
- Normal: 0.12-0.20 seconds (3-5 small squares)
- Short PR (<0.12): pre-excitation (e.g., WPW syndrome) or junctional rhythm
- Long PR (>0.20): 1st degree AV block (delayed AV conduction)
QRS Complex - Ventricular Depolarization
- Represents simultaneous depolarization of both ventricles
- Normal duration: < 0.12 seconds (< 3 small squares)
- Wide QRS (≥0.12): bundle branch block, ventricular rhythm, or aberrant conduction
- The individual waves:
- Q wave: Initial negative deflection. Septal q waves (small, narrow) are normal in lateral leads. Pathological Q waves are ≥0.04 sec wide or ≥25% of the R wave height - they suggest prior MI.
- R wave: First positive deflection
- S wave: Negative deflection after an R wave
ST Segment - Early Ventricular Repolarization
- The period between end of QRS and start of T wave
- Should be isoelectric (flat, at baseline)
- ST elevation: ischemia (STEMI), pericarditis, Brugada, early repolarization
- ST depression: ischemia, NSTEMI, digoxin effect
T Wave - Ventricular Repolarization
- "The T wave is caused by potentials generated as the ventricles recover from depolarization... The T wave is known as a repolarization wave." - Guyton & Hall
- Normally upright (concordant) in leads where QRS is upright
- Normally inverted in aVR (and sometimes V1)
- Tall peaked T waves: hyperkalemia, hyperacute MI
- Inverted T waves: ischemia, ventricular hypertrophy, PE (V1-V4), RBBB/LBBB
QT Interval
- From start of QRS to end of T wave
- Represents total ventricular depolarization + repolarization
- Must be rate-corrected (QTc): Bazett's formula: QTc = QT / √RR interval
- Normal QTc: < 440 ms in men, < 460 ms in women
- Prolonged QTc: risk of Torsades de Pointes (dangerous arrhythmia); caused by drugs, electrolyte abnormalities, congenital channelopathies
U Wave
- Small deflection after the T wave, best seen in V2-V3
- Represents late phases of ventricular repolarization
- Prominent U waves: hypokalemia, bradycardia, drugs (quinidine)
PART 5: SYSTEMATIC ECG INTERPRETATION - THE 7-STEP APPROACH
Never free-style reading an ECG. Use a systematic method every single time:
Step 1 - Rate
Method 1 (regular rhythms): Count large boxes between two R waves.
- 1 box = 300 bpm
- 2 boxes = 150 bpm
- 3 boxes = 100 bpm
- 4 boxes = 75 bpm
- 5 boxes = 60 bpm
- 6 boxes = 50 bpm
Method 2 (irregular rhythms): Count the number of QRS complexes in 10 seconds (the full strip) × 6 = beats per minute.
Normal heart rate: 60-100 bpm. <60 = bradycardia. >100 = tachycardia.
Step 2 - Rhythm
- Is the rhythm regular or irregular?
- Are there P waves? Are they normal?
- Is there a P before every QRS, and a QRS after every P?
- Are all the P-P intervals and R-R intervals equal?
Step 3 - Axis (Frontal Plane)
The axis is the average direction of ventricular depolarization in the frontal plane.
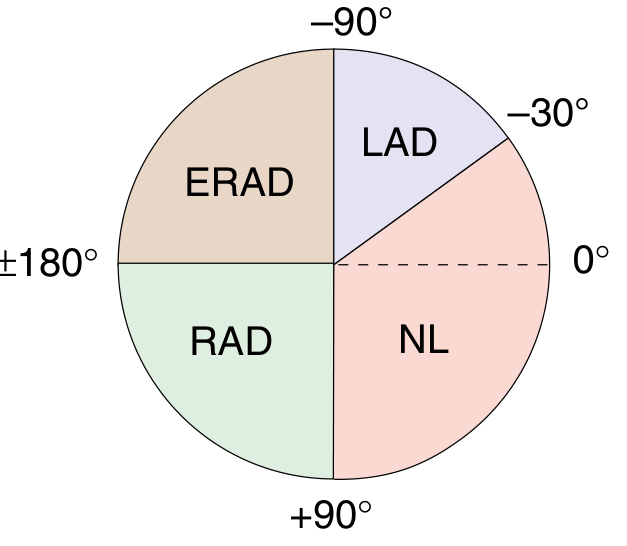
| Axis | Degrees | Clinical Significance |
|---|---|---|
| Normal | -30° to +90° | Normal |
| LAD (Left Axis Deviation) | -30° to -90° | LBBB, LAFB, inferior MI, LVH |
| RAD (Right Axis Deviation) | +90° to +180° | RBBB, LPFB, RVH, PE, lateral MI |
| ERAD (Extreme RAD) | -90° to ±180° | Severe pathology, dextrocardia |
Quick axis check: Look at Lead I and aVF:
- Both upright → Normal axis
- Lead I up, aVF down → LAD
- Lead I down, aVF up → RAD
- Both negative → ERAD
Step 4 - Intervals
Check PR, QRS, and QT as detailed above.
Step 5 - P Wave Morphology
- Look for atrial enlargement
- Left atrial enlargement (LAE): Bifid P (P mitrale) in lead II; biphasic P with wide/deep terminal deflection in V1
- Right atrial enlargement (RAE): Tall peaked P (≥2.5mm) in leads II, III, aVF (P pulmonale)
Step 6 - QRS Morphology
- Check for Q waves (septal vs. pathological)
- Check for voltage (LVH / RVH criteria)
- Check bundle branch block pattern
Step 7 - ST Segments and T Waves
- Look for elevation or depression
- Check T wave morphology and concordance
- Look for hyperacute T waves (early MI sign)
PART 6: COMMON ECG ABNORMALITIES
Bundle Branch Blocks
From Goldman-Cecil Medicine's Table 42-3:
| Block | QRS Duration | Axis | Key Features |
|---|---|---|---|
| RBBB | ≥ 0.12 sec | Normal | rSR' in V1 ("bunny ears"); wide S in I and V6 |
| LBBB | ≥ 0.12 sec | Variable | QS or rS in V1; wide notched R in V5/V6/I; no septal q |
| LAFB | < 0.12 sec | -45° to -90° | LAD; qR in aVL; small r, deep S in II, III, aVF |
| LPFB | < 0.12 sec | +90° to +180° | RAD; rS in I/aVL; qR in III/aVF |
Memory trick for bundle branch blocks: In V1:
- RBBB = RSR' (R goes up, comes down, goes up again - "rabbit ears")
- LBBB = WiLLiaM and MaRRoW → in V1: W shape in LBBB, M shape in RBBB
AV Blocks
| Block | PR Interval | Pattern | Notes |
|---|---|---|---|
| 1st degree | > 0.20 sec | Every P conducts to QRS | PR is prolonged but constant |
| 2nd degree Mobitz I (Wenckebach) | Progressively lengthens | Until a P wave fails to conduct; QRS dropped | Benign; usually in the AV node |
| 2nd degree Mobitz II | Constant (normal or long) | Sudden non-conducted P wave without prior lengthening | More serious; below AV node |
| 3rd degree (Complete) | P and QRS have no relationship | Complete AV dissociation | Requires pacemaker; escape rhythm present |
Myocardial Infarction (STEMI Patterns)
Ischemic damage leaves a "signature" on the ECG in the leads looking at the affected territory:
Hyperacute (first minutes-hours): Tall, peaked T waves (hyperacute T waves)
Acute STEMI: ST elevation ≥ 1mm in ≥ 2 contiguous limb leads, or ≥ 2mm in ≥ 2 contiguous precordial leads
Evolving: Q waves form; T waves invert
Old MI: Persistent Q waves ± T wave inversion; ST returns to baseline
| Location | Leads with changes | Artery |
|---|---|---|
| Anterior | V1-V4 | LAD |
| Inferior | II, III, aVF | RCA |
| Lateral | I, aVL, V5-V6 | LCx |
| Posterior | ST depression in V1-V3 + tall R in V1 | RCA or LCx |
LVH and RVH
Left Ventricular Hypertrophy (LVH) - Sokolow-Lyon Criteria:
- S wave in V1 + R wave in V5 or V6 > 35 mm
- R wave in aVL > 11 mm
- Associated with strain pattern: ST depression + T wave inversion in lateral leads
Right Ventricular Hypertrophy (RVH):
- Right axis deviation (> +90°)
- Dominant R wave in V1 (R > S in V1)
- Deep S in V5/V6
- P pulmonale may be present
Common Arrhythmias at a Glance
| Arrhythmia | Rate | Rhythm | P Waves | QRS |
|---|---|---|---|---|
| Normal sinus rhythm | 60-100 | Regular | Upright in I, II; before every QRS | Narrow |
| Sinus tachycardia | >100 | Regular | Normal | Narrow |
| Sinus bradycardia | <60 | Regular | Normal | Narrow |
| Atrial fibrillation | Variable (usually fast) | Irregularly irregular | No P waves - fibrillatory baseline | Narrow (unless aberrant) |
| Atrial flutter | Atrial 300; ventricular varies | Regular | Sawtooth flutter waves (best in II, III, aVF) | Narrow; 2:1, 3:1, or 4:1 block |
| SVT (AVNRT) | 150-250 | Very regular | P often hidden in QRS | Narrow |
| Ventricular tachycardia (VT) | 100-250 | Regular | AV dissociation | Wide (≥0.12 sec) |
| Ventricular fibrillation (VF) | Chaotic | Completely irregular | None | Chaotic, no organized QRS |
| Junctional rhythm | 40-60 | Regular | Inverted/absent/retrograde | Narrow |
PART 7: QUICK CLINICAL PEARLS
-
Always check the calibration mark at the start of the ECG strip - should be 10 mm = 1 mV. If it's different, all your voltage measurements will be off.
-
aVR is the mirror of the heart - almost everything normal (P, QRS) is inverted here. ST elevation in aVR can indicate left main or proximal LAD occlusion - a "STEMI equivalent."
-
The rate-corrected QT (QTc) matters more than the raw QT because QT shortens at faster heart rates naturally.
-
Tall R wave in V1 with right axis deviation suggests either RBBB, RVH, posterior MI, or Wolff-Parkinson-White (WPW) - narrow the differential based on clinical context.
-
"Tombstone" ST elevation (massive, convex ST elevation) in anterior leads is a STEMI until proven otherwise - activate the cath lab.
-
Wellens syndrome: biphasic (Type A) or deeply inverted (Type B) T waves in V2-V3 with a pain-free presentation → critical LAD stenosis - do NOT stress test these patients.
-
De Winter T waves: ST depression with tall, symmetrical T waves in V1-V6 → LAD occlusion equivalent; treat as STEMI.
-
Brugada pattern: RSR' in V1-V2 with coved (downsloping) ST elevation → risk of sudden cardiac death from VF.
-
Right heart strain in PE: S1Q3T3 pattern (S wave in I, Q wave and T wave inversion in III) + sinus tachycardia + incomplete RBBB.
-
Hyperkalemia progression: peaked T waves → wide QRS → loss of P waves → sine wave → VF.
PART 8: ECG READING WORKFLOW SUMMARY
Step 1: Rate ──────────────── Fast or slow?
Step 2: Rhythm ─────────────── Regular? P waves present?
Step 3: Axis ───────────────── Normal, LAD, RAD?
Step 4: Intervals ──────────── PR, QRS, QTc within range?
Step 5: P wave morphology ──── LAE, RAE?
Step 6: QRS morphology ─────── Q waves, bundle branch block, LVH?
Step 7: ST / T waves ────────── Elevation, depression, inversion?
Sources: Goldman-Cecil Medicine, 26th Ed. | Guyton & Hall Textbook of Medical Physiology | Harrison's Principles of Internal Medicine, 22nd Ed. | The Harriet Lane Handbook, 23rd Ed. | LITFL ECG Library
That covers everything from the electron-level action potential all the way to recognizing life-threatening patterns. Where would you like to go deeper? Specific arrhythmias, ischemia patterns, the hexaxial reference system, or a worked example of interpreting a real ECG?Here's everything you need to get started - and then some. Let me know if anything needs expanding!
This is a shared conversation. Sign in to Orris to start your own chat.