
ECG
Reading File
The query "ECG" is broad - it could mean basic principles, wave interpretation, arrhythmias, specific findings, or something else. Let me clarify before diving in.
Asking for Preferences
What aspect of ECG are you interested in?
Searching sources...
Finding Sources
Finding Sources
Finding Sources
Reading File
Good - I've found the Harrison's ECG chapter. Let me read the core ECG content from the beginning of that block, plus search for specific ECG topics.
Reading File
Finding Sources
That block starts with neurocysticercosis content - the ECG section is deeper in the file. Let me find the exact line for the ECG chapter in Harrison's and read it.
Finding Sources
Finding Sources
Excellent - I have multiple key sources. Let me read the Harrison's ECG waveforms section (line 1254) and the Goldman-Cecil ECG waves section in parallel, plus Costanzo Physiology for the physiology basis.
Reading File
Reading File
Reading File
Excellent - I have rich content. Now let me read more from Harrison's (arrhythmias, ischemia, axis, hypertrophy sections) and fetch key ECG diagram images.
Reading File
Loading Image
Loading Image
I have excellent content and images. Let me now read the Harrison's content that covers axis, hypertrophy, bundle branch blocks, and the systematic interpretation approach - plus get the MI sequence image.
Reading File
Loading Image
I now have comprehensive content covering the full ECG overview. Let me update todos and write the final synthesized response.# ECG - Full Overview
What is an ECG?
The electrocardiogram (ECG or EKG) is a recording of tiny potential differences on the body surface that reflect the electrical activity of the heart. Because cardiac depolarization and repolarization wavefronts have both direction and magnitude, they can be represented as vectors and recorded from multiple spatial angles simultaneously. - Costanzo Physiology 7th Edition
Cardiac Conduction System (The Basis of the ECG)
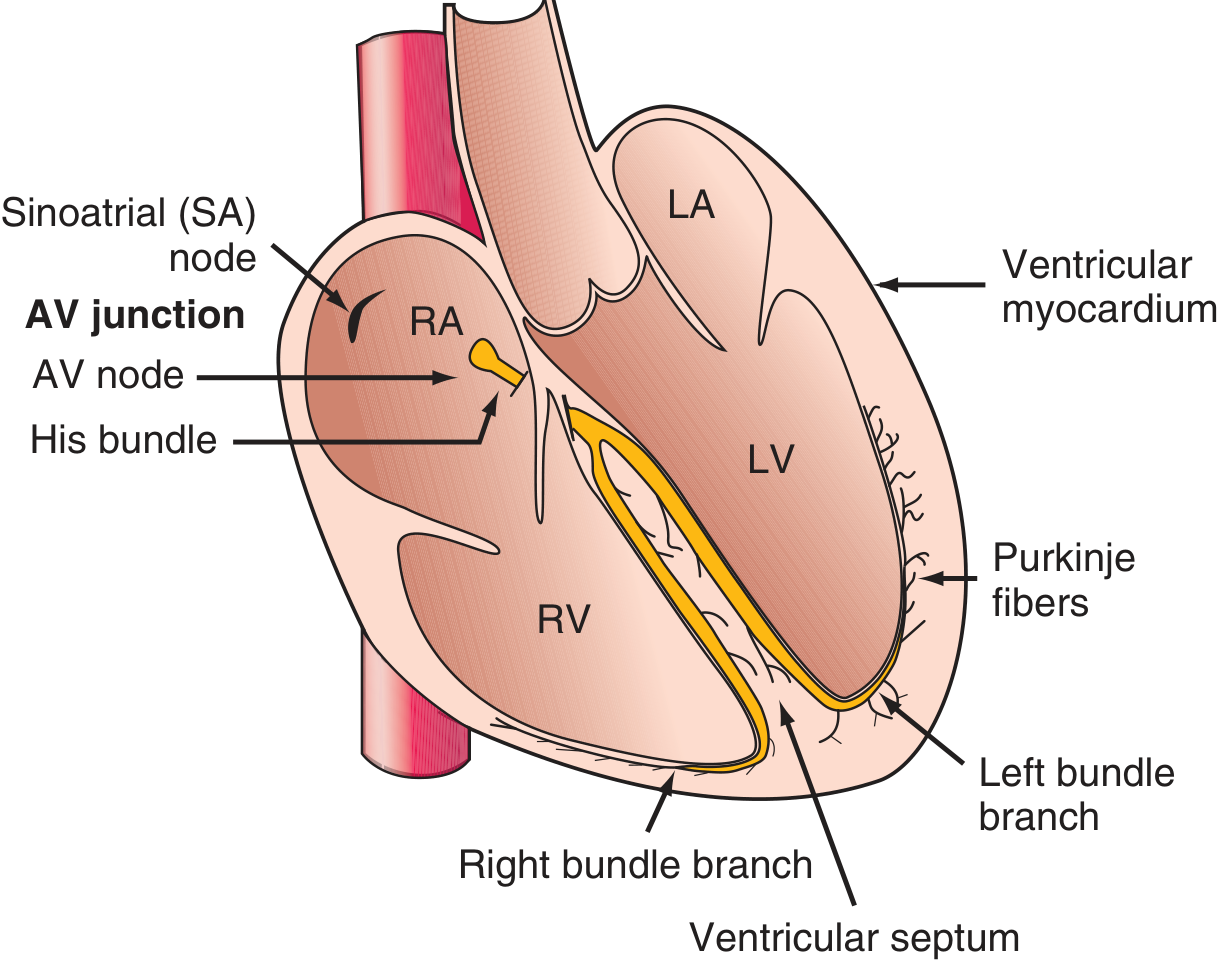
The normal sequence of electrical activation:
- SA node (high lateral right atrium) - dominant pacemaker due to fastest spontaneous depolarization rate
- Impulse spreads through right and left atria (Bachmann bundle speeds conduction to left atrium)
- AV node - physiologic conduction delay (the only normal electrical bridge between atria and ventricles)
- Bundle of His → bifurcates into right bundle branch and left bundle branch (which further divides into left anterior and left posterior fascicles)
- Purkinje fibers → rapid spread to ventricular myocardium (endocardium to epicardium)
The Purkinje system conducts far faster than atrial tissue, which is why the QRS complex (large ventricles) has a similar duration to the P wave (smaller atria). - Harrison's Principles of Internal Medicine 22E
The Basic ECG Waveforms and Intervals

Fig. 4.17 - ECG measured from lead II. (Costanzo Physiology 7th Ed.)
Waves
| Wave | Represents | Notes |
|---|---|---|
| P wave | Atrial depolarization | Duration reflects atrial conduction time. Atrial repolarization is buried under QRS and not seen. |
| Q wave | Initial septal depolarization | Pathologic if >40 ms wide or >25% of R wave height |
| R wave | Main ventricular depolarization | Positive (upward) deflection |
| S wave | Terminal ventricular depolarization | Negative deflection after R |
| T wave | Ventricular repolarization | Normally upright in most leads |
| U wave | Slow repolarization (Purkinje?) | Small, after T wave; prominent in hypokalemia |
| J wave (Osborn wave) | Altered transmural action potential | Seen in hypothermia; convex "hump" at J point |
Intervals and Segments
| Measurement | Normal Values | What It Reflects |
|---|---|---|
| PR interval | 120-200 ms (0.12-0.20 s) | Atrial depolarization + AV node conduction delay |
| QRS duration | ≤100-110 ms | Ventricular depolarization |
| ST segment | Isoelectric (flat) | Corresponds to action potential plateau (phase 2); no net voltage change |
| QT interval | <450 ms (men), <460 ms (women) | Total ventricular depolarization + repolarization |
| RR interval | 600-1000 ms (HR 60-100) | One complete cardiac cycle |
Key physiology link: The QRS upstroke corresponds to action potential phase 0 (rapid Na+ influx). The flat ST segment corresponds to phase 2 (plateau). The T wave corresponds to phase 3 (active repolarization). This is why drugs blocking Na+ channels (e.g., flecainide) widen the QRS, while drugs prolonging phase 3 (e.g., amiodarone, hypocalcemia) lengthen the QT interval. - Harrison's 22E
Paper Speed and Calibration
- Standard speed: 25 mm/s → 1 small box = 40 ms, 1 large box = 200 ms
- Standard calibration: 1 mV = 10 mm (amplitude)
- Heart rate formula: 300 ÷ number of large boxes between R waves (or 1500 ÷ small boxes)
The 12 Leads
The 12 leads each "look" at the heart from a different spatial angle - like 12 different camera positions recording the same electrical events.
6 Limb leads (frontal plane):
- Standard bipolar: I (left arm - right arm), II (left leg - right arm), III (left leg - left arm)
- Augmented unipolar: aVR (right arm), aVL (left arm), aVF (left foot)
6 Precordial (chest) leads (horizontal plane):
- V1-V2: Right ventricle
- V3-V4: Interventricular septum / anterior wall
- V5-V6: Lateral left ventricle
Mean QRS axis (normal: -30° to +90°): Assessed using the frontal limb leads. Left axis deviation (<-30°) is seen with left anterior fascicular block, inferior MI, LVH. Right axis deviation (>+90°) occurs with right ventricular hypertrophy, left posterior fascicular block, lateral MI. - Harrison's 22E, Goldman-Cecil Medicine
Systematic ECG Interpretation (14-Parameter Approach)
According to Harrison's 22E, a systematic approach is essential to avoid errors of omission. Always check:
- Standardization/calibration - confirm 1 mV = 10 mm
- Heart rate (atrial and ventricular)
- Rhythm (regular vs. irregular)
- PR interval (AV conduction)
- QRS duration (intraventricular conduction)
- QT/QTc interval
- Mean QRS axis (frontal plane)
- P wave morphology (atrial enlargement?)
- QRS amplitude (hypertrophy, low voltage)
- Precordial R wave progression (normal V1 to V6 increase)
- Pathologic Q waves (infarction?)
- ST segment (elevation or depression?)
- T wave morphology (inversion, peaked, flat?)
- U waves (prominent?)
Major ECG Patterns and Their Causes
1. Chamber Enlargement / Hypertrophy
| Finding | Cause | ECG Features |
|---|---|---|
| Left atrial enlargement | Mitral stenosis, HTN, LV dysfunction | Broad, notched P ("P mitrale"); P >120 ms in II; deep negative terminal P in V1 |
| Right atrial enlargement | Pulmonary HTN, COPD | Tall, peaked P ("P pulmonale") >2.5 mm in II |
| LVH | HTN, aortic stenosis | Sokolow-Lyon: S in V1 + R in V5/V6 ≥35 mm; ST-T "strain" pattern |
| RVH | Pulmonary HTN, pulmonic stenosis | Right axis deviation; R > S in V1; S persists in V5-V6 |
2. Bundle Branch Blocks
| Block | QRS | V1 Pattern | V6 Pattern |
|---|---|---|---|
| RBBB | ≥120 ms | RSR' ("rabbit ears") | Wide, slurred S |
| LBBB | ≥120 ms | Broad QS or rS | Broad monophasic R, no septal Q |
| LAFB | 100-120 ms (normal) | Normal | Left axis deviation (-45° to -90°) |
| LPFB | Normal | Normal | Right axis deviation (+90° to +120°) |
3. Myocardial Ischemia and Infarction
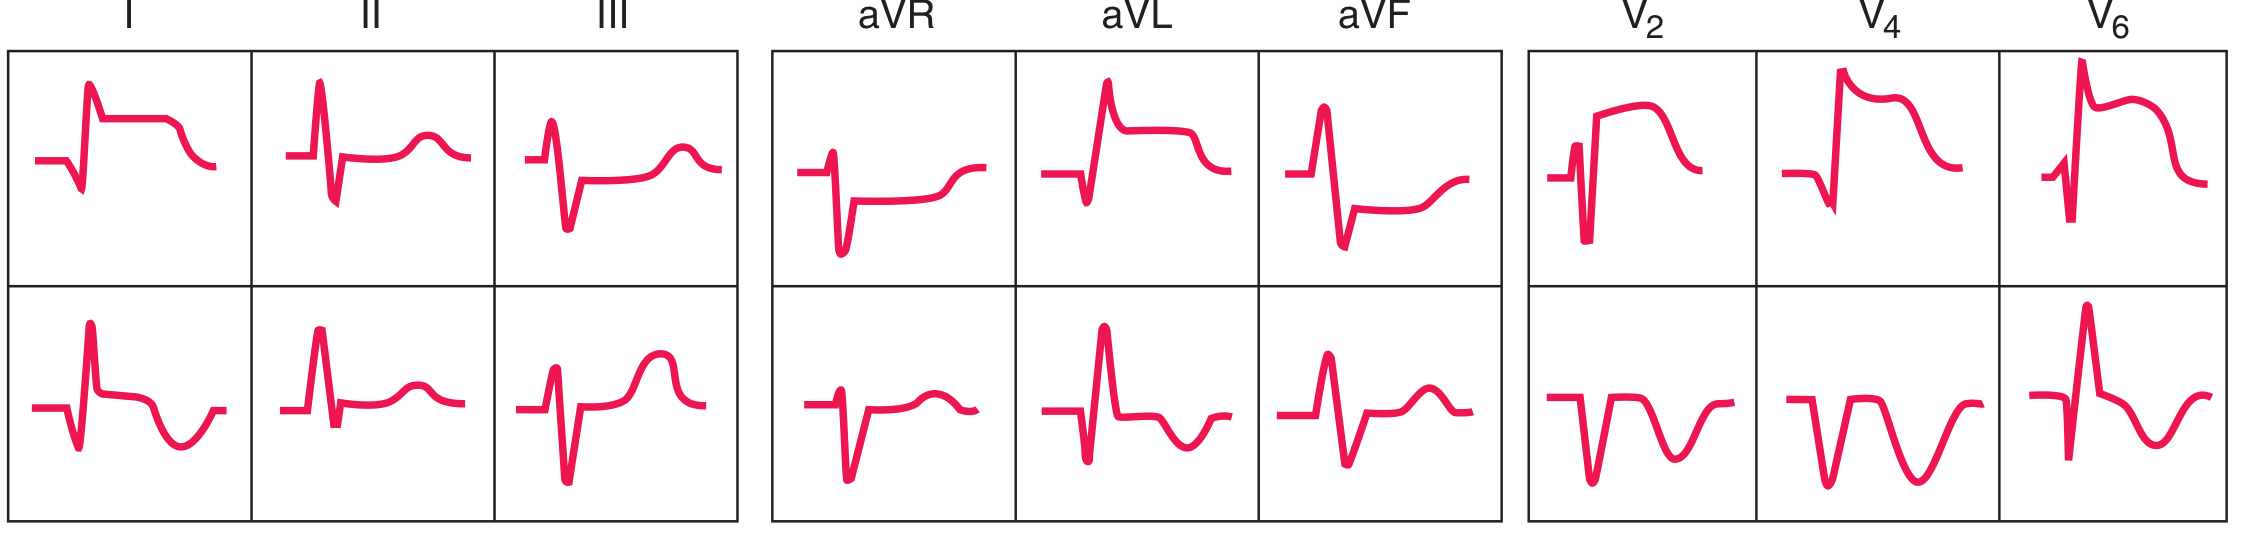
FIGURE 247-13 - Anterior (top) and inferior (bottom) STEMI sequences showing acute ST elevation evolving to Q-wave infarction. (Harrison's 22E)
Evolution of STEMI:
- Hyperacute (minutes): Peaked, tall T waves ("hyperacute T waves")
- Acute (hours): ST elevation (convex/tombstone) in territory leads + reciprocal ST depression opposite
- Evolving (days): Pathologic Q waves develop; ST begins to normalize; T wave inversion
- Old/chronic: Persistent Q waves, T wave may normalize
Territory localization:
| Territory | Leads with Changes | Artery |
|---|---|---|
| Anterior | V1-V4 | LAD |
| Lateral | I, aVL, V5-V6 | LCx |
| Inferior | II, III, aVF | RCA (or LCx) |
| Posterior | Tall R + ST depression in V1-V2 (reciprocal) | RCA or LCx |
| RV | V3R-V4R ST elevation | Proximal RCA |
Reciprocal changes are key: anterior STEMI causes ST depression in II, III, aVF; inferior STEMI causes ST depression in V1-V3.
4. Arrhythmia Patterns
| Rhythm | Rate | Regularity | P waves | PR | QRS |
|---|---|---|---|---|---|
| Normal sinus | 60-100 | Regular | Upright II, inverted aVR | Normal | Normal |
| Sinus tachycardia | >100 | Regular | Normal | Normal | Normal |
| Sinus bradycardia | <60 | Regular | Normal | Normal | Normal |
| Atrial fibrillation | Variable | Irregularly irregular | Absent (fibrillatory baseline) | None | Narrow (unless aberrant) |
| Atrial flutter | 250-350 atrial; 2:1/4:1 ventricular | Regular | Sawtooth pattern (II, III, aVF) | Variable | Narrow |
| SVT (AVNRT) | 150-250 | Regular | Hidden in QRS or just after | Short/retrograde | Narrow |
| VT | >100 | Regular | Dissociated (AV dissociation) | - | Wide (>120 ms) |
| VF | Chaotic | Absent | Absent | - | Chaotic |
| 1° AV block | Normal | Regular | Normal | >200 ms | Normal |
| 2° AV block Mobitz I | Normal | Irregular | Normal | Progressive lengthening → dropped QRS | Normal |
| 2° AV block Mobitz II | Normal | Irregular | Normal | Constant until sudden drop | Normal |
| 3° AV block (complete) | Variable | Regular (atria and ventricles independently) | Normal, no relationship to QRS | Variable | Wide (junctional or ventricular escape) |
5. ST-Segment Changes (Non-Ischemic)
| Cause | ECG Pattern |
|---|---|
| Acute pericarditis | Diffuse (saddle-shaped) ST elevation + PR depression in most leads; no reciprocal changes (except aVR) |
| Early repolarization | Benign concave ST elevation, most prominent V2-V5; "fish-hook" J-point notching |
| Cardiac tamponade | Sinus tachycardia + low QRS voltages + electrical alternans (alternating QRS height) |
| Brugada syndrome | Type 1: coved ST elevation ≥2 mm in V1-V2; associated with risk of sudden death |
| LV aneurysm | Persistent ST elevation weeks after MI |
6. QT Prolongation
The QT interval represents total ventricular repolarization. Prolongation (>450 ms men, >460 ms women) increases risk of torsades de pointes (a polymorphic VT).
Causes of QT prolongation:
- Drugs: Class IA antiarrhythmics (quinidine, procainamide), class III (sotalol, amiodarone), antipsychotics (haloperidol, ziprasidone), macrolides, fluoroquinolones
- Electrolytes: Hypokalemia, hypomagnesemia, hypocalcemia
- Congenital: Long QT syndrome (LQTS 1, 2, 3 - channelopathies)
- Other: Hypothermia, hypothyroidism, subarachnoid hemorrhage
Causes of QT shortening: Hypercalcemia, digoxin, hereditary short QT syndrome
7. Metabolic / Drug Effects
| Condition | Key ECG Change |
|---|---|
| Hyperkalemia | Peaked T → wide QRS → loss of P waves → sine wave → VF |
| Hypokalemia | Flat T waves + prominent U waves; QT prolongation |
| Hypercalcemia | Short QT (short ST segment) |
| Hypocalcemia | Long QT (prolonged ST segment) |
| Digoxin toxicity | "Scooped" ST depression; bradycardia; AV block; bidirectional VT |
| Tricyclic overdose | Wide QRS + prolonged QT + sinus tachycardia + right axis deviation |
| Hypothermia | Osborn (J) waves; sinus bradycardia; prolonged intervals |
Quick Reference: Normal ECG Values
| Parameter | Normal Range |
|---|---|
| Heart rate | 60-100 bpm |
| PR interval | 120-200 ms |
| QRS duration | ≤110 ms |
| QT (men) | <450 ms |
| QT (women) | <460 ms |
| QRS axis | -30° to +90° |
| P wave duration | <120 ms |
| P wave amplitude | <2.5 mm |
| R-wave progression | V1 (small r) → V5-V6 (dominant R) |
Sources: Harrison's Principles of Internal Medicine 22E (2025); Goldman-Cecil Medicine International Edition; Costanzo Physiology 7th Edition; Harrison's 22E Chapter 247 (ECG)
Leads of ecg
The 12-lead ECG uses 10 electrodes placed on limbs and chest to record electrical activity from 12 different angles. Limb leads look at the frontal plane; chest leads look at the horizontal plane.
Searching sources...
Finding Sources
Finding Sources
Reading File
Reading File
Good - now let me fetch the key lead diagrams (hexaxial diagram and chest lead placement diagram) and read the precordial lead placement details.
Loading Image
Loading Image
Finding Sources
Finding Sources
Reading File
Loading Image
Reading File
Loading Image
I now have all the content and images needed for a comprehensive, well-illustrated response.
ECG Leads - Complete Overview
The 12-lead ECG uses 10 electrodes to generate 12 views of the heart's electrical activity. Each lead is like a different camera angle - recording the same electrical events from a different spatial direction. A positive (upward) deflection occurs when depolarization moves toward that lead's positive pole; a negative deflection when it moves away. - Harrison's Principles of Internal Medicine 22E
The Two Groups of Leads
The 12 leads split into two groups based on the plane they record:
| Group | Leads | Plane Recorded |
|---|---|---|
| Limb leads (6) | I, II, III, aVR, aVL, aVF | Frontal plane (up/down, left/right) |
| Precordial leads (6) | V1, V2, V3, V4, V5, V6 | Horizontal plane (front/back, left/right) |
Group 1: Limb Leads (Frontal Plane)
Einthoven's Triangle - Standard Bipolar Leads (I, II, III)
These measure the voltage difference between two limb electrodes:
| Lead | Positive Pole | Negative Pole | Einthoven's equation |
|---|---|---|---|
| I | Left arm (LA) | Right arm (RA) | LA - RA |
| II | Left leg (LL) | Right arm (RA) | LL - RA |
| III | Left leg (LL) | Left arm (LA) | LL - LA |
Einthoven's Law: Lead I + Lead III = Lead II (at any instant)
Augmented Unipolar Limb Leads (aVR, aVL, aVF)
These measure potential at one limb electrode relative to the combined average of the other two (Wilson's central terminal):
| Lead | Positive Pole | Looks At |
|---|---|---|
| aVR | Right arm | Base of heart (cavity); normally negative - all normal deflections point away from it |
| aVL | Left arm | High lateral wall of LV |
| aVF | Left foot | Inferior wall of LV (diaphragmatic surface) |
The "a" = augmented (signal is boosted ~50% because one electrode is disconnected, increasing amplitude)
Hexaxial Reference System (Frontal Plane Axis)
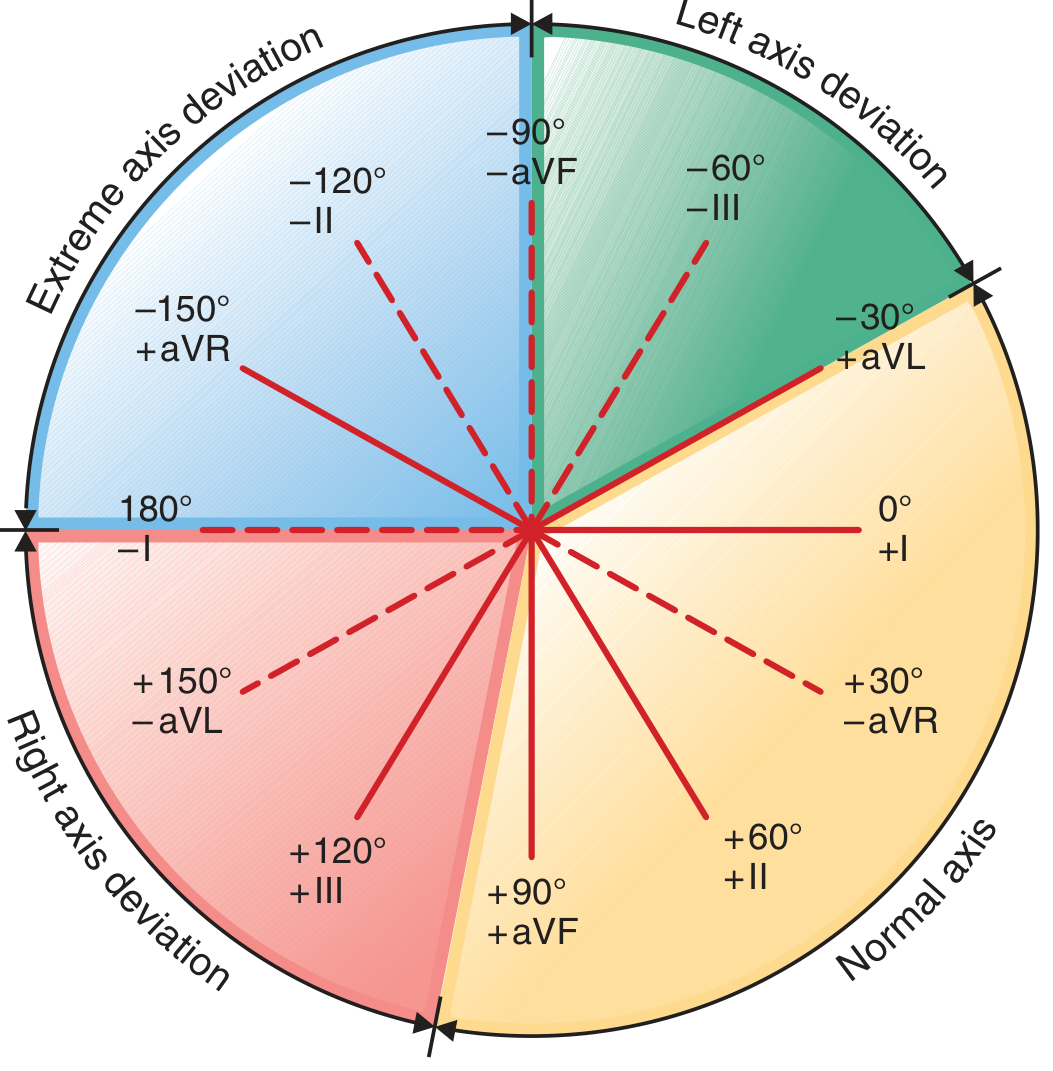
FIGURE 247-4 - Hexaxial diagram showing each limb lead's angular orientation. Normal QRS axis = -30° to +90° (yellow zone). - Harrison's 22E
Each limb lead sits at a specific angle around the heart:
| Lead | Angle |
|---|---|
| I | 0° |
| II | +60° |
| III | +120° |
| aVF | +90° |
| aVL | -30° |
| aVR | -150° |
Axis deviation:
- Normal: -30° to +90°
- Left axis deviation (LAD): -30° to -90° → causes: LAFB, inferior MI, LVH, LBBB
- Right axis deviation (RAD): +90° to +180° → causes: RVH, LPFB, lateral MI, RBBB, cor pulmonale
- Extreme axis: -90° to ±180° → causes: severe RVH, VT, dextrocardia
Quick axis check: If QRS is positive in both I and aVF → normal axis. If positive in I, negative in aVF → LAD. If negative in I, positive in aVF → RAD.
Group 2: Precordial (Chest) Leads - Horizontal Plane
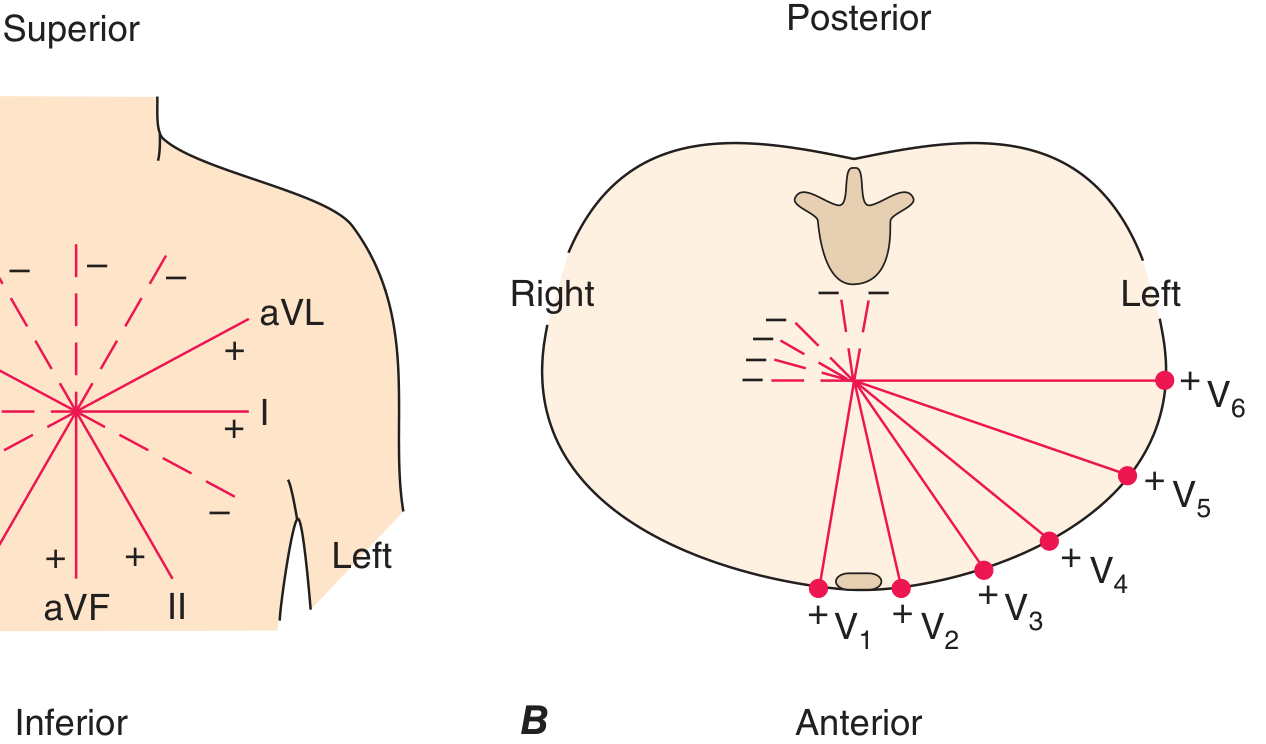
FIGURE 247-3B - Horizontal plane leads V1-V6 encircling the heart. - Harrison's 22E
Electrode Placement
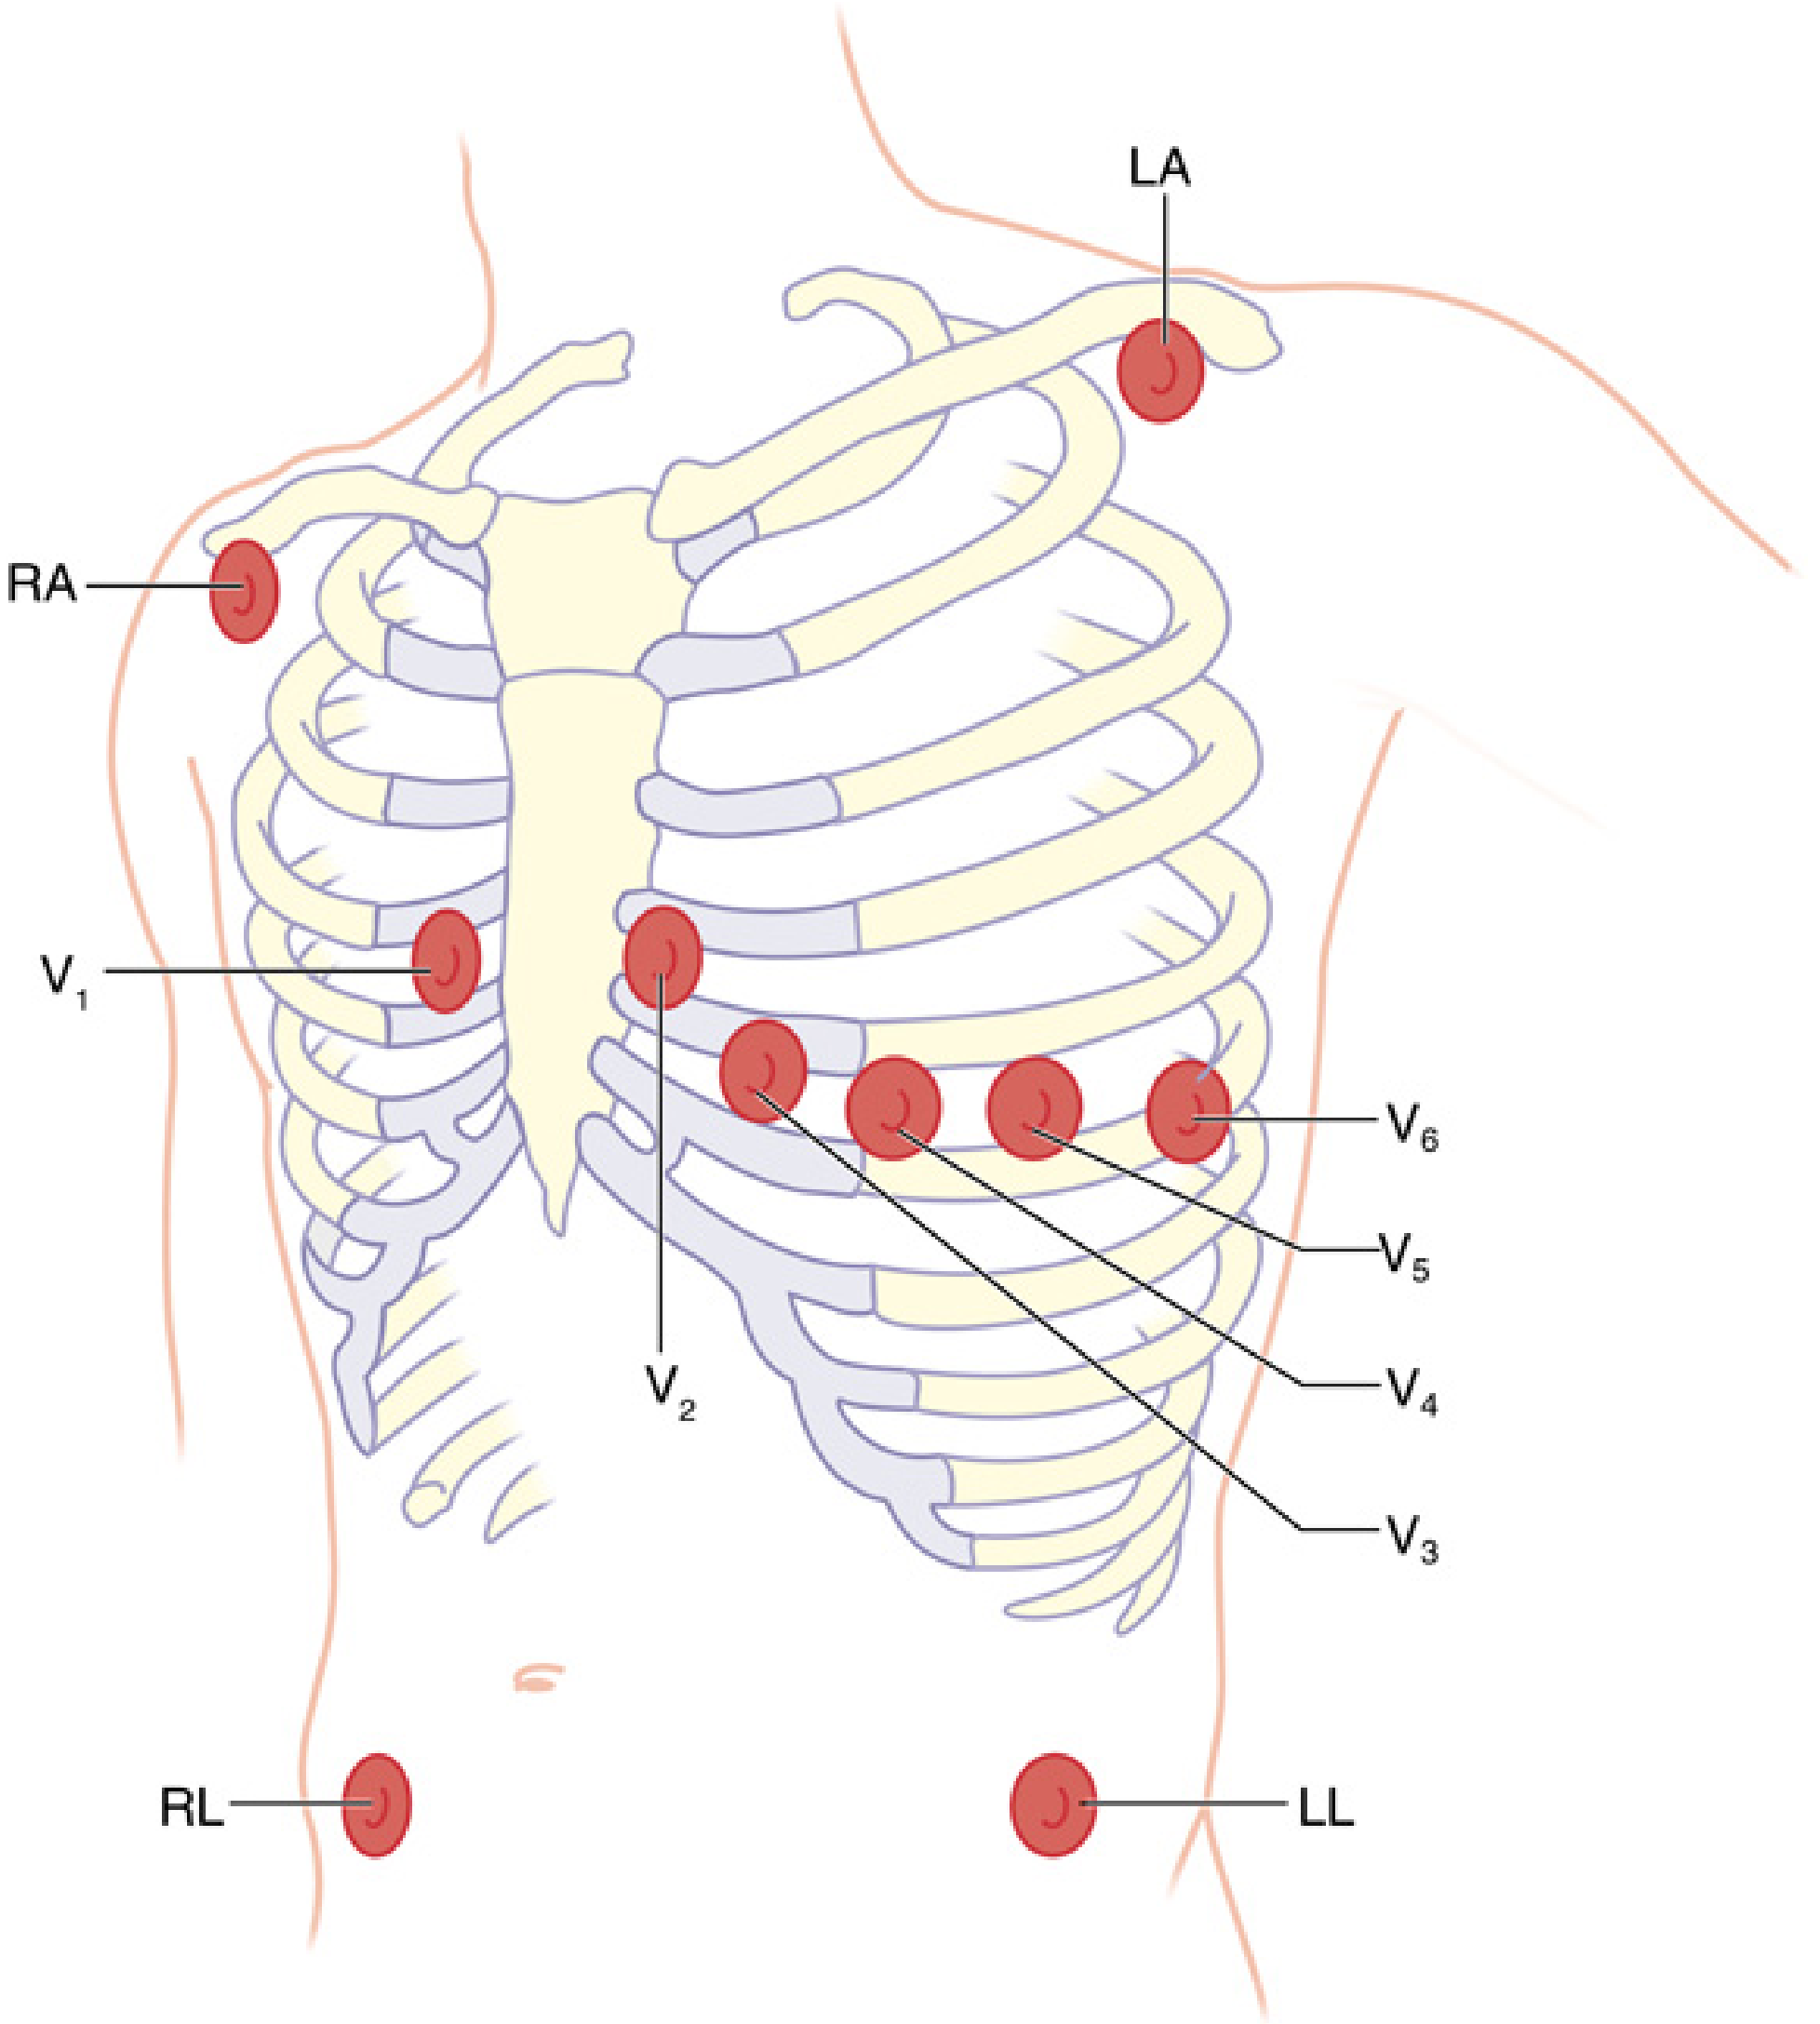
FIG. 32.4 - Proper anatomic location of all 10 electrodes. - Miller's Anesthesia 10e
| Lead | Position | Region of Heart Viewed |
|---|---|---|
| V1 | 4th intercostal space, right sternal border | Right ventricle / septum |
| V2 | 4th intercostal space, left sternal border | Right ventricle / septum |
| V3 | Between V2 and V4 (diagonal) | Anterior septum / anterior wall |
| V4 | 5th intercostal space, midclavicular line | Anterior LV apex |
| V5 | Same level as V4, anterior axillary line | Lateral LV |
| V6 | Same level as V4, midaxillary line | Lateral LV |
How to find the positions: Locate the sternal angle of Louis (manubriosternal junction) → the rib immediately below is the 2nd rib → count down to the 4th and 5th intercostal spaces. V4 sits at the 5th ICS midclavicular line. V5 and V6 move horizontally lateral from V4. - Miller's Anesthesia 10e
What Each Lead "Sees" - Coronary Territory Correlation
| Cardiac Region | Leads | Artery |
|---|---|---|
| Inferior wall | II, III, aVF | RCA (right coronary artery) |
| Lateral wall | I, aVL, V5, V6 | LCx (left circumflex) |
| Anterior wall | V1-V4 | LAD (left anterior descending) |
| Septal | V1-V2 | Septal perforators of LAD |
| High lateral | I, aVL | Diagonal branch of LAD or LCx |
| Posterior wall | V1-V2 (reciprocal - tall R + ST depression) | RCA or LCx |
Normal R-Wave Progression Across Precordial Leads
As you move from V1 → V6, the R wave should progressively increase in height (R-wave progression):
| Lead | Normal QRS | Reason |
|---|---|---|
| V1 | Small r, deep S (rS pattern) | Right ventricle faces this lead; LV depolarization moves away |
| V2 | r grows slightly | Transitional |
| V3 | Transitional (r ≈ S) | |
| V4 | R > S (transition zone) | LV now dominates |
| V5 | Tall R, small S | LV lateral wall |
| V6 | Tall R, small or no S | LV lateral wall |
Transition zone (where R = S, i.e., equiphasic) normally occurs at V3 or V4. Poor R-wave progression (rS in V1-V4) suggests anterior MI, LVH, or LBBB.
Additional / Supplemental Leads
| Lead | Position | Use |
|---|---|---|
| V4R | Mirror of V4 on right side (4th ICS, right MCL) | Best for right ventricular MI (inferior STEMI with RV involvement) |
| V7 | Posterior axillary line | Posterior MI diagnosis |
| V8 | Tip of left scapula | Posterior MI |
| V9 | Left paravertebral | Posterior MI |
| Right-sided leads V3R-V6R | Mirror image positions on right chest | RV ischemia/infarction |
AHA Color Coding for Electrode Wires
| Electrode | Color (AHA/US) |
|---|---|
| Right arm (RA) | White |
| Left arm (LA) | Black |
| Right leg (RL) | Green (ground) |
| Left leg (LL) | Red |
| Precordial (V) | Brown/red |
Note: The international IEC color code differs from the AHA system. - Miller's Anesthesia 10e
Key Points to Remember
- 10 electrodes → 12 leads (6 limb + 6 chest). No new electrodes are needed for the augmented leads - they are calculated from the same 4 limb electrodes.
- aVR is the "reciprocal" lead - it looks at the cavity of the heart from the right shoulder. ST elevation in aVR with diffuse ST depression suggests left main or proximal LAD occlusion.
- V5 is the most sensitive single lead for ischemia during monitoring; mid-precordial leads (V3-V5) are best for detecting LAD ischemia.
- Lead II is the best for rhythm analysis (P waves are most clearly visible; it runs parallel to the normal P-wave vector).
- Right leg (RL/green) electrode is purely a ground - its placement does not affect any lead recording.
Sources: Harrison's Principles of Internal Medicine 22E (2025), Miller's Anesthesia 10e, Goldman-Cecil Medicine International Edition
This is a shared conversation. Sign in to Orris to start your own chat.