Tell me everything about phenytoin drug as much as you can from all apsects

Reading File
Finding Sources
Finding Sources
Searching PubMed

phenytoin pharmacology clinical use

Searching Images

phenytoin mechanism of action sodium channel antiepileptic drug
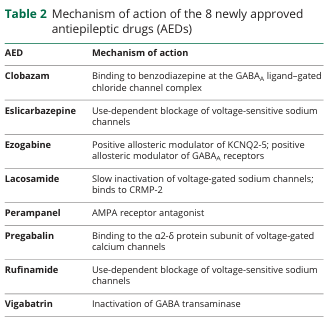
Table 2 Mechanism of action of the 8 newly approved antiepileptic drugs (AEDs)
<table><thead><tr><th>AED</th><th>Mechanism of action</th></tr></thead><tbody><tr><td>Clobazam</td><td>Binding to benzodiazepine at the GABA<sub>A</sub> ligand-gated chloride channel complex</td></tr><tr><td>Eslicarbazepine</td><td>Use-dependent blockage of voltage-sensitive sodium channels</td></tr><tr><td>Ezogabine</td><td>Positive allosteric modulator of KCNQ2-5; positive allosteric modulator of GABA<sub>A</sub> receptors</td></tr><tr><td>Lacosamide</td><td>Slow inactivation of voltage-gated sodium channels; binds to CRMP-2</td></tr><tr><td>Perampanel</td><td>AMPA receptor antagonist</td></tr><tr><td>Pregabalin</td><td>Binding to the α2-δ protein subunit of voltage-gated calcium channels</td></tr><tr><td>Rufinamide</td><td>Use-dependent blockage of voltage-sensitive sodium channels</td></tr><tr><td>Vigabatrin</td><td>Inactivation of GABA transaminase</td></tr></tbody></table>
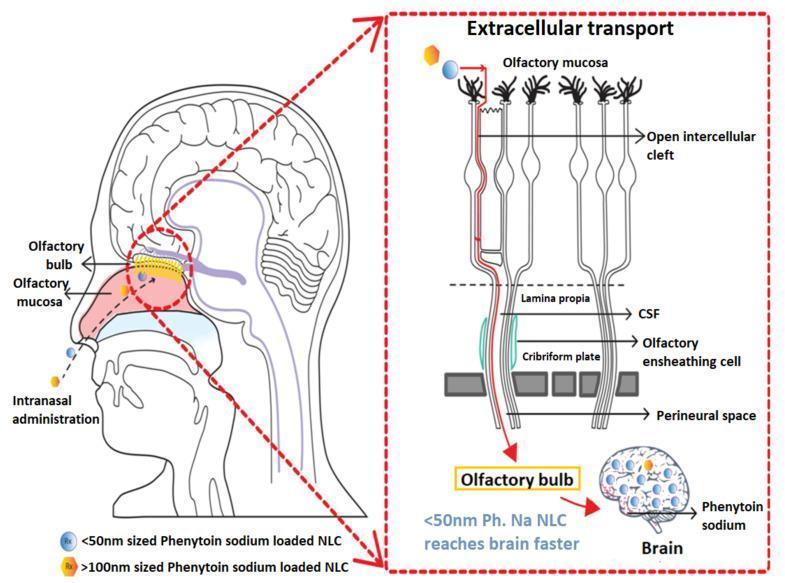
Table 2 Mechanism of action of the 8 newly approved antiepileptic drugs (AEDs) <table><thead><tr><th>AED</th><th>Mechanism of action</th></tr></thead><tbody><tr><td>Clobazam</td><td>Binding to benzodiazepine at the GABA<sub>A</sub> ligand-gated chloride channel complex</td></tr><tr><td>Eslicarbazepine</td><td>Use-dependent blockage of voltage-sensitive sodium channels</td></tr><tr><td>Ezogabine</td><td>Positive allosteric modulator of KCNQ2-5; positive allosteric modulator of GABA<sub>A</sub> receptors</td></tr><tr><td>Lacosamide</td><td>Slow inactivation of voltage-gated sodium channels; binds to CRMP-2</td></tr><tr><td>Perampanel</td><td>AMPA receptor antagonist</td></tr><tr><td>Pregabalin</td><td>Binding to the α2-δ protein subunit of voltage-gated calcium channels</td></tr><tr><td>Rufinamide</td><td>Use-dependent blockage of voltage-sensitive sodium channels</td></tr><tr><td>Vigabatrin</td><td>Inactivation of GABA transaminase</td></tr></tbody></table>

A medical schematic diagram illustrating the direct nose-to-brain delivery of phenytoin sodium loaded Nanostructured Lipid Carriers (NLCs) via the olfactory epithelial pathway. The illustration is divided into a sagittal anatomical view of the human head and a detailed inset of the cellular transport mechanism. The primary anatomical view shows the route of intranasal administration with NLCs depositing on the olfactory mucosa. The inset highlights the extracellular transport mechanism through the olfactory epithelium. It depicts NLCs of different sizes (<50nm and >100nm) moving through open intercellular clefts in the olfactory mucosa, traversing the lamina propria, and crossing the cribriform plate. The diagram shows the particles being transported through the perineural space and along olfactory ensheathing cells to reach the olfactory bulb and eventually the brain. Annotations specify that the smaller <50nm phenytoin sodium NLCs reach the brain faster than larger particles. This educational visual explains the pathophysiology and pharmacology of bypass-blood-brain-barrier drug delivery systems for acute seizure management.
A medical schematic diagram illustrating the direct nose-to-brain delivery of phenytoin sodium loaded Nanostructured Lipid Carriers (NLCs) via the olfactory epithelial pathway. The illustration is divided into a sagittal anatomical view of the human head and a detailed inset of the cellular transport mechanism. The primary anatomical view shows the route of intranasal administration with NLCs depositing on the olfactory mucosa. The inset highlights the extracellular transport mechanism through the olfactory epithelium. It depicts NLCs of different sizes (<50nm and >100nm) moving through open intercellular clefts in the olfactory mucosa, traversing the lamina propria, and crossing the cribriform plate. The diagram shows the particles being transported through the perineural space and along olfactory ensheathing cells to reach the olfactory bulb and eventually the brain. Annotations specify that the smaller <50nm phenytoin sodium NLCs reach the brain faster than larger particles. This educational visual explains the pathophysiology and pharmacology of bypass-blood-brain-barrier drug delivery systems for acute seizure management.

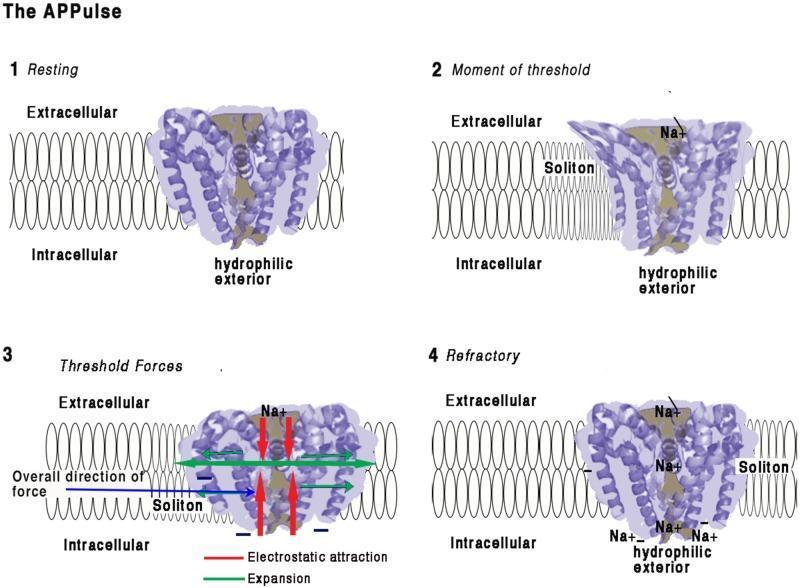
This pathophysiology diagram illustrates the four-stage mechanism of a voltage-gated sodium (Na+) ion channel embedded in a lipid bilayer, focusing on the mechanical and electrostatic changes during depolarization. (1) Resting: The channel's coiled helices are closed, maintaining an electrostatic insulating seal across the 10 nm membrane. (2) Moment of Threshold: An approaching membrane soliton (mechanical wave) exerts pressure, displacing helices and disrupting the electrical insulation. This allows Na+ ions to enter the pore and interact with hydrophilic, negatively charged interior surfaces. (3) Threshold Forces: Inward Na+ influx creates electrostatic attraction (red arrows) toward the intracellular space. Mechanical 'iris-like' opening and contraction occur, causing lateral membrane expansion (green arrows) and a net intracellular force vector (blue arrow). (4) Refractory: Positive charge equalization occurs on the intracellular side, leading to pore closure. The channel remains in a refractory state with localized Na+ accumulation until charges are cleared by diffusion, preventing immediate reactivation.
This pathophysiology diagram illustrates the four-stage mechanism of a voltage-gated sodium (Na+) ion channel embedded in a lipid bilayer, focusing on the mechanical and electrostatic changes during depolarization. (1) Resting: The channel's coiled helices are closed, maintaining an electrostatic insulating seal across the 10 nm membrane. (2) Moment of Threshold: An approaching membrane soliton (mechanical wave) exerts pressure, displacing helices and disrupting the electrical insulation. This allows Na+ ions to enter the pore and interact with hydrophilic, negatively charged interior surfaces. (3) Threshold Forces: Inward Na+ influx creates electrostatic attraction (red arrows) toward the intracellular space. Mechanical 'iris-like' opening and contraction occur, causing lateral membrane expansion (green arrows) and a net intracellular force vector (blue arrow). (4) Refractory: Positive charge equalization occurs on the intracellular side, leading to pore closure. The channel remains in a refractory state with localized Na+ accumulation until charges are cleared by diffusion, preventing immediate reactivation.

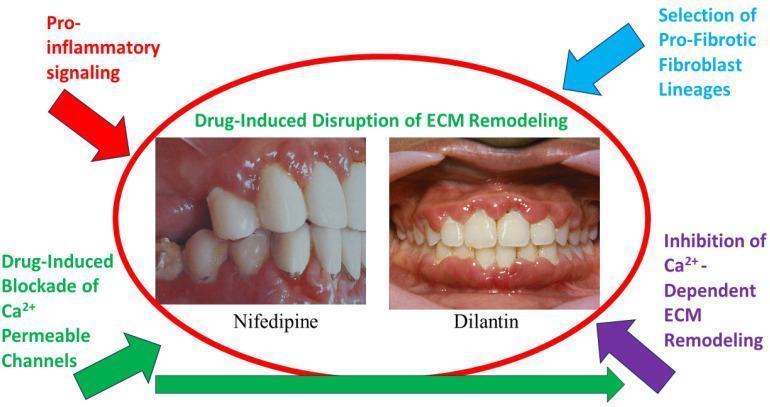
This medical visual combines clinical intraoral photographs with a conceptual diagram to illustrate drug-induced gingival overgrowth (DIGO). The central photographs compare the gingival manifestations of two specific pharmacological agents: Nifedipine (a calcium channel blocker) and Dilantin (Phenytoin, an anticonvulsant). The Nifedipine clinical image displays erythematous, swollen gingival margins with moderate hyperplasia. The Dilantin image demonstrates more severe, generalized gingival overgrowth characterized by bulbous interdental papillae and extensive coverage of the clinical crowns by thickened, lobulated gingival tissue. Surrounding these images is a pathophysiological flow diagram explaining the mechanism of extracellular matrix (ECM) disruption. Key educational concepts mapped include the drug-induced blockade of calcium-permeable channels (such as TRPV4), the inhibition of calcium-dependent ECM remodeling, and the selection of pro-fibrotic fibroblast lineages. The diagram highlights how pro-inflammatory signaling synergizes with these drug effects to disturb the homeostatic balance of collagen synthesis and degradation in periodontal tissues, leading to the observed pathological tissue enlargement.

This medical visual combines clinical intraoral photographs with a conceptual diagram to illustrate drug-induced gingival overgrowth (DIGO). The central photographs compare the gingival manifestations of two specific pharmacological agents: Nifedipine (a calcium channel blocker) and Dilantin (Phenytoin, an anticonvulsant). The Nifedipine clinical image displays erythematous, swollen gingival margins with moderate hyperplasia. The Dilantin image demonstrates more severe, generalized gingival overgrowth characterized by bulbous interdental papillae and extensive coverage of the clinical crowns by thickened, lobulated gingival tissue. Surrounding these images is a pathophysiological flow diagram explaining the mechanism of extracellular matrix (ECM) disruption. Key educational concepts mapped include the drug-induced blockade of calcium-permeable channels (such as TRPV4), the inhibition of calcium-dependent ECM remodeling, and the selection of pro-fibrotic fibroblast lineages. The diagram highlights how pro-inflammatory signaling synergizes with these drug effects to disturb the homeostatic balance of collagen synthesis and degradation in periodontal tissues, leading to the observed pathological tissue enlargement.

Reading File
Reading File
Reading File
Reading File
Reading File
Reading File
Reading File
Reading File
Reading File
Reading File
Searching Images

gingival hyperplasia phenytoin side effect
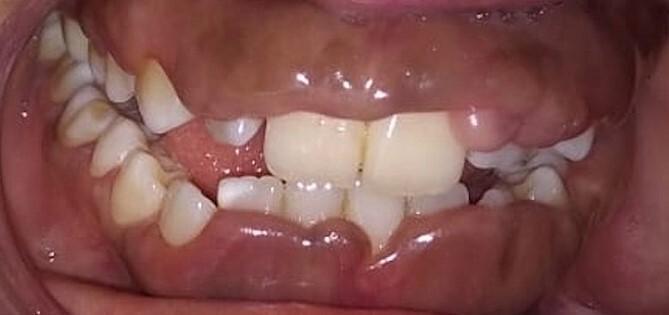
This clinical intraoral photograph demonstrates severe, generalized gingival enlargement, consistent with medication-induced gingival overgrowth (specifically phenytoin-induced). The gingiva exhibits significant hypertrophy and puffiness, primarily localized to the maxillary and mandibular anterior regions. The tissue is characterized by a distinctive bluish-red discoloration and a smooth, shiny surface texture indicating underlying edema. The hyperplastic gingiva significantly obscures the dental crowns, covering approximately two-thirds of the tooth surfaces. This presentation illustrates the classic clinical manifestation of drug-induced gingival hyperplasia, which often results in altered aesthetics, increased risk of periodontal disease due to difficult oral hygiene, and tissue friability during mastication. This image serves as a high-quality educational resource for dental and medical professionals studying oral pathology and the systemic side effects of anticonvulsant therapy.
This clinical intraoral photograph demonstrates severe, generalized gingival enlargement, consistent with medication-induced gingival overgrowth (specifically phenytoin-induced). The gingiva exhibits significant hypertrophy and puffiness, primarily localized to the maxillary and mandibular anterior regions. The tissue is characterized by a distinctive bluish-red discoloration and a smooth, shiny surface texture indicating underlying edema. The hyperplastic gingiva significantly obscures the dental crowns, covering approximately two-thirds of the tooth surfaces. This presentation illustrates the classic clinical manifestation of drug-induced gingival hyperplasia, which often results in altered aesthetics, increased risk of periodontal disease due to difficult oral hygiene, and tissue friability during mastication. This image serves as a high-quality educational resource for dental and medical professionals studying oral pathology and the systemic side effects of anticonvulsant therapy.

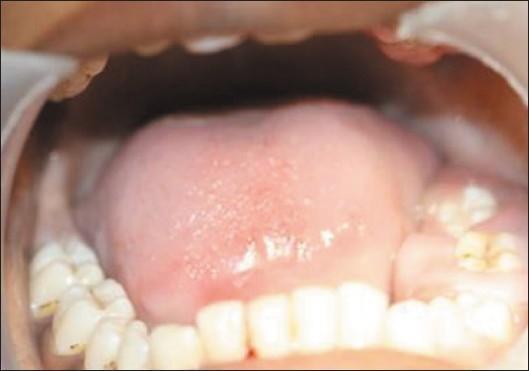
This clinical intraoral photograph demonstrates significant localized gingival hyperplasia on the left side of the mandibular arch. The image shows a bulbous, pale pink, and firm enlargement of the gingival tissue. The overgrowth is most pronounced around the molar region, where the tissue extensively covers both the facial and lingual surfaces of the teeth, leaving only the occlusal surfaces visible. The surface of the hyperplastic tissue appears smooth with no secondary inflammation or significant color change, although the sheer volume of the enlargement distorts the normal contour of the jaw. This presentation is characteristic of idiopathic gingival fibromatosis or drug-induced gingival overgrowth, resulting in pseudo-pockets and clinical obscuration of the crown anatomy. The right side of the mandible appears unaffected, highlighting the unilateral nature of this specific clinical case.

This clinical intraoral photograph demonstrates significant localized gingival hyperplasia on the left side of the mandibular arch. The image shows a bulbous, pale pink, and firm enlargement of the gingival tissue. The overgrowth is most pronounced around the molar region, where the tissue extensively covers both the facial and lingual surfaces of the teeth, leaving only the occlusal surfaces visible. The surface of the hyperplastic tissue appears smooth with no secondary inflammation or significant color change, although the sheer volume of the enlargement distorts the normal contour of the jaw. This presentation is characteristic of idiopathic gingival fibromatosis or drug-induced gingival overgrowth, resulting in pseudo-pockets and clinical obscuration of the crown anatomy. The right side of the mandible appears unaffected, highlighting the unilateral nature of this specific clinical case.

Searching Images

fetal hydantoin syndrome teratogenicity antiepileptic
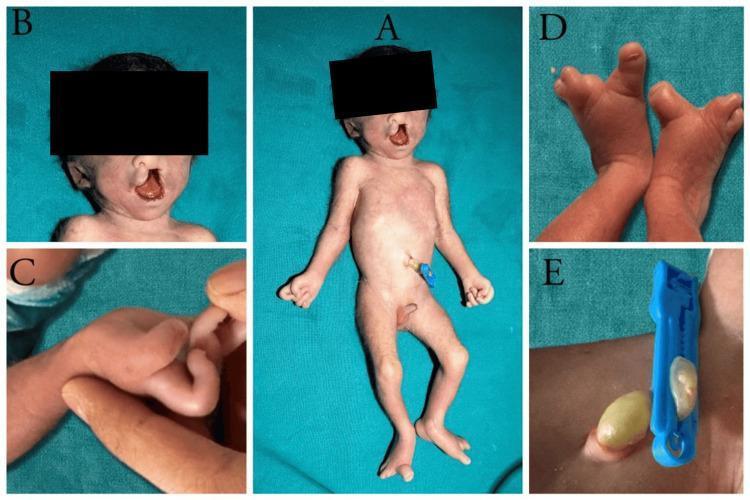
A multi-panel clinical photograph of a neonate illustrating various congenital anomalies associated with Fetal Hydantoin Syndrome. Panel A provides a full-body view showing a two-vessel umbilical cord (single umbilical artery) and dysmorphic features. Panel B (facial close-up) highlights a complete midline cleft lip and palate, a broad nasal bridge, and low-set ears; the ocular region is obscured for privacy but clinical context indicates hypertelorism. Panel C demonstrates hand abnormalities, including hypoplastic distal phalanges and digital contractures. Panel D focuses on the lower extremities, showing oligosyndactyly (reduction in digit number with fusion) and absent distal phalanges in bilateral feet. Panel E provides a close-up of the umbilical cord insertion with a medical clamp, confirming the presence of a single umbilical artery. These visual findings serve as clinical markers for teratogenic exposure to phenytoin, emphasizing phenotypic variations in craniofacial and limb development. The presentation is intended for medical education regarding dysmorphology and embryological disorders.
A multi-panel clinical photograph of a neonate illustrating various congenital anomalies associated with Fetal Hydantoin Syndrome. Panel A provides a full-body view showing a two-vessel umbilical cord (single umbilical artery) and dysmorphic features. Panel B (facial close-up) highlights a complete midline cleft lip and palate, a broad nasal bridge, and low-set ears; the ocular region is obscured for privacy but clinical context indicates hypertelorism. Panel C demonstrates hand abnormalities, including hypoplastic distal phalanges and digital contractures. Panel D focuses on the lower extremities, showing oligosyndactyly (reduction in digit number with fusion) and absent distal phalanges in bilateral feet. Panel E provides a close-up of the umbilical cord insertion with a medical clamp, confirming the presence of a single umbilical artery. These visual findings serve as clinical markers for teratogenic exposure to phenytoin, emphasizing phenotypic variations in craniofacial and limb development. The presentation is intended for medical education regarding dysmorphology and embryological disorders.

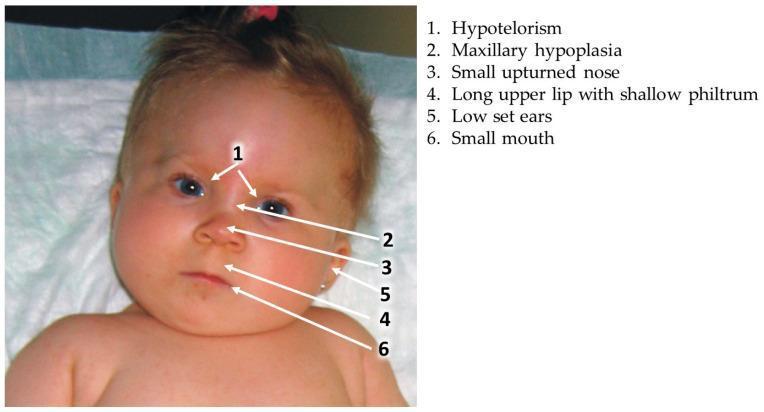
Clinical photograph of an infant demonstrating facial dysmorphism characteristic of Fetal Valproate Syndrome (VPA syndrome) or Antiepileptic Drug Syndrome. The image includes numerical annotations (1–6) highlighting specific diagnostic features: 1) Hypotelorism, indicated by decreased distance between the eyes; 2) Maxillary (midface) hypoplasia, evidenced by a flat nasal bridge; 3) A small, upturned nose; 4) A long, thin upper lip accompanied by a shallow, poorly defined philtrum; 5) Low-set ears; and 6) A small mouth with downturned angles. The educational focus is on the teratogenic effects of prenatal valproic acid exposure on craniofacial development. This visual serves as a reference for clinical genetics and pediatrics in identifying the phenotype of antiepileptic drug embryopathy.

Clinical photograph of an infant demonstrating facial dysmorphism characteristic of Fetal Valproate Syndrome (VPA syndrome) or Antiepileptic Drug Syndrome. The image includes numerical annotations (1–6) highlighting specific diagnostic features: 1) Hypotelorism, indicated by decreased distance between the eyes; 2) Maxillary (midface) hypoplasia, evidenced by a flat nasal bridge; 3) A small, upturned nose; 4) A long, thin upper lip accompanied by a shallow, poorly defined philtrum; 5) Low-set ears; and 6) A small mouth with downturned angles. The educational focus is on the teratogenic effects of prenatal valproic acid exposure on craniofacial development. This visual serves as a reference for clinical genetics and pediatrics in identifying the phenotype of antiepileptic drug embryopathy.

Your credits are exhausted. You can purchase a top-up or subscribe to a plan to continue using Orris. If you're already subscribed, your daily credits will reset tomorrow.
This is a shared conversation. Sign in to Orris to start your own chat.