
what do u mean by far point comes near in myopia
far point myopia definition optics explanation
far point myopia diagram optics eye
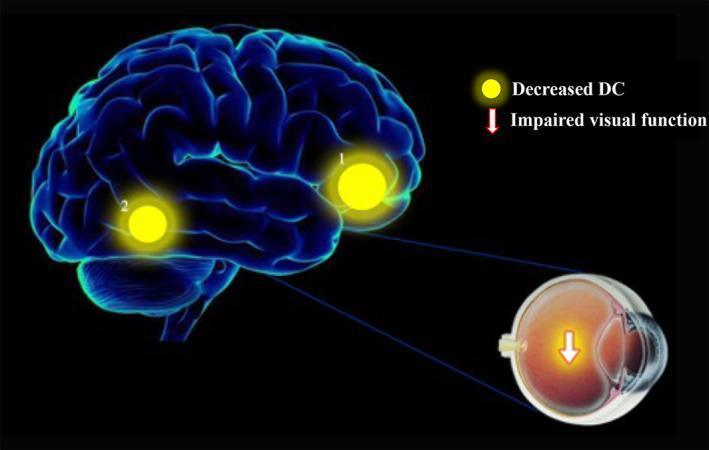
A pathophysiology diagram illustrating the relationship between pathological myopia (PM) and functional brain changes. The visual includes a 3D rendering of the human brain and a cross-sectional illustration of the human eye. Two distinct yellow circular highlights, labeled '1' and '2', identify regions of decreased Degree Centrality (DC) in patients with PM compared to healthy controls. Region 1 is located in the right anterior cingulum (Brodmann area 11), and region 2 corresponds to the right fusiform gyrus (Brodmann area 37). Lines connect these cerebral regions to the ocular model, which contains a downward-pointing arrow and an orange glow in the posterior segment (fundus), symbolizing impaired visual function and pathological retinal changes. This image serves to demonstrate how chronic visual impairment in high myopia can lead to neuroplastic alterations and decreased functional connectivity in specific cortical and subcortical pathways involved in visual processing and executive function.
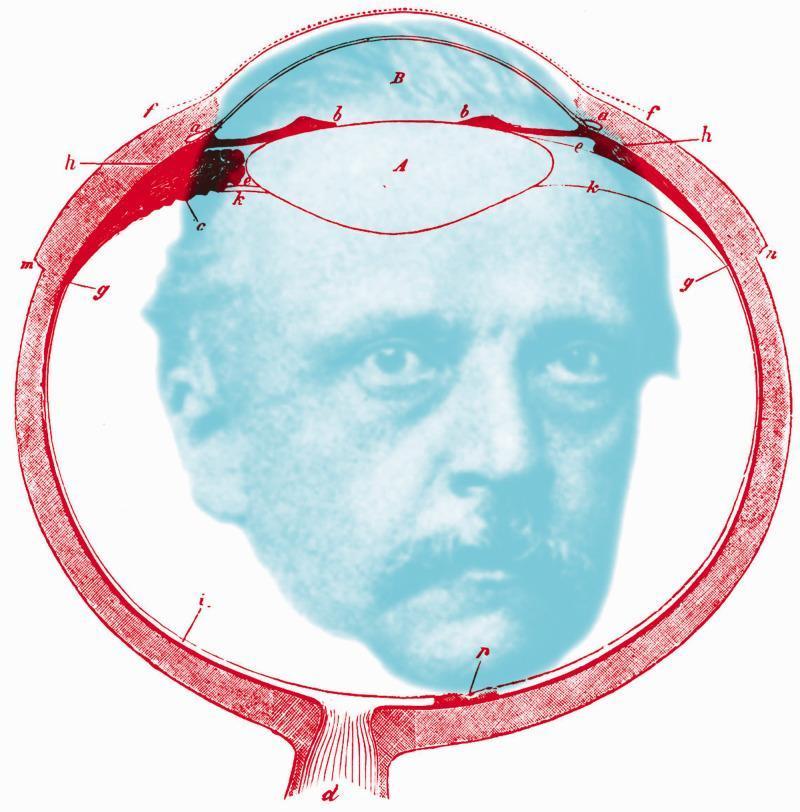
This educational illustration is an anatomical diagram of the human eye in sagittal cross-section, overlaid with a portrait of Hermann von Helmholtz. The diagram, rendered in red linework, depicts essential ophthalmic structures including the cornea (labeled B), the crystalline lens (labeled A), and the ciliary body (b). Various alphabetical annotations (c, d, e, f, g, h, i, k, m, n) indicate specific histological and anatomical regions, such as the sclera, retina, choroid layers, and the optic nerve exit (d). The lens is shown in its anatomical position behind the anterior chamber and iris. The image serves as a conceptual tribute to physiological optics, bridging the anatomy of vision with the historical figure responsible for major advancements in the field, such as the invention of the ophthalmoscope and the primary treatise on physiological optics. The spatial arrangement emphasizes the internal ocular environment, with the retinal lining and posterior segment framing the central portrait.
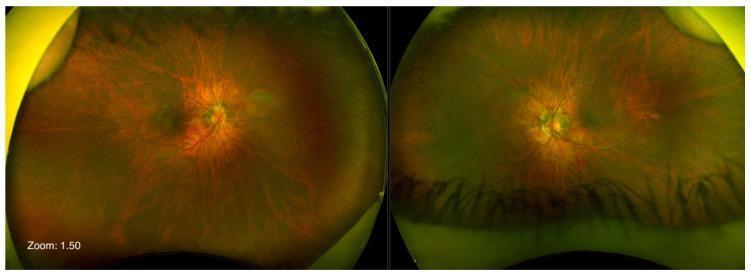
Ultra-widefield pseudocolor fundus images of the right and left eyes demonstrating characteristics of high myopia. Both images show a eutrophic optic nerve head with notable peripapillary ring atrophy, which appears more pronounced in the left eye. A posterior staphyloma is evident bilaterally, visible as a deepening and subtle contour change in the posterior pole. The macular architecture appears unremarkable with homogeneous pigmentation, showing no signs of exudative change or significant choroidal neovascularization. Retinal vascularization is visible extending to the far periphery, which is typical for this presentation. These clinical photographs are used to assess myopic retinal changes and monitor for secondary complications like retinal thinning or staphyloma progression. The image captures the characteristic tigroid fundus appearance often associated with myopic stretching of the retinal pigment epithelium and choroid.