
Classify amenorrhea
amenorrhea classification algorithm flowchart primary secondary
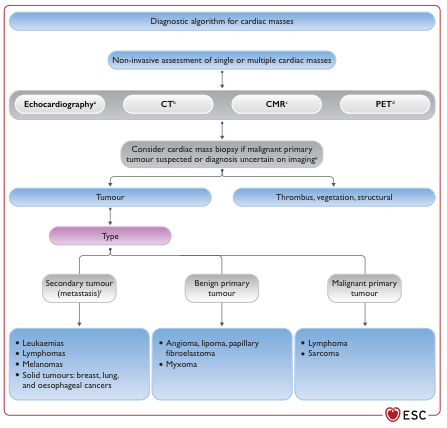
Summary : This flowchart presents a diagnostic algorithm for evaluating cardiac masses, detailing the non-invasive assessment methods, decision points, and classification of cardiac masses into tumours (with subtypes) and non-tumour structural abnormalities. flowchart: # Nodes : • Diagnostic algorithm for cardiac masses (rounded rectangle) • Non-invasive assessment of single or multiple cardiac masses (rounded rectangle) • Echocardiographyᵃ (rounded rectangle) • CTᵇ (rounded rectangle) • CMRᶜ (rounded rectangle) • PETᵈ (rounded rectangle) • Consider cardiac mass biopsy if malignant primary tumour suspected or diagnosis uncertain on imagingᵉ (rounded rectangle) • Tumour (rounded rectangle) • Thrombus, vegetation, structural (rounded rectangle) • Type (rounded rectangle) • Secondary tumour (metastasis)ᶠ (rectangle) • Benign primary tumour (rectangle) • Malignant primary tumour (rectangle) • Leukaemias, Lymphomas, Melanomas, Solid tumours: breast, lung, and oesophageal cancers (rectangle, bulleted list) • Angioma, lipoma, papillary fibroelastoma, Myxoma (rectangle, bulleted list) • Lymphoma, Sarcoma (rectangle, bulleted list) # Connectors : • Top-down arrows from "Diagnostic algorithm for cardiac masses" to "Non-invasive assessment of single or multiple cardiac masses". • Horizontal arrows from "Non-invasive assessment..." to each imaging modality: Echocardiography, CT, CMR, PET. • Downward arrows from each imaging modality to "Consider cardiac mass biopsy if malignant primary tumour suspected or diagnosis uncertain on imaging". • Downward arrow from biopsy decision to two branches: "Tumour" and "Thrombus, vegetation, structural". • From "Tumour", downward arrow to "Type". • From "Type", three branches to "Secondary tumour (metastasis)", "Benign primary tumour", and "Malignant primary tumour". • Each tumour type connects downward to its respective list of example conditions. # Layout : • Vertical flow from top (diagnostic algorithm) to bottom (specific tumour types). • Horizontal row for imaging modalities. • Branching structure for tumour classification. • Parallel branch for non-tumour findings (thrombus, vegetation, structural). # Analysis : • The flowchart provides a clear stepwise approach for cardiac mass evaluation, starting with non-invasive imaging and progressing to biopsy if malignancy is suspected or diagnosis is unclear. • Cardiac masses are classified into tumours (with further division into secondary/metastatic, benign primary, and malignant primary) and non-tumour structural abnormalities. • Example conditions are listed for each tumour subtype, highlighting common malignancies and benign entities. • The algorithm emphasizes the importance of imaging in initial assessment and the selective use of biopsy for uncertain or potentially malignant cases.
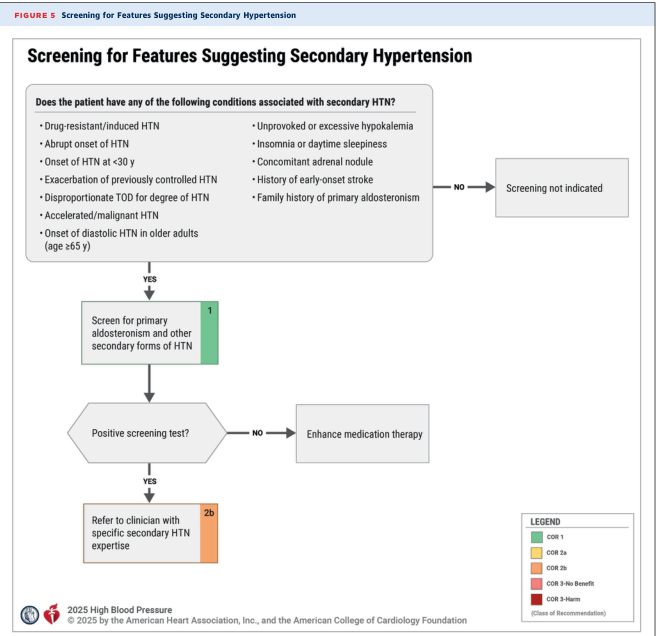
Summary : This flowchart provides a decision-making algorithm for screening patients for features suggesting secondary hypertension, based on clinical conditions and test results. flowchart: # Screening Criteria : • Title: "Screening for Features Suggesting Secondary Hypertension" • Initial decision box: "Does the patient have any of the following conditions associated with secondary HTN?" – Drug-resistant/induced HTN – Abrupt onset of HTN – Onset of HTN at <30 y – Exacerbation of previously controlled HTN – Disproportionate TOD for degree of HTN – Accelerated/malignant HTN – Onset of diastolic HTN in older adults (age ≥65 y) – Unprovoked or excessive hypokalemia – Insomnia or daytime sleepiness – Concomitant adrenal nodule – History of early-onset stroke – Family history of primary aldosteronism # Nodes : • "Does the patient have any of the following conditions associated with secondary HTN?" (rectangle) – If NO: "Screening not indicated" (rectangle) – If YES: "Screen for primary aldosteronism and other secondary forms of HTN" (rectangle, green COR 1) • "Positive screening test?" (hexagon) – If NO: "Enhance medication therapy" (rectangle) – If YES: "Refer to clinician with specific secondary HTN expertise" (rectangle, orange COR 2b) # Connectors : • Main flow is top-down. • First decision splits into YES (downward) and NO (rightward). • Second decision (positive screening test?) splits into YES (downward) and NO (rightward). # Legend : • COR 1 (green) • COR 2a (yellow) • COR 2b (orange) • COR 3 = No Benefit (red) • COR 3 = Harm (dark red) • (Class of Recommendation) # Layout : • Flow proceeds vertically with two main decision points. • Rightward branches for negative answers. • Colour coding for recommendation strength. # Analysis : • The flowchart systematically guides clinicians to screen for secondary hypertension only in patients with specific clinical features. • If screening is positive, referral to a specialist is recommended; if negative, medication therapy is enhanced. • The use of colour-coded recommendation classes helps prioritize actions based on evidence strength.
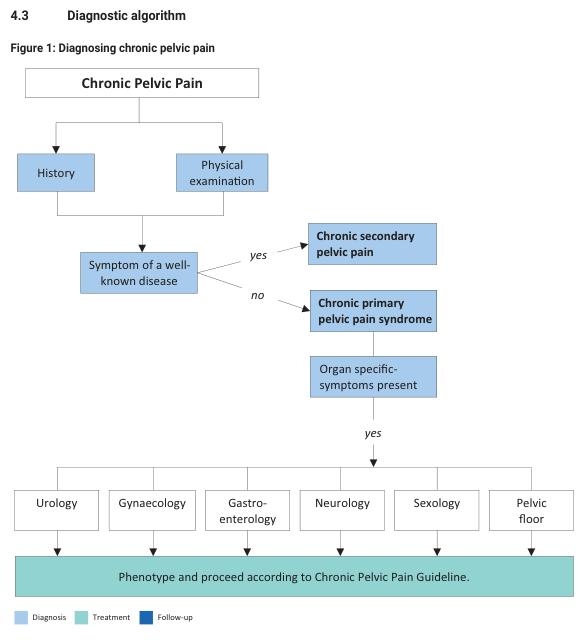
Summary : This flowchart presents a diagnostic algorithm for chronic pelvic pain, guiding clinicians through history, physical examination, and subsequent decision points to classify and manage the condition. flowchart: # Nodes : • Chronic Pelvic Pain (rectangle) • History (rectangle) • Physical examination (rectangle) • Symptom of a well-known disease (rectangle) • Chronic secondary pelvic pain (rectangle) • Chronic primary pelvic pain syndrome (rectangle) • Organ specific-symptoms present (rectangle) • Urology (rectangle) • Gynaecology (rectangle) • Gastro-enterology (rectangle) • Neurology (rectangle) • Sexology (rectangle) • Pelvic floor (rectangle) • Phenotype and proceed according to Chronic Pelvic Pain Guideline (rectangle, teal background) # Connectors : • Arrows from "Chronic Pelvic Pain" to both "History" and "Physical examination". • Both "History" and "Physical examination" feed into "Symptom of a well-known disease". • From "Symptom of a well-known disease": – Arrow labeled "yes" to "Chronic secondary pelvic pain". – Arrow labeled "no" to "Chronic primary pelvic pain syndrome". • From "Chronic primary pelvic pain syndrome" to "Organ specific-symptoms present". • From "Organ specific-symptoms present": – Arrow labeled "yes" splits to six specialties: "Urology", "Gynaecology", "Gastro-enterology", "Neurology", "Sexology", "Pelvic floor". • All six specialties point to "Phenotype and proceed according to Chronic Pelvic Pain Guideline". # Layout : • Top-down hierarchical structure. • Initial assessment splits into two branches based on symptom association with a known disease. • Further branching occurs if organ-specific symptoms are present, leading to specialty-specific pathways. • All specialty pathways converge on a unified management guideline. # Design Encodings : • Diagnosis steps are shaded light blue. • Treatment/follow-up step ("Phenotype and proceed...") is shaded teal. • Arrows indicate logical flow and decision points. • Branches are labeled with decision criteria ("yes", "no"). # Analysis : • The algorithm systematically differentiates between secondary and primary chronic pelvic pain based on history, examination, and symptom specificity. • If a well-known disease is identified, the pain is classified as secondary; otherwise, further evaluation for organ-specific symptoms directs management to relevant specialties. • All pathways ultimately converge on a standardized guideline for phenotyping and management, ensuring comprehensive and multidisciplinary care.
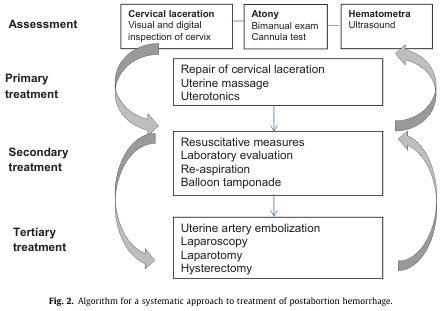
Summary : This figure presents a systematic algorithm for the treatment of postabortion hemorrhage, outlining assessment methods and escalating levels of intervention from primary to tertiary treatment. flowchart: # Assessment : • Cervical laceration (Visual and digital inspection of cervix) • Atony (Bimanual exam, Cannula test) • Hematometra (Ultrasound) # Primary treatment : • Repair of cervical laceration • Uterine massage • Uterotonics # Secondary treatment : • Resuscitative measures • Laboratory evaluation • Re-aspiration • Balloon tamponade # Tertiary treatment : • Uterine artery embolization • Laparoscopy • Laparotomy • Hysterectomy # Connectors : • Arrows connect assessment nodes to primary treatment. • Downward arrows indicate progression from primary to secondary to tertiary treatment. • Curved arrows allow for feedback loops from secondary and tertiary treatments back to assessment. # Layout : • Three main vertical sections: Assessment (top), Primary treatment (middle), Secondary treatment (below primary), Tertiary treatment (bottom). • Horizontal arrangement of assessment types. • Vertical flow of treatment escalation. # Analysis : • The algorithm emphasizes a stepwise escalation in intervention, starting with targeted treatments based on assessment findings, followed by general resuscitative and procedural measures if initial treatments fail, and culminating in advanced surgical or interventional radiology procedures for refractory cases. The feedback loops suggest reassessment is possible at each stage if bleeding persists.
Classification of Amenorrhea
I. Clinical Classification
A. Physiological Amenorrhea
- Pre-pubertal - before menarche
- Pregnancy
- Lactation (lactational amenorrhea)
- Post-menopausal
B. Pathological Amenorrhea
1. Primary Amenorrhea
- Absence of menses by age 13 when there is no visible development of secondary sexual characteristics, OR
- Absence of menses by age 15 in the presence of normal secondary sexual characteristics
- Berek & Novak's Gynecology, p. 1856
2. Secondary Amenorrhea
- Absence of menstruation for 3 menstrual cycles or 3 months in a woman who previously menstruated
- A woman with regular cycles and even 1 week's delay warrants a pregnancy test
- Women with fewer than 9 cycles per year should also be evaluated
- Berek & Novak's Gynecology, p. 1856
II. Anatomical/Etiological Classification
1. Outflow Tract / Uterine Causes (Compartment I)
- Imperforate hymen
- Vaginal aplasia / congenital vaginal atresia
- Mullerian agenesis (Mayer-Rokitansky-Kuster-Hauser syndrome) - congenital absence of the uterus and upper vagina
- Androgen insensitivity syndrome (46,XY with female phenotype)
- Ovotesticular disorder of sexual development
- Asherman syndrome (intrauterine synechiae) - most common outflow tract cause; follows D&C or endometrial infection
- Endometritis with scarring
2. Ovarian Causes (Compartment II)
- Turner syndrome (45,X) - most common cause of hypergonadotropic hypogonadism in primary amenorrhea; streak gonads
- Structural X chromosome abnormalities, mosaicism
- Pure gonadal dysgenesis (46,XX or 46,XY with streak gonads)
- 17-hydroxylase deficiency (adrenal and ovarian)
- Resistant ovary syndrome
- Autoimmune oophoritis
- Primary Ovarian Insufficiency (POI) / Premature Ovarian Failure - ovarian failure before age 40; causes include idiopathic, autoimmune (20-40%), chemotherapy, radiation, galactosemia, fragile X premutation (FMR1)
- Polycystic Ovary Syndrome (PCOS)
- Ovarian tumors (androgen-secreting)
3. Pituitary Causes (Compartment III)
- Hypopituitarism
- Hyperprolactinemia - physiologic or pathologic (prolactinoma is the most common pituitary tumor causing amenorrhea)
- Acquired hypopituitarism - trauma, tumor, Sheehan syndrome (postpartum pituitary necrosis), lymphocytic hypophysitis, pituitary apoplexy
- Empty sella syndrome (found in 4-16% of amenorrhea + galactorrhea cases)
4. Hypothalamic Causes (Compartment IV)
- Kallmann syndrome - GnRH deficiency + anosmia (genetic disorder)
- Constitutional delay of puberty
- Nutritional disorders
- Excessive exercise
- Stress
- Eating disorders (anorexia nervosa - part of the "female athlete triad": eating disorder + amenorrhea + osteoporosis)
- Weight loss / low body weight
- Obesity
- Tumor and infiltrative disease (craniopharyngioma, sarcoidosis, histiocytosis)
5. Iatrogenic / Drug-Induced
-
Antipsychotics (phenothiazines, haloperidol, clozapine, pimozide) - raise prolactin
-
Antidepressants (tricyclics, MAOIs)
-
Antihypertensives (calcium channel blockers, methyldopa, reserpine)
-
Drugs with estrogenic activity (digitalis, flavonoids, marijuana, oral contraceptives)
-
Drugs with ovarian toxicity (busulfan, chlorambucil, cisplatin, cyclophosphamide, fluorouracil)
-
Tietz Textbook of Laboratory Medicine, 7th Ed., p. 2372-2413
III. WHO Classification (Hormonal)
| WHO Group | Name | Characteristics |
|---|---|---|
| Group I | Hypogonadotropic hypogonadism | No endogenous estrogen, normal or low FSH, normal prolactin, no hypothalamic-pituitary lesion (e.g., FHA, Kallmann syndrome) |
| Group II | Normogonadotropic anovulation | Evidence of estrogen production, normal prolactin, normal FSH (e.g., PCOS - the most common group) |
| Group III | Hypergonadotropic hypogonadism | Elevated FSH indicating gonadal insufficiency or failure (e.g., Turner syndrome, POI) |
| Group IV (added later) | Hyperprolactinemic anovulation | Anovulation specifically due to hyperprolactinemia |
- Berek & Novak's Gynecology, p. 1857
IV. Useful Clinical Summary by Presentation
| Feature | Think of |
|---|---|
| Primary amenorrhea + absent breast development + high FSH | Turner syndrome / gonadal dysgenesis |
| Primary amenorrhea + absent breast development + low FSH | Kallmann syndrome / hypothalamic dysfunction |
| Primary amenorrhea + normal secondary sex characteristics + no uterus on imaging | MRKH syndrome or androgen insensitivity |
| Secondary amenorrhea + galactorrhea | Hyperprolactinemia (prolactinoma) |
| Secondary amenorrhea + hot flashes + high FSH in woman <40 | Primary ovarian insufficiency (POI) |
| Secondary amenorrhea + hx of D&C + normal hormones | Asherman syndrome |
| Secondary amenorrhea + low weight/exercise | Functional hypothalamic amenorrhea |
| Secondary amenorrhea + hyperandrogenism + irregular cycles | PCOS |
- Berek & Novak's Gynecology, p. 1856-1857