what is hyperbaric chamber and why is it used for divers .

Reading File
Searching the Web

hyperbaric chamber divers decompression sickness treatment

Searching Images

hyperbaric oxygen chamber decompression sickness treatment
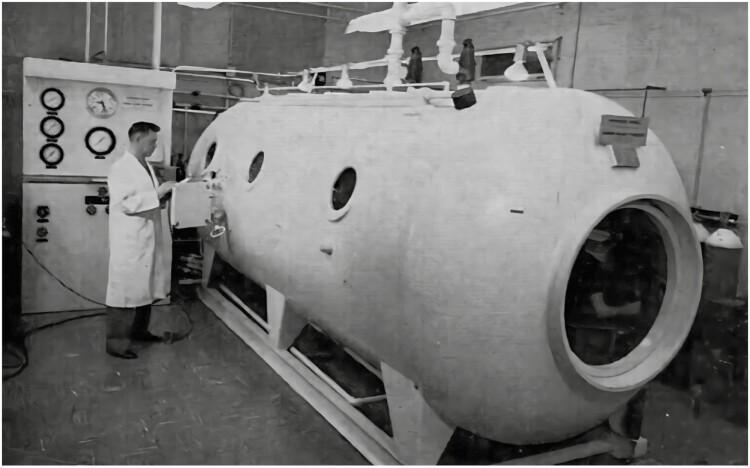
A clinical photograph of a multi-place hyperbaric oxygen therapy (HBOT) or diving chamber, used for treating decompression sickness ('the bends') and conducting respiratory research. The image depicts a large, cylindrical pressure vessel with rounded ends, featuring multiple circular observation portholes and an entry hatch. It is mounted on a heavy-duty metal support frame. Adjacent to the chamber is a vertical control console operated by a clinician. The console is equipped with large analog pressure gauges, flow meters, and valves used to monitor and regulate simulated depth, atmospheric pressure, and gas mixtures within the chamber. The setup illustrates the technology required for hyperbaric medicine and physiological testing at high ambient pressures. Historically located at the Royal Victoria Hospital (Royal Vic), this equipment represents an essential tool in respiratory physiology and the clinical management of gas embolism and nitrogen narcosis.
A clinical photograph of a multi-place hyperbaric oxygen therapy (HBOT) or diving chamber, used for treating decompression sickness ('the bends') and conducting respiratory research. The image depicts a large, cylindrical pressure vessel with rounded ends, featuring multiple circular observation portholes and an entry hatch. It is mounted on a heavy-duty metal support frame. Adjacent to the chamber is a vertical control console operated by a clinician. The console is equipped with large analog pressure gauges, flow meters, and valves used to monitor and regulate simulated depth, atmospheric pressure, and gas mixtures within the chamber. The setup illustrates the technology required for hyperbaric medicine and physiological testing at high ambient pressures. Historically located at the Royal Victoria Hospital (Royal Vic), this equipment represents an essential tool in respiratory physiology and the clinical management of gas embolism and nitrogen narcosis.

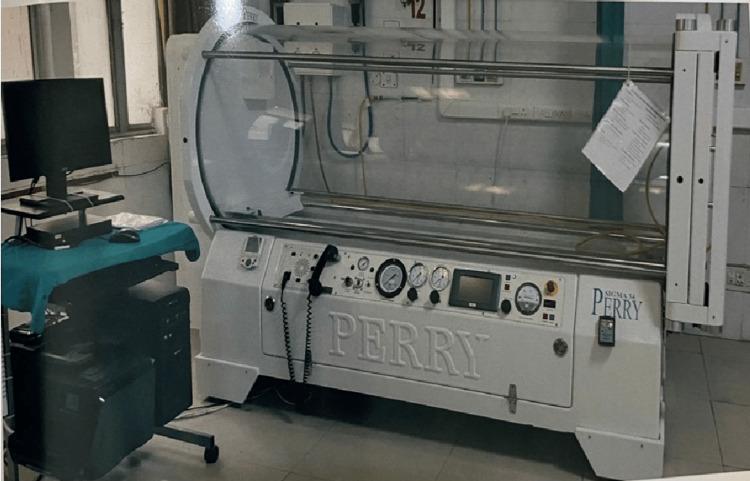
This clinical photograph displays a monoplace hyperbaric oxygen therapy (HBOT) chamber, a specialized medical device used to deliver 100% oxygen at pressures greater than sea level. The unit features a large, transparent acrylic cylindrical pressure hull, allowing for continuous visual monitoring of a single patient. The chamber's base is a white-enameled metal frame (branded 'PERRY') equipped with a comprehensive integrated control console. This panel includes analog pressure gauges, a digital display screen, manual control valves, and a communication handset for patient-operator interaction. To the left, a mobile computer workstation is positioned for data logging and session monitoring. This equipment is primarily utilized in wound care, emergency medicine, and hyperbaric medicine departments for treating conditions such as chronic non-healing ulcers (e.g., diabetic foot ulcers), decompression sickness, and carbon monoxide poisoning. The setup illustrates the standard clinical environment for administering adjunctive hyperbaric therapy.
This clinical photograph displays a monoplace hyperbaric oxygen therapy (HBOT) chamber, a specialized medical device used to deliver 100% oxygen at pressures greater than sea level. The unit features a large, transparent acrylic cylindrical pressure hull, allowing for continuous visual monitoring of a single patient. The chamber's base is a white-enameled metal frame (branded 'PERRY') equipped with a comprehensive integrated control console. This panel includes analog pressure gauges, a digital display screen, manual control valves, and a communication handset for patient-operator interaction. To the left, a mobile computer workstation is positioned for data logging and session monitoring. This equipment is primarily utilized in wound care, emergency medicine, and hyperbaric medicine departments for treating conditions such as chronic non-healing ulcers (e.g., diabetic foot ulcers), decompression sickness, and carbon monoxide poisoning. The setup illustrates the standard clinical environment for administering adjunctive hyperbaric therapy.

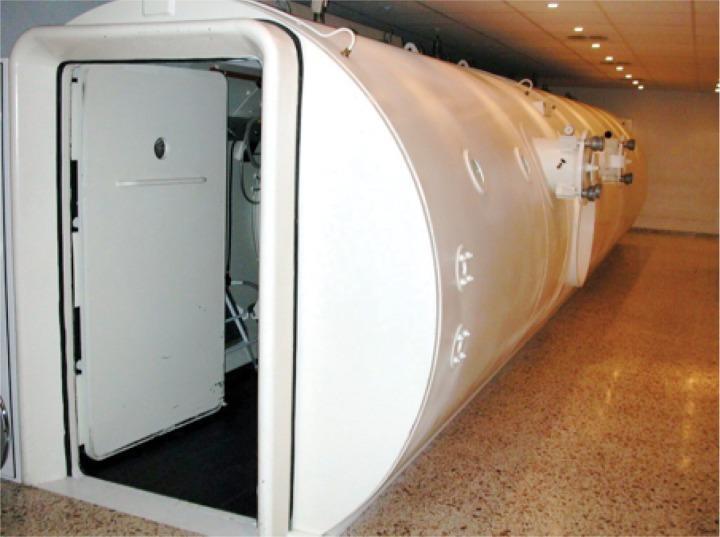
A clinical photograph of a multiplace hyperbaric oxygen chamber (HBOT), showcasing its external structure in a hospital setting. The chamber is a large, white, horizontally oriented cylinder constructed from 12mm thick steel. The image displays the entrance with a heavy-duty, hinged pressure door swung inward, featuring a small circular viewing porthole and a horizontal locking handle. Along the lateral side of the vessel, several small, circular methacrylate windows are visible, which serve for patient observation and wireless signal transmission. External hardware, including pressure-rated valves and bolted circular port interfaces, are mounted on the steel hull. The chamber is designed to accommodate multiple patients simultaneously, allowing for the delivery of pure oxygen at pressures higher than atmospheric levels. This specialized medical device is used for treating conditions such as decompression sickness, carbon monoxide poisoning, and non-healing diabetic wounds. The floor consists of clinical-grade tiling, and the chamber occupies a dedicated therapeutic bay.
A clinical photograph of a multiplace hyperbaric oxygen chamber (HBOT), showcasing its external structure in a hospital setting. The chamber is a large, white, horizontally oriented cylinder constructed from 12mm thick steel. The image displays the entrance with a heavy-duty, hinged pressure door swung inward, featuring a small circular viewing porthole and a horizontal locking handle. Along the lateral side of the vessel, several small, circular methacrylate windows are visible, which serve for patient observation and wireless signal transmission. External hardware, including pressure-rated valves and bolted circular port interfaces, are mounted on the steel hull. The chamber is designed to accommodate multiple patients simultaneously, allowing for the delivery of pure oxygen at pressures higher than atmospheric levels. This specialized medical device is used for treating conditions such as decompression sickness, carbon monoxide poisoning, and non-healing diabetic wounds. The floor consists of clinical-grade tiling, and the chamber occupies a dedicated therapeutic bay.

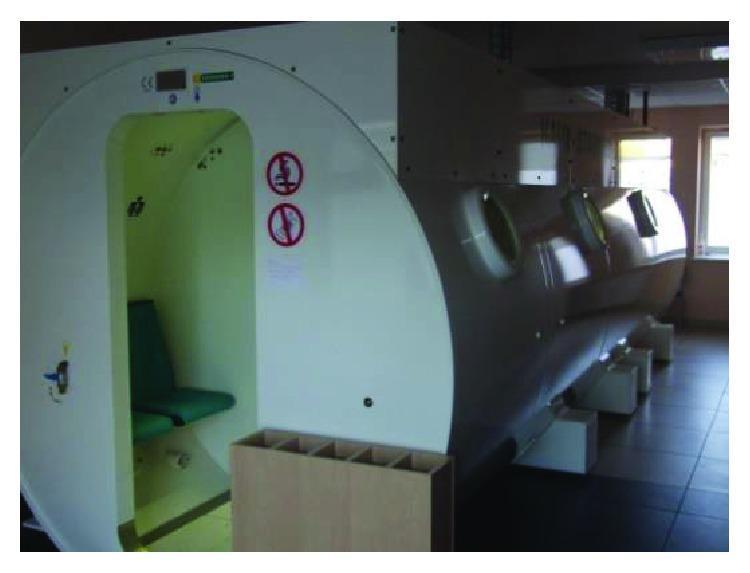
Clinical photograph of a multiplace hyperbaric oxygen therapy (HBOT) chamber, identified as a Haux Starmed 2200 model, located within a specialized medical facility. The chamber is a large, cylindrical, pressure-sealed vessel designed for delivering oxygen at pressures higher than atmospheric levels. The exterior features a dual-color scheme with a white front-facing entrance panel and a grey longitudinal hull. The entrance consists of a reinforced doorway revealing an illuminated interior with green patient seating. Circular, thick-paned pressure windows (portholes) are distributed along the side for patient monitoring. External safety signage, including red 'prohibition' symbols (likely for fire hazards or smoking), is visible near the entry point. The unit is supported by heavy-duty white rectangular structural blocks on a tiled clinical floor. Such devices are used in the management of conditions like Sudden Sensorineural Hearing Loss (SSNHL), chronic non-healing wounds, and decompression sickness, where hyperbaric oxygen serves to increase plasma-dissolved oxygen and modulate oxidative stress markers.
Clinical photograph of a multiplace hyperbaric oxygen therapy (HBOT) chamber, identified as a Haux Starmed 2200 model, located within a specialized medical facility. The chamber is a large, cylindrical, pressure-sealed vessel designed for delivering oxygen at pressures higher than atmospheric levels. The exterior features a dual-color scheme with a white front-facing entrance panel and a grey longitudinal hull. The entrance consists of a reinforced doorway revealing an illuminated interior with green patient seating. Circular, thick-paned pressure windows (portholes) are distributed along the side for patient monitoring. External safety signage, including red 'prohibition' symbols (likely for fire hazards or smoking), is visible near the entry point. The unit is supported by heavy-duty white rectangular structural blocks on a tiled clinical floor. Such devices are used in the management of conditions like Sudden Sensorineural Hearing Loss (SSNHL), chronic non-healing wounds, and decompression sickness, where hyperbaric oxygen serves to increase plasma-dissolved oxygen and modulate oxidative stress markers.

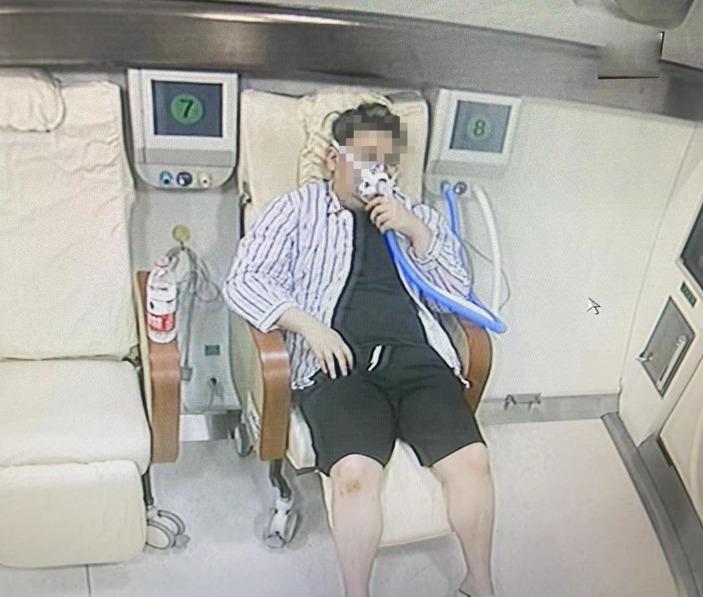
Clinical photograph of a patient receiving treatment inside a multi-place hyperbaric oxygen therapy (HBOT) chamber. The patient is shown in a seated, semi-reclined position wearing a tight-fitting oronasal oxygen mask connected to a blue corrugated delivery circuit. This setup facilitates the delivery of high-concentration oxygen under increased atmospheric pressure. The interior of the chamber features specialized medical seating, integrated digital monitoring screens labeled with station numbers, and wall-mounted gas delivery ports. Clinical context indicates this therapy is being utilized to manage peripheral neuropathy secondary to nitrous oxide (N2O) neurotoxicity. The image illustrates the application of hyperbaric medicine in treating neurological sequelae by increasing plasma oxygen solubility to counteract tissue hypoxia and potentially modulate cerebral blood flow and metabolic dysfunction caused by chemical inhalation.
Clinical photograph of a patient receiving treatment inside a multi-place hyperbaric oxygen therapy (HBOT) chamber. The patient is shown in a seated, semi-reclined position wearing a tight-fitting oronasal oxygen mask connected to a blue corrugated delivery circuit. This setup facilitates the delivery of high-concentration oxygen under increased atmospheric pressure. The interior of the chamber features specialized medical seating, integrated digital monitoring screens labeled with station numbers, and wall-mounted gas delivery ports. Clinical context indicates this therapy is being utilized to manage peripheral neuropathy secondary to nitrous oxide (N2O) neurotoxicity. The image illustrates the application of hyperbaric medicine in treating neurological sequelae by increasing plasma oxygen solubility to counteract tissue hypoxia and potentially modulate cerebral blood flow and metabolic dysfunction caused by chemical inhalation.

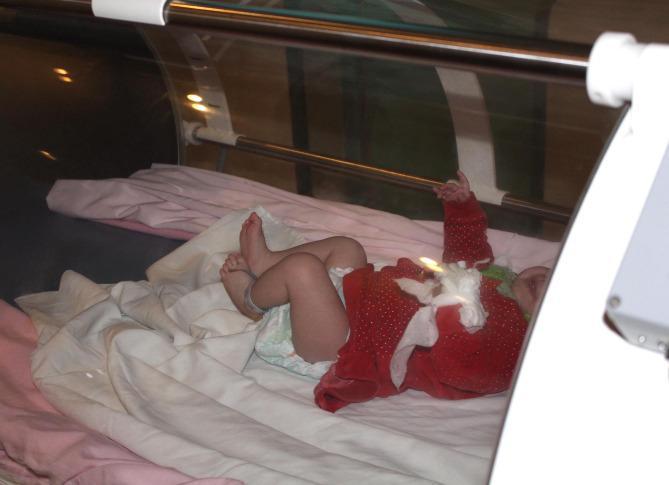
This clinical photograph displays an infant undergoing hyperbaric oxygen therapy (HBOT). The patient is positioned inside a specialized pediatric hyperbaric oxygen chamber, which is characterized by a transparent, cylindrical acrylic hull that allows for continuous visual monitoring by medical staff. The chamber is supported by a white structural frame with longitudinal metal reinforcement bars visible. The infant is supine on pink and white bedding, wearing a red patterned onesie and diaper. Visible medical monitoring includes a pulse oximetry sensor attached to the finger to track oxygen saturation during treatment. An identification or monitoring band is also present on the infant's ankle. This device is used in pediatric care to deliver high-pressure oxygen, often utilized in clinical scenarios such as tissue ischemia, complex wound healing, or carbon monoxide poisoning. The setup demonstrates the integration of neonatal intensive care monitoring within a pressurized therapeutic environment.

This clinical photograph displays an infant undergoing hyperbaric oxygen therapy (HBOT). The patient is positioned inside a specialized pediatric hyperbaric oxygen chamber, which is characterized by a transparent, cylindrical acrylic hull that allows for continuous visual monitoring by medical staff. The chamber is supported by a white structural frame with longitudinal metal reinforcement bars visible. The infant is supine on pink and white bedding, wearing a red patterned onesie and diaper. Visible medical monitoring includes a pulse oximetry sensor attached to the finger to track oxygen saturation during treatment. An identification or monitoring band is also present on the infant's ankle. This device is used in pediatric care to deliver high-pressure oxygen, often utilized in clinical scenarios such as tissue ischemia, complex wound healing, or carbon monoxide poisoning. The setup demonstrates the integration of neonatal intensive care monitoring within a pressurized therapeutic environment.

Finding Sources
Reading File
Reading File
Reading File
Reading File
Loading Image
Here is a thorough breakdown of hyperbaric chambers and their use for divers:

What Is a Hyperbaric Chamber?

A hyperbaric chamber (also called a recompression or decompression chamber) is a sealed, pressurized vessel that exposes a patient's entire body to atmospheric pressures greater than normal sea-level pressure (>1 atmosphere absolute, or ATA). Inside, the patient breathes 100% medical-grade oxygen. According to the Undersea and Hyperbaric Medical Society (UHMS), treatment is delivered at a minimum of 2.0 ATA for 90-120 minutes per session.
Two main designs exist:
  • Monoplace chamber - fits one patient, compressed with 100% oxygen. Direct patient access is not possible but IV fluids, drugs, ventilation, and monitoring are still possible.
  • Multiplace chamber - fits multiple patients and medical attendants; the chamber atmosphere is compressed air while the patient breathes oxygen through a mask/hood.
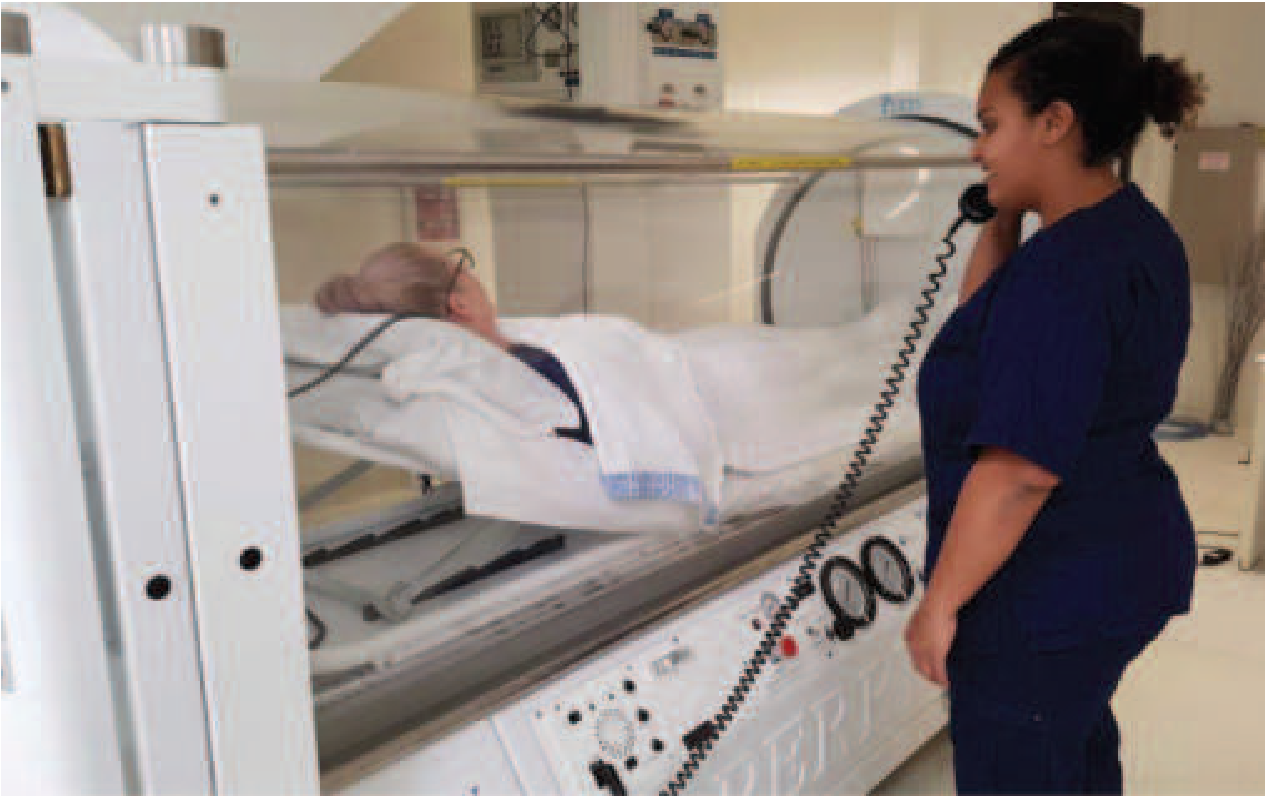
(Harrison's Principles of Internal Medicine 22E, p. 3804)
A monoplace hyperbaric chamber with a nurse attending via phone communication

Why Divers Need It: Decompression Sickness ("The Bends")

The Physics - Why Bubbles Form

When a diver descends, water pressure increases (roughly 1 ATA per every 10 meters/33 feet of depth). According to Henry's Law, gases dissolve into body tissues at higher concentrations under higher pressure. Specifically, nitrogen from breathing air accumulates in blood and tissues the deeper and longer a diver stays down.
When a diver ascends too quickly, pressure drops rapidly - faster than the body can safely off-gas the dissolved nitrogen. The nitrogen comes out of solution and forms bubbles in the blood vessels and tissues - exactly like the fizz when you open a carbonated drink too fast.
(Guyton and Hall Textbook of Medical Physiology)

Decompression Sickness (DCS) - "The Bends"

These nitrogen bubbles cause a range of symptoms depending on where they lodge:
LocationSymptoms
Joints / musclesPain (classic "bends"), especially shoulders, elbows, hips, knees
Spinal cordWeakness, paralysis, bladder dysfunction
BrainConfusion, visual disturbances, stroke-like symptoms
Lungs"Chokes" - chest pain, cough, breathing difficulty
SkinMottled rash, itching
Inner earVertigo, hearing loss
Severe DCS has a mortality rate if untreated. Arterial gas embolism (when bubbles enter arteries, especially to the brain) is a separate but related emergency with a reported mortality of 20%.
(Tintinalli's Emergency Medicine, p. 3233)

How the Hyperbaric Chamber Treats It

1. Physical Bubble Reduction (Recompression)

Increasing pressure inside the chamber physically compresses and shrinks the nitrogen bubbles, instantly relieving the mechanical obstruction of blood vessels and tissues. This was historically the first and most obvious rationale for the treatment.

2. Enhanced Gas Elimination

Breathing 100% oxygen under high pressure creates a massive pressure gradient that drives nitrogen out of tissues much faster than breathing air would. The nitrogen is eliminated through the lungs.

3. Tissue Oxygenation

The super-pressurized oxygen dissolves directly into plasma (not just hemoglobin), flooding ischemic tissues with oxygen that bubbles had been cutting off from the blood supply.

4. Cell-Signaling and Anti-inflammatory Effects

More recent research shows hyperbaric oxygen triggers important cell signaling - it blunts ischemia-reperfusion injury, preserves intracellular ATP, terminates lipid peroxidation, and augments leukocyte bactericidal activity.
(Harrison's Principles of Internal Medicine 22E)

Standard Treatment Protocol

The most commonly used regimen is the U.S. Navy Treatment Table 6 (USN TT6):
  • Initial pressurization to 2.8 ATA (equivalent to 60 feet/18 meters of seawater)
  • Patient breathes pure oxygen, with scheduled air breaks to prevent oxygen toxicity
  • Total duration: ~5 hours (extensions can be added based on severity)
For mild, stable DCS in a remote location with no hyperbaric facility available, supplemental oxygen alone may be used as a temporizing measure until transfer.
(Divers Alert Network / CDC Yellow Book)

Tank Decompression for Professional Divers

Beyond emergency treatment, hyperbaric chambers are also used preventively for professional divers:
  • After working at great depths, a diver may be placed in a pressurized tank and decompressed slowly over several hours using a staged schedule (e.g., 1 hour of bottom time requires ~3 hours of controlled decompression)
  • Saturation divers who work at extreme depths (250 to 1000 feet) live inside a large compression tank for days or weeks at ambient pressure - eliminating the need for repeated daily decompression cycles
  • At very deep levels, helium replaces nitrogen in the breathing mixture because it has less narcotic effect, dissolves less into tissues, and diffuses out faster during decompression
(Guyton and Hall Textbook of Medical Physiology, p. 562)

Other Medical Uses Beyond Diving

The chamber is approved for many other conditions too:
  • Carbon monoxide poisoning (accelerates CO elimination from hemoglobin)
  • Arterial gas embolism (from surgical procedures or IV lines)
  • Necrotizing soft tissue infections / gas gangrene (oxygen suppresses anaerobic bacteria)
  • Chronic non-healing wounds (diabetic ulcers, radiation injury)
  • Cyanide poisoning, osteomyelitis, compartment syndrome, acute thermal burns
(Tintinalli's Emergency Medicine - Table of HBO Indications)

Summary: A hyperbaric chamber works for divers by reversing the physics that caused the problem - it re-applies pressure to shrink dangerous nitrogen bubbles, then uses high-flow oxygen under that pressure to wash the nitrogen out of tissues and restore oxygen delivery to injured cells. It remains the definitive, gold-standard treatment for decompression sickness and arterial gas embolism from diving.

what is decompression sickness

Finding Sources
Searching the Web

decompression sickness pathophysiology symptoms treatment 2024

Searching Images

decompression sickness the bends nitrogen bubbles diving diagram

A clinical photograph of a multi-place hyperbaric oxygen therapy (HBOT) or diving chamber, used for treating decompression sickness ('the bends') and conducting respiratory research. The image depicts a large, cylindrical pressure vessel with rounded ends, featuring multiple circular observation portholes and an entry hatch. It is mounted on a heavy-duty metal support frame. Adjacent to the chamber is a vertical control console operated by a clinician. The console is equipped with large analog pressure gauges, flow meters, and valves used to monitor and regulate simulated depth, atmospheric pressure, and gas mixtures within the chamber. The setup illustrates the technology required for hyperbaric medicine and physiological testing at high ambient pressures. Historically located at the Royal Victoria Hospital (Royal Vic), this equipment represents an essential tool in respiratory physiology and the clinical management of gas embolism and nitrogen narcosis.
A clinical photograph of a multi-place hyperbaric oxygen therapy (HBOT) or diving chamber, used for treating decompression sickness ('the bends') and conducting respiratory research. The image depicts a large, cylindrical pressure vessel with rounded ends, featuring multiple circular observation portholes and an entry hatch. It is mounted on a heavy-duty metal support frame. Adjacent to the chamber is a vertical control console operated by a clinician. The console is equipped with large analog pressure gauges, flow meters, and valves used to monitor and regulate simulated depth, atmospheric pressure, and gas mixtures within the chamber. The setup illustrates the technology required for hyperbaric medicine and physiological testing at high ambient pressures. Historically located at the Royal Victoria Hospital (Royal Vic), this equipment represents an essential tool in respiratory physiology and the clinical management of gas embolism and nitrogen narcosis.

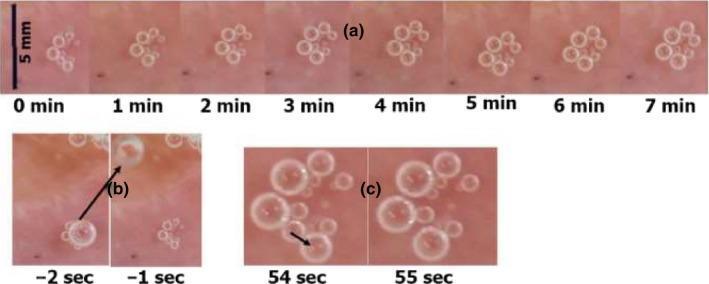
This composite of clinical photographs illustrates the dynamics of intravascular bubbles at an active hydrophobic spot (AHS) on a pulmonary vein, relevant to the pathophysiology of decompression sickness. Panel (a) presents a longitudinal series from 0 to 7 minutes post-decompression, showing a stable cluster of spherical bubbles that demonstrates gradual expansion in volume over time. Panel (b) provides a high-speed sequence showing the detachment of a large bubble (indicated by an arrow) from the vessel wall between -2 and -1 seconds, leaving behind a cleared footprint on the tissue surface. Panel (c) captures the process of coalescence at 54 to 55 seconds, where two adjacent smaller bubbles merge into a single larger bubble. The images highlight key educational concepts in diving medicine and hyperbaric physiology, specifically bubble formation (nucleation), growth via gas diffusion, and mechanical detachment into the bloodstream. A 5 mm scale bar is provided for reference.
This composite of clinical photographs illustrates the dynamics of intravascular bubbles at an active hydrophobic spot (AHS) on a pulmonary vein, relevant to the pathophysiology of decompression sickness. Panel (a) presents a longitudinal series from 0 to 7 minutes post-decompression, showing a stable cluster of spherical bubbles that demonstrates gradual expansion in volume over time. Panel (b) provides a high-speed sequence showing the detachment of a large bubble (indicated by an arrow) from the vessel wall between -2 and -1 seconds, leaving behind a cleared footprint on the tissue surface. Panel (c) captures the process of coalescence at 54 to 55 seconds, where two adjacent smaller bubbles merge into a single larger bubble. The images highlight key educational concepts in diving medicine and hyperbaric physiology, specifically bubble formation (nucleation), growth via gas diffusion, and mechanical detachment into the bloodstream. A 5 mm scale bar is provided for reference.

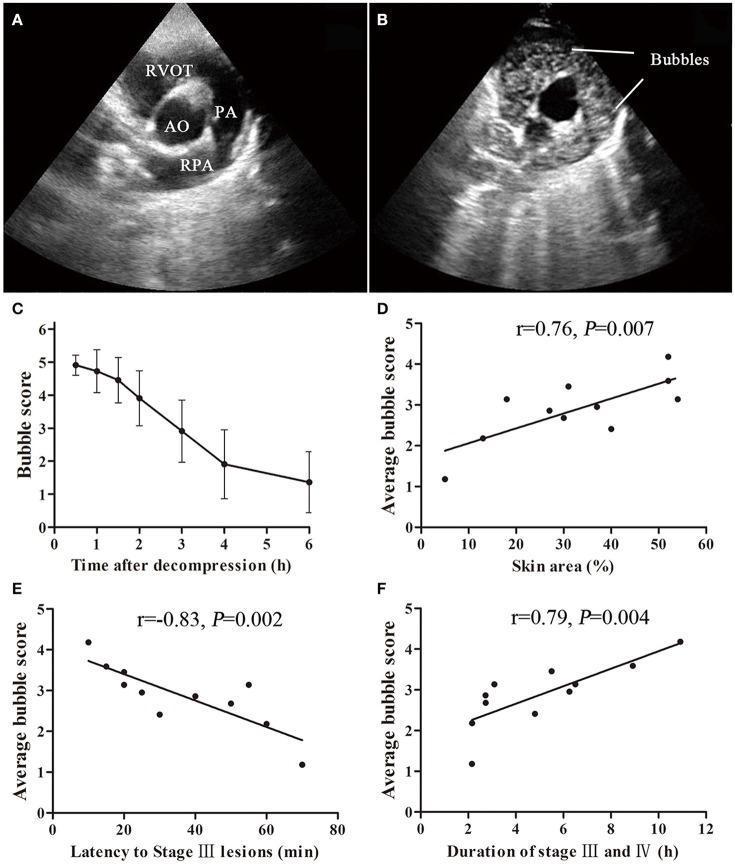
This composite educational image illustrates the pathophysiology of decompression sickness (DCS). Panels A and B present echocardiographic images (parasternal short-axis view at the aortic root level). Panel A shows normal anatomy including the Aorta (AO), Right Ventricular Outflow Tract (RVOT), Pulmonary Artery (PA), and Right Pulmonary Artery (RPA). Panel B demonstrates the presence of circulating venous gas emboli, visible as hyperechoic, bright punctate 'bubbles' within the RVOT and PA. Panel C is a line graph showing the temporal decline of bubble scores over a 6-hour post-decompression period. Panels D, E, and F are scatter plots with linear regression analysis demonstrating the clinical correlation between bubble load and cutaneous manifestations of DCS. These charts show that higher bubble scores correlate with larger skin lesion areas (r=0.76), shorter latency to the onset of Stage III lesions (r=-0.83), and longer duration of severe skin symptoms (r=0.79). The material serves to teach the relationship between intravascular gas formation and the severity of systemic DCS symptoms.
This composite educational image illustrates the pathophysiology of decompression sickness (DCS). Panels A and B present echocardiographic images (parasternal short-axis view at the aortic root level). Panel A shows normal anatomy including the Aorta (AO), Right Ventricular Outflow Tract (RVOT), Pulmonary Artery (PA), and Right Pulmonary Artery (RPA). Panel B demonstrates the presence of circulating venous gas emboli, visible as hyperechoic, bright punctate 'bubbles' within the RVOT and PA. Panel C is a line graph showing the temporal decline of bubble scores over a 6-hour post-decompression period. Panels D, E, and F are scatter plots with linear regression analysis demonstrating the clinical correlation between bubble load and cutaneous manifestations of DCS. These charts show that higher bubble scores correlate with larger skin lesion areas (r=0.76), shorter latency to the onset of Stage III lesions (r=-0.83), and longer duration of severe skin symptoms (r=0.79). The material serves to teach the relationship between intravascular gas formation and the severity of systemic DCS symptoms.

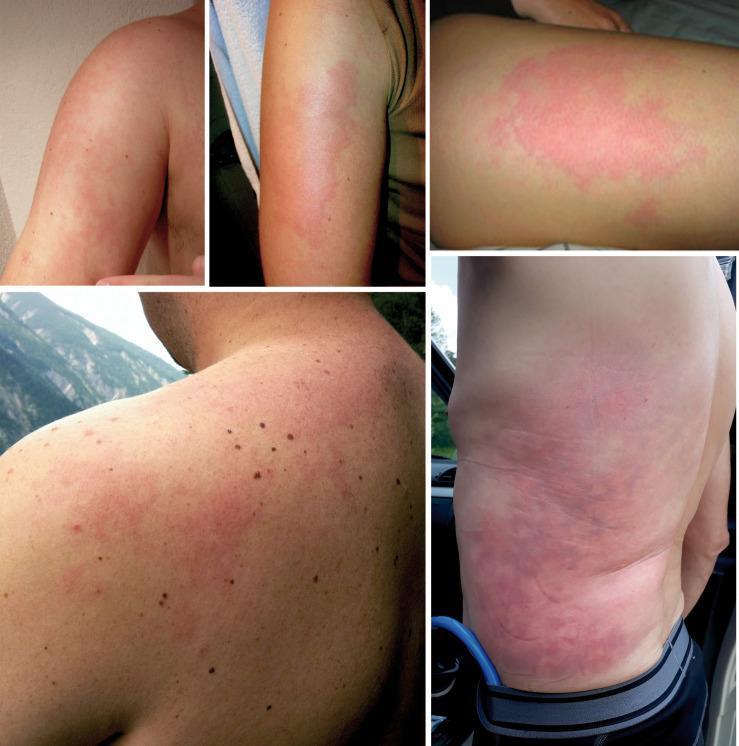
This composite of clinical photographs illustrates various presentations of Livedo racemosa (LRC) in the context of decompression illness (DCI). The images show affected skin on the upper arms, trunk, and back, characterized by a persistent, reddish-blue to violaceous mottling. The lesion morphology is defined by an irregular, 'broken' net-like or reticulated pattern that does not form complete circles, distinguishing it from livedo reticularis. These manifestations represent cutaneous decompression illness, where vascular occlusion by nitrogen gas bubbles or secondary microthrombi leads to focal perfusion deficiencies and venous congestion. The distribution is typically asymmetrical and can involve the limbs and trunk. Clinically, this sign is significant as it often correlates with a high prevalence of right-to-left shunts, such as a patent foramen ovale (PFO), in diving-related injuries.
This composite of clinical photographs illustrates various presentations of Livedo racemosa (LRC) in the context of decompression illness (DCI). The images show affected skin on the upper arms, trunk, and back, characterized by a persistent, reddish-blue to violaceous mottling. The lesion morphology is defined by an irregular, 'broken' net-like or reticulated pattern that does not form complete circles, distinguishing it from livedo reticularis. These manifestations represent cutaneous decompression illness, where vascular occlusion by nitrogen gas bubbles or secondary microthrombi leads to focal perfusion deficiencies and venous congestion. The distribution is typically asymmetrical and can involve the limbs and trunk. Clinically, this sign is significant as it often correlates with a high prevalence of right-to-left shunts, such as a patent foramen ovale (PFO), in diving-related injuries.

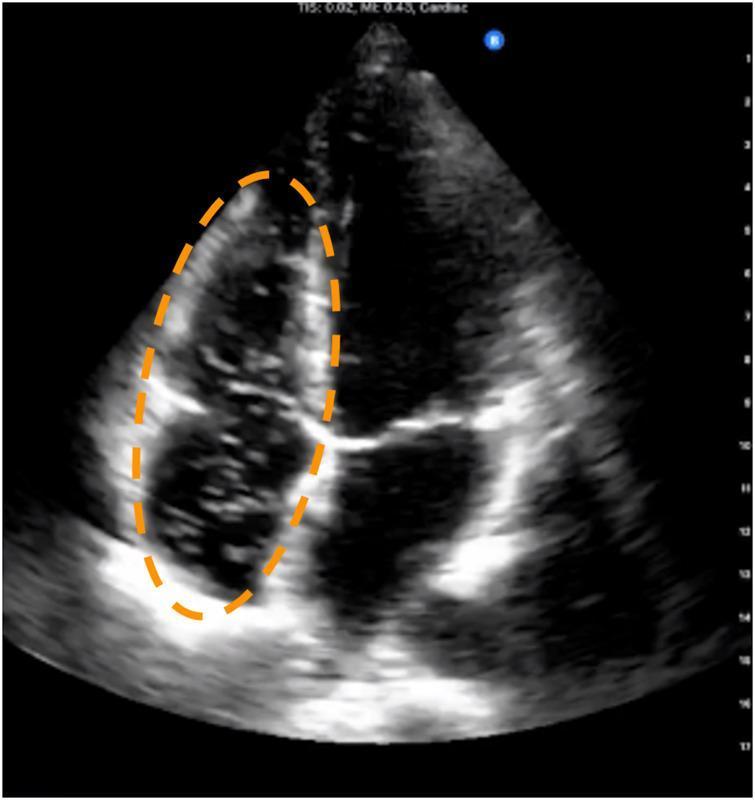
This diagnostic image is a B-mode apical four-chamber trans-thoracic echocardiogram (TTE) demonstrating the presence of venous gas emboli (VGE). The visual focuses on the right-sided heart chambers (right atrium and right ventricle), highlighted by an orange dashed ellipse. Within these chambers, numerous discrete, punctate, hyper-echoic signals are visible circulating against the dark, anechoic background of the blood pool. These bright spots represent intravascular gas bubbles, often monitored using the Eftedal-Brubakk (EB) scale in decompression sickness research and diving medicine. The contrast between the hyper-echoic VGE and the relatively echo-free blood pool allows for the quantification of bubble load. The anatomical structures, including the interventricular and interatrial septa and valve leaflets, provide the structural context for identifying the venous side of the heart. This image is used educationally to demonstrate the ultrasound appearance of circulating gas emboli and the application of cardiac imaging in physiological monitoring.
This diagnostic image is a B-mode apical four-chamber trans-thoracic echocardiogram (TTE) demonstrating the presence of venous gas emboli (VGE). The visual focuses on the right-sided heart chambers (right atrium and right ventricle), highlighted by an orange dashed ellipse. Within these chambers, numerous discrete, punctate, hyper-echoic signals are visible circulating against the dark, anechoic background of the blood pool. These bright spots represent intravascular gas bubbles, often monitored using the Eftedal-Brubakk (EB) scale in decompression sickness research and diving medicine. The contrast between the hyper-echoic VGE and the relatively echo-free blood pool allows for the quantification of bubble load. The anatomical structures, including the interventricular and interatrial septa and valve leaflets, provide the structural context for identifying the venous side of the heart. This image is used educationally to demonstrate the ultrasound appearance of circulating gas emboli and the application of cardiac imaging in physiological monitoring.

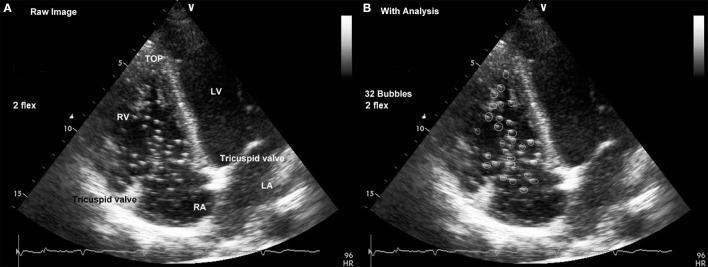
This diagnostic echocardiogram shows a side-by-side comparison of a cardiac four-chamber view used to evaluate venous gas emboli (VGE). Panel A (Raw Image) displays standard anatomical landmarks including the Right Ventricle (RV), Right Atrium (RA), Left Ventricle (LV), Left Atrium (LA), and the tricuspid valve leaflets. Panel B (With Analysis) demonstrates a specialized bubble counting technique where numerous hyperechoic bright spots representing circulating bubbles are identified and circled within the right heart chambers. The educational focus is on distinguishing transient venous gas emboli—often associated with decompression sickness—from fixed cardiac structures such as the tricuspid annulus or papillary muscles. The image is taken from a fifth intercostal space probe placement and includes clinical metadata such as heart rate and count (32 Bubbles). This visual is highly relevant for diving medicine, cardiology, and hyperbaric physiology to illustrate the quantification of post-dive bubble formation.

This diagnostic echocardiogram shows a side-by-side comparison of a cardiac four-chamber view used to evaluate venous gas emboli (VGE). Panel A (Raw Image) displays standard anatomical landmarks including the Right Ventricle (RV), Right Atrium (RA), Left Ventricle (LV), Left Atrium (LA), and the tricuspid valve leaflets. Panel B (With Analysis) demonstrates a specialized bubble counting technique where numerous hyperechoic bright spots representing circulating bubbles are identified and circled within the right heart chambers. The educational focus is on distinguishing transient venous gas emboli—often associated with decompression sickness—from fixed cardiac structures such as the tricuspid annulus or papillary muscles. The image is taken from a fifth intercostal space probe placement and includes clinical metadata such as heart rate and count (32 Bubbles). This visual is highly relevant for diving medicine, cardiology, and hyperbaric physiology to illustrate the quantification of post-dive bubble formation.

Reading File
Reading File
Reading File
Loading Image
Here is a thorough, textbook-grounded explanation of decompression sickness:

Decompression Sickness (DCS) - "The Bends"

Definition

Decompression sickness is a spectrum of clinical illnesses that results from the formation of nitrogen gas bubbles in the blood and tissues when a diver (or compressed air worker) ascends too quickly and ambient pressure drops faster than the body can safely eliminate the dissolved gas. (Rosen's Emergency Medicine)

The Physics Behind It - Henry's Law

At depth, a diver breathes air (79% nitrogen) at elevated pressure. According to Henry's Law, gas solubility in a liquid is proportional to the pressure above it - so the deeper and longer you dive, the more nitrogen silently dissolves into your blood and tissues.
When you ascend, pressure falls. If the ascent is too fast, the dissolved nitrogen cannot exit the body gradually through the lungs. Instead, it comes out of solution and forms bubbles - like the fizz rushing out of a carbonated drink when the cap is removed suddenly.
  • Nitrogen is highly fat-soluble, so the myelin-rich white matter of the spinal cord and brain is especially vulnerable
  • Small venous bubbles are common after any dive and are usually filtered harmlessly by the lungs
  • Larger or more numerous bubbles trigger inflammatory cascades, platelet aggregation, complement activation, and vascular obstruction - this is where injury begins
(Harrison's Principles of Internal Medicine 22E, p. 3810)

Classification: Type I vs. Type II

Type I - "Mild" DCS

Affects muscles, joints, skin, and lymphatics. Less life-threatening:
  • Joint and muscle pain ("the bends") - most common symptom (68% of cases)
  • Skin rash - mottled, marbled purplish pattern called cutis marmorata or livedo racemosa - a sign of vascular obstruction from nitrogen bubbles
  • Lymphedema - localized soft tissue swelling
  • Fatigue

Type II - "Serious" DCS

Affects the nervous system, lungs, and cardiovascular system:
  • Spinal cord (most common serious form) - weakness, paralysis, bladder/bowel dysfunction, girdle pain (a squeezing sensation around the abdomen strongly suggesting spinal involvement)
  • Brain - confusion, visual disturbances, speech problems, seizures, coma
  • Inner ear - vertigo, hearing loss, nausea, vomiting
  • Lungs ("the chokes") - cough, breathlessness, chest pain from bubbles in pulmonary vasculature
  • Cardiovascular - hemoconcentration, coagulopathy, hypotension
(Harrison's 22E; Rosen's Emergency Medicine)

Frequency and Distribution of Symptoms
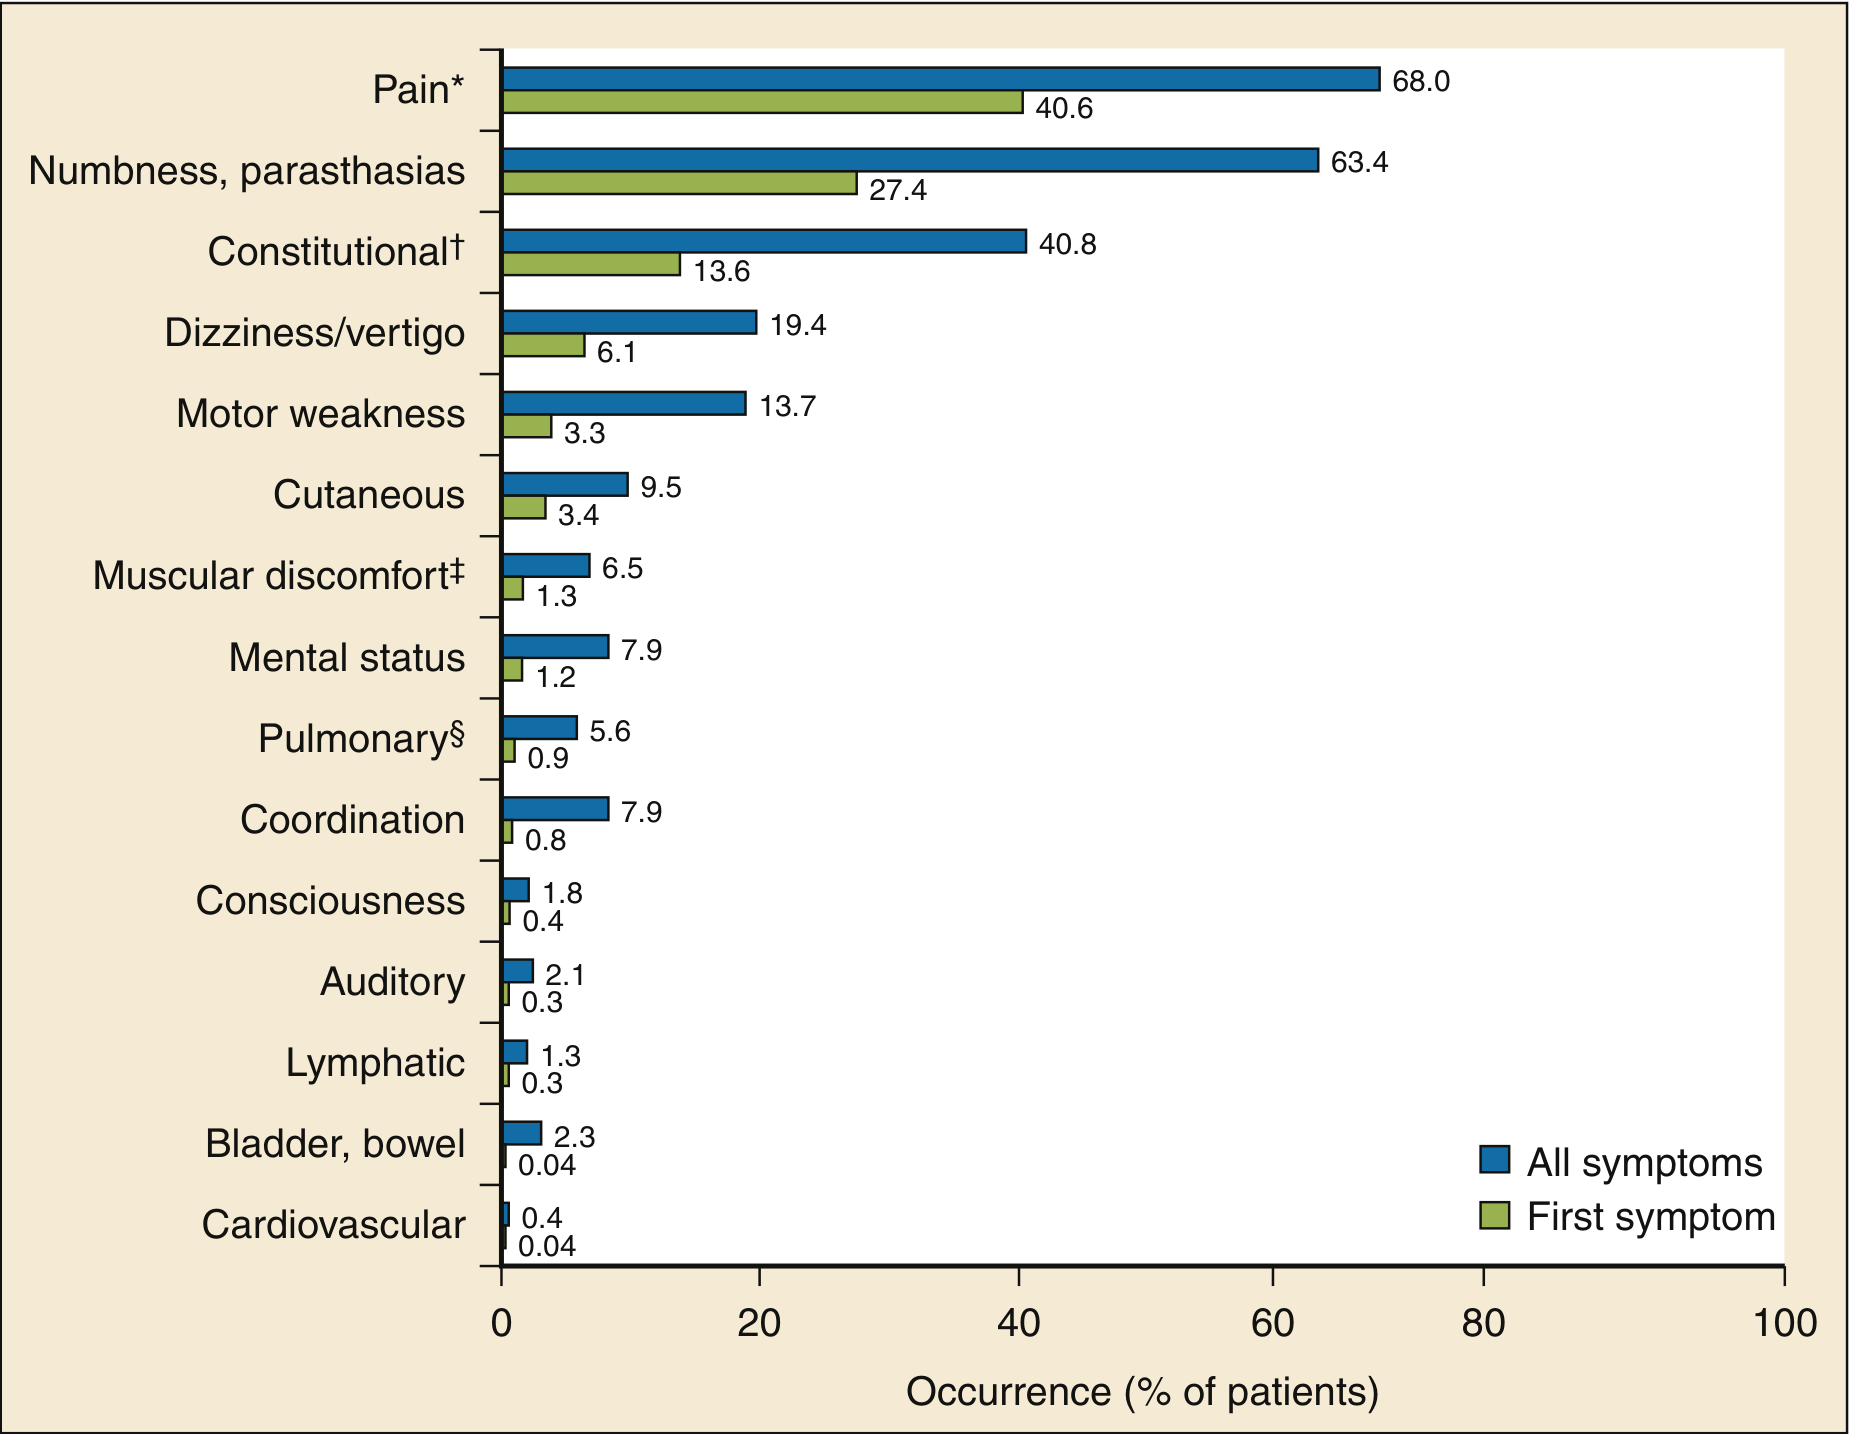
This chart from 2,346 recreational diving accidents shows what symptoms divers actually experience:
DCS symptom frequency chart from Divers Alert Network data
Pain is by far the most common symptom (68%), followed by numbness/paresthesias (63%) and constitutional symptoms like fatigue (41%).

Timing of Symptoms

DCS is not always immediate. According to Rosen's Emergency Medicine:
  • 40% of symptoms appear within 1 hour of surfacing
  • 60% within 3 hours
  • 80% within 8 hours
  • 98% within 24 hours
  • Symptoms appearing more than 24 hours after diving are unlikely to be DCS - unless the diver flew or traveled to altitude after the dive (lower cabin pressure can trigger late onset)

Risk Factors

Risk FactorExplanation
Deep divesMore nitrogen absorbed
Long divesMore nitrogen absorbed
Rapid ascentInsufficient off-gassing time
Repetitive divesNitrogen accumulates across dives
Patent foramen ovale (PFO)Right-to-left shunt allows venous bubbles to enter arterial circulation; 65% of serious DCS cases have a PFO
ObesityNitrogen dissolves more in fat tissue
DehydrationReduces blood volume and gas-exchange efficiency
Cold waterVasoconstriction slows nitrogen washout
Flying after divingAltitude reduces ambient pressure further
AgeReduced cardiovascular fitness
Male sexRisk is 2.5x higher, likely due to risk-taking behavior

Diagnosis

There are no definitive diagnostic tests for DCS. Diagnosis is made clinically by:
  1. Dive profile review (depth, time, ascent rate, repetitive dives)
  2. Symptom timing relative to surfacing
  3. Physical examination
The San Diego Diving and Hyperbaric Organizations point system can help identify DCS with high specificity (90%), but is not universally used. MRI can demonstrate spinal cord injury in severe cases but is not required to start treatment.

Treatment

First Aid (Pre-hospital)

  1. Position the patient horizontally (lateral decubitus if unconscious)
  2. 100% oxygen by mask - accelerates nitrogen washout from tissues and promotes bubble shrinkage
  3. IV or oral isotonic fluids - correct hemoconcentration (use glucose-free IV fluids)
  4. Evacuate to a hyperbaric facility without delay

Definitive Treatment - Hyperbaric Oxygen Therapy (HBOT)

This is the gold-standard treatment. The mechanism works on two levels:
  • Boyle's Law - increased pressure physically compresses and shrinks the bubbles
  • Diffusion gradient - breathing 100% oxygen under pressure creates a huge partial pressure difference that rapidly pulls nitrogen out of bubbles into surrounding tissue and then into blood, where it is exhaled
The standard protocol is U.S. Navy Treatment Table 6:
  • Pressurization to 2.8 ATA (equivalent to 18 meters / 60 feet of seawater)
  • Oxygen breathing with air breaks (to prevent oxygen toxicity)
  • Duration: 4 hours 45 minutes minimum, with extensions as needed
  • Followed by daily shorter sessions while symptoms persist
Mild DCS that has been stable for more than 24 hours may occasionally be managed with surface oxygen alone if evacuation to a chamber is not possible, on the advice of a diving medicine physician. (Harrison's 22E, p. 3811)

Prevention

  • Follow dive tables (U.S. Navy tables) or use a dive computer to stay within no-decompression limits
  • Ascend slowly - the standard rate is 9-18 meters (30-60 feet) per minute
  • Perform safety stops - typically 3-5 minutes at 5 meters (15 feet) before surfacing
  • Avoid flying or traveling to altitude for at least 12-24 hours after diving (PADI recommends 18+ hours after repetitive dives)
  • Stay well hydrated; avoid alcohol before diving
  • Divers with a known large PFO may benefit from cardiology evaluation

In short: DCS is a pressure physics problem - nitrogen that went into solution under high pressure comes out as dangerous bubbles when pressure drops too fast. The treatment reverses the physics by re-applying pressure (hyperbaric chamber) and flooding the body with oxygen to accelerate nitrogen elimination.

CARBONMONOXIDE POISONONG

Finding Sources
Searching the Web

carbon monoxide poisoning pathophysiology symptoms treatment guidelines 2024

Searching Images

carbon monoxide poisoning mechanism carboxyhemoglobin pathophysiology
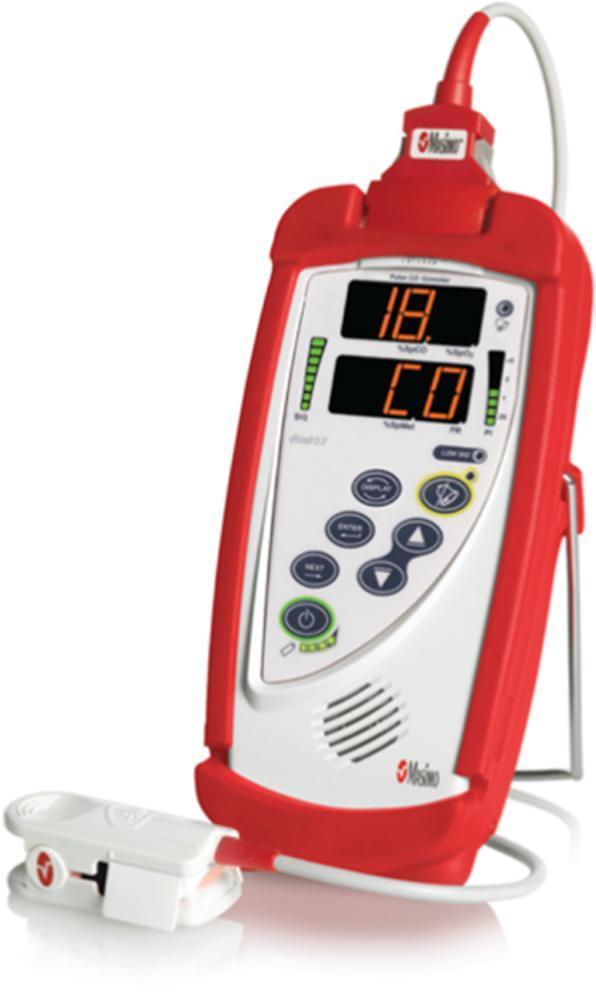
A clinical photograph of the Masimo Rad-57 Pulse CO-Oximeter, a handheld diagnostic device designed for the non-invasive measurement of carboxyhemoglobin (SpCO) and peripheral oxygen saturation (SpO2). The device is encased in a protective red rubberized sleeve and features a prominent LCD digital display. The screen currently indicates a carboxyhemoglobin value of '18' alongside the label 'CO', suggesting a case of carbon monoxide exposure. Flanking the screen are vertical bar graphs for signal strength (SIQ) and plethysmographic variability. The interface includes tactile control buttons for power, navigation (ENTER, NEXT), and display settings. A reusable finger sensor clip is connected via a cord, illustrating the bedside application for rapid screening in emergency medicine, pre-hospital care, and occupational health settings. This tool is critical for the early detection of carbon monoxide poisoning, which can present with non-specific clinical symptoms.
A clinical photograph of the Masimo Rad-57 Pulse CO-Oximeter, a handheld diagnostic device designed for the non-invasive measurement of carboxyhemoglobin (SpCO) and peripheral oxygen saturation (SpO2). The device is encased in a protective red rubberized sleeve and features a prominent LCD digital display. The screen currently indicates a carboxyhemoglobin value of '18' alongside the label 'CO', suggesting a case of carbon monoxide exposure. Flanking the screen are vertical bar graphs for signal strength (SIQ) and plethysmographic variability. The interface includes tactile control buttons for power, navigation (ENTER, NEXT), and display settings. A reusable finger sensor clip is connected via a cord, illustrating the bedside application for rapid screening in emergency medicine, pre-hospital care, and occupational health settings. This tool is critical for the early detection of carbon monoxide poisoning, which can present with non-specific clinical symptoms.

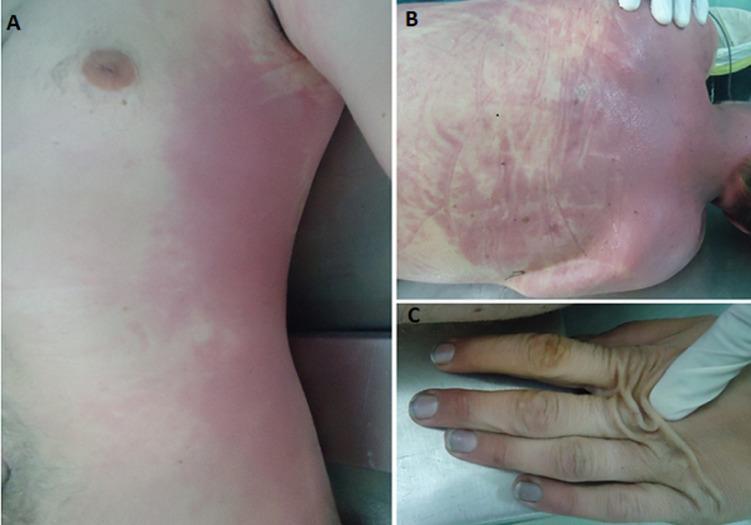
This forensic clinical photograph series documents post-mortem external examination findings in a case of carbon monoxide poisoning. Images A and B illustrate the characteristic cherry-red livor mortis (hypostasis) on the torso. Image A shows a distinct, bright pinkish-red confluent discoloration along the left lateral thoracic and abdominal regions. Image B displays a similar cherry-red distribution across the posterior aspect of the back, exhibiting a patchy, reticulated pattern where pressure from the underlying surface has caused blanched areas. These findings are pathognomonic for high levels of carboxyhemoglobin. Image C is a close-up of the right hand, showing blackish soot incrustations deposited under the fingernails and within the subungual spaces, indicative of proximity to a fire or smoke source. The skin on the dorsal aspect of the hand appears wrinkled and is being manipulated by a gloved examiner to demonstrate texture. These visual markers are critical in forensic medicine for diagnosing lethal carbon monoxide toxicity and understanding the environmental circumstances surrounding the death.
This forensic clinical photograph series documents post-mortem external examination findings in a case of carbon monoxide poisoning. Images A and B illustrate the characteristic cherry-red livor mortis (hypostasis) on the torso. Image A shows a distinct, bright pinkish-red confluent discoloration along the left lateral thoracic and abdominal regions. Image B displays a similar cherry-red distribution across the posterior aspect of the back, exhibiting a patchy, reticulated pattern where pressure from the underlying surface has caused blanched areas. These findings are pathognomonic for high levels of carboxyhemoglobin. Image C is a close-up of the right hand, showing blackish soot incrustations deposited under the fingernails and within the subungual spaces, indicative of proximity to a fire or smoke source. The skin on the dorsal aspect of the hand appears wrinkled and is being manipulated by a gloved examiner to demonstrate texture. These visual markers are critical in forensic medicine for diagnosing lethal carbon monoxide toxicity and understanding the environmental circumstances surrounding the death.

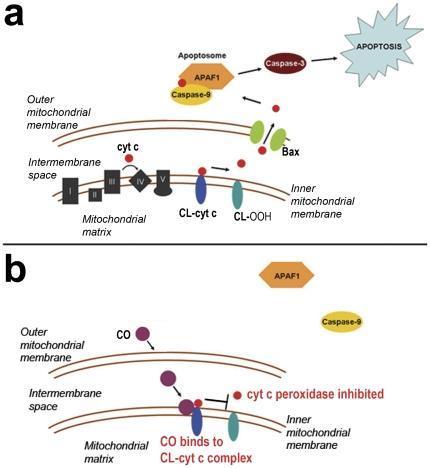
This pathophysiology diagram illustrates the mechanism of carbon monoxide (CO) mediated inhibition of the intrinsic apoptosis pathway. Panel (a) shows the standard intrinsic pathway: Cytochrome c (cyt c) functions within the mitochondrial intermembrane space, interacting with the electron transport chain (Complexes I-V) and cardiolipin (CL) on the inner mitochondrial membrane. Peroxidation of CL to hydroperoxycardiolipin (CL-OOH) facilitates cyt c release through Bax pores in the outer mitochondrial membrane. Once in the cytosol, cyt c binds with APAF1 and Caspase-9 to form the apoptosome, activating Caspase-3 and triggering apoptosis. Panel (b) depicts the inhibitory mechanism of sub-clinical CO. CO molecules diffuse across the outer membrane into the intermembrane space and bind to the cytochrome c-cardiolipin complex (CL-cyt c). This binding inhibits cyt c peroxidase activity, preventing CL oxidation and the subsequent release of cyt c into the cytosol. The diagram demonstrates how CO blocks the upstream signals required for apoptosome assembly and caspase activation, thereby suppressing programmed cell death.
This pathophysiology diagram illustrates the mechanism of carbon monoxide (CO) mediated inhibition of the intrinsic apoptosis pathway. Panel (a) shows the standard intrinsic pathway: Cytochrome c (cyt c) functions within the mitochondrial intermembrane space, interacting with the electron transport chain (Complexes I-V) and cardiolipin (CL) on the inner mitochondrial membrane. Peroxidation of CL to hydroperoxycardiolipin (CL-OOH) facilitates cyt c release through Bax pores in the outer mitochondrial membrane. Once in the cytosol, cyt c binds with APAF1 and Caspase-9 to form the apoptosome, activating Caspase-3 and triggering apoptosis. Panel (b) depicts the inhibitory mechanism of sub-clinical CO. CO molecules diffuse across the outer membrane into the intermembrane space and bind to the cytochrome c-cardiolipin complex (CL-cyt c). This binding inhibits cyt c peroxidase activity, preventing CL oxidation and the subsequent release of cyt c into the cytosol. The diagram demonstrates how CO blocks the upstream signals required for apoptosome assembly and caspase activation, thereby suppressing programmed cell death.

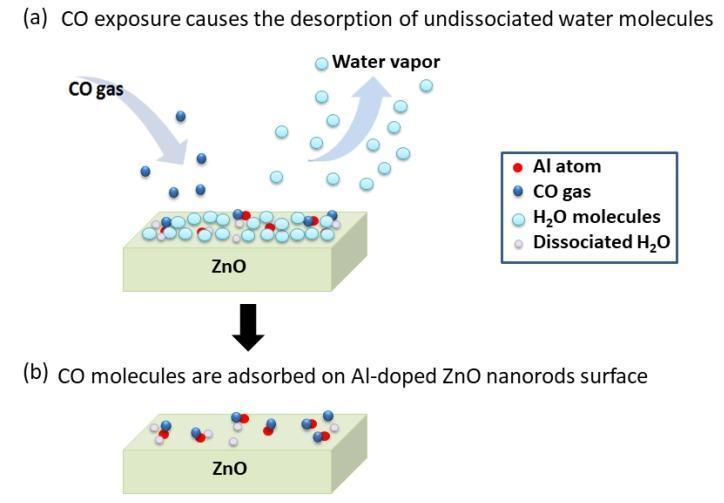
A two-part pathophysiology diagram (labeled a and b) illustrating the chemical sensing mechanism of an Aluminum (Al)-doped Zinc Oxide (ZnO) nanorod-coated microcantilever surface for Carbon Monoxide (CO) detection. 

Panel (a) depicts the initial state under ambient humidity where the ZnO surface is heavily coated with adsorbed H2O molecules (light blue) and dissociated H2O (light gray), alongside Al-doping atoms (red). As CO gas molecules (dark blue) approach the surface, a competitive desorption process is initiated, shown by an arrow representing water vapor leaving the slab.

Panel (b) shows the displaced state where undissociated water molecules have been largely replaced by CO molecules, which preferentially adsorb at the Al-doped sites. The educational focus is on the mass-change detection principle: because the total mass of adsorbed CO is lighter than the displaced water vapor layers, the microcantilever's resonant frequency increases, allowing for sensitive environmental gas monitoring and clinical toxicology applications.
A two-part pathophysiology diagram (labeled a and b) illustrating the chemical sensing mechanism of an Aluminum (Al)-doped Zinc Oxide (ZnO) nanorod-coated microcantilever surface for Carbon Monoxide (CO) detection. Panel (a) depicts the initial state under ambient humidity where the ZnO surface is heavily coated with adsorbed H2O molecules (light blue) and dissociated H2O (light gray), alongside Al-doping atoms (red). As CO gas molecules (dark blue) approach the surface, a competitive desorption process is initiated, shown by an arrow representing water vapor leaving the slab. Panel (b) shows the displaced state where undissociated water molecules have been largely replaced by CO molecules, which preferentially adsorb at the Al-doped sites. The educational focus is on the mass-change detection principle: because the total mass of adsorbed CO is lighter than the displaced water vapor layers, the microcantilever's resonant frequency increases, allowing for sensitive environmental gas monitoring and clinical toxicology applications.

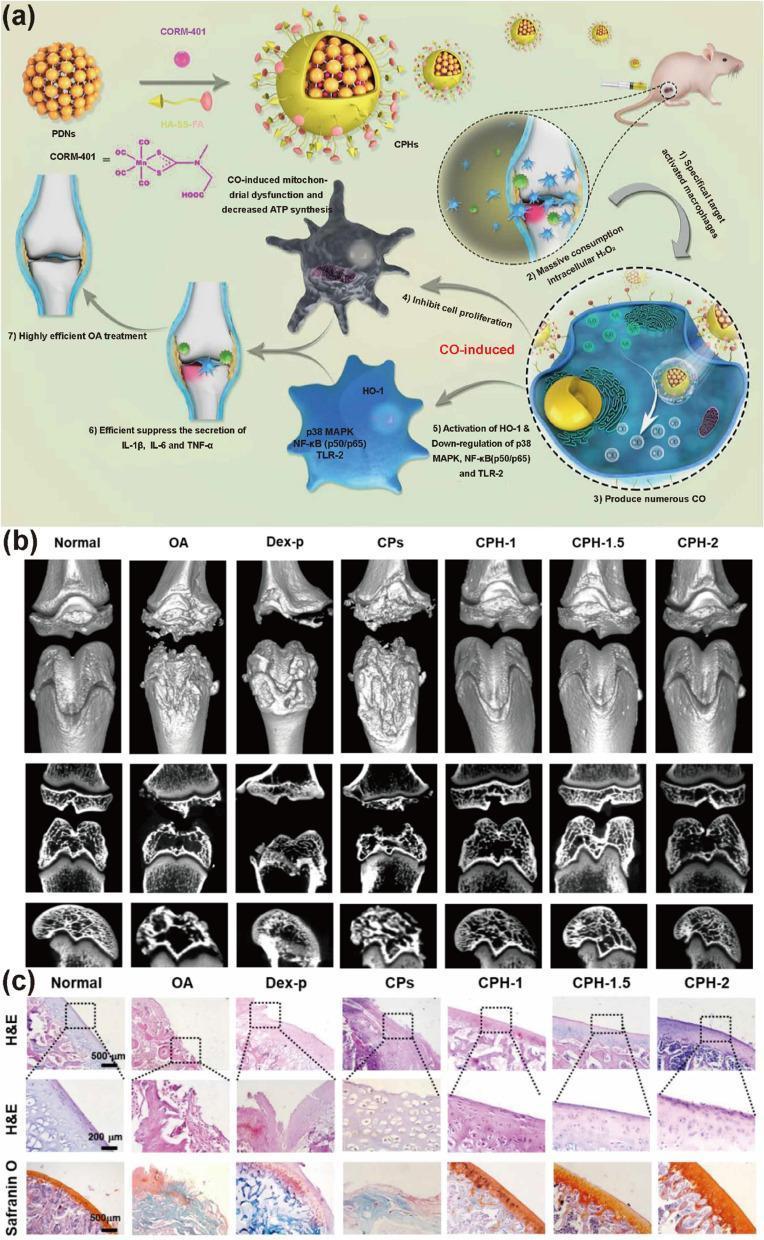
This composite educational graphic illustrates the development and efficacy of carbon monoxide (CO)-releasing nanoparticles (CPHs) for the treatment of osteoarthritis (OA). Section (a) is a pathophysiology diagram showing the mechanism of CO-releasing nanoparticles: they target activated macrophages, consume intracellular hydrogen peroxide (H2O2), and release CO to inhibit pro-inflammatory pathways (p38 MAPK, NF-κB) and suppress cytokines (IL-1β, IL-6, TNF-α). Section (b) displays diagnostic imaging via reconstructed micro-CT of rodent knee joints across various experimental groups: Normal, OA (showing significant subchondral bone degradation), Dex-p (dexamethasone), and escalating doses of CPH (CPH-1 to CPH-2). The images demonstrate a dose-dependent recovery of bone density and joint surface integrity in CPH-treated groups. Section (c) provides histopathological comparison charts using Hematoxylin and Eosin (H&E) and Safranin O staining. In the OA group, there is marked cartilage erosion and proteoglycan loss (decreased orange/red staining). Treatment with CPH-2 shows significant chondroprotection, characterized by restored cartilage thickness, improved cellular organization, and intense Safranin O staining, indicating successful cartilage regeneration.
This composite educational graphic illustrates the development and efficacy of carbon monoxide (CO)-releasing nanoparticles (CPHs) for the treatment of osteoarthritis (OA). Section (a) is a pathophysiology diagram showing the mechanism of CO-releasing nanoparticles: they target activated macrophages, consume intracellular hydrogen peroxide (H2O2), and release CO to inhibit pro-inflammatory pathways (p38 MAPK, NF-κB) and suppress cytokines (IL-1β, IL-6, TNF-α). Section (b) displays diagnostic imaging via reconstructed micro-CT of rodent knee joints across various experimental groups: Normal, OA (showing significant subchondral bone degradation), Dex-p (dexamethasone), and escalating doses of CPH (CPH-1 to CPH-2). The images demonstrate a dose-dependent recovery of bone density and joint surface integrity in CPH-treated groups. Section (c) provides histopathological comparison charts using Hematoxylin and Eosin (H&E) and Safranin O staining. In the OA group, there is marked cartilage erosion and proteoglycan loss (decreased orange/red staining). Treatment with CPH-2 shows significant chondroprotection, characterized by restored cartilage thickness, improved cellular organization, and intense Safranin O staining, indicating successful cartilage regeneration.

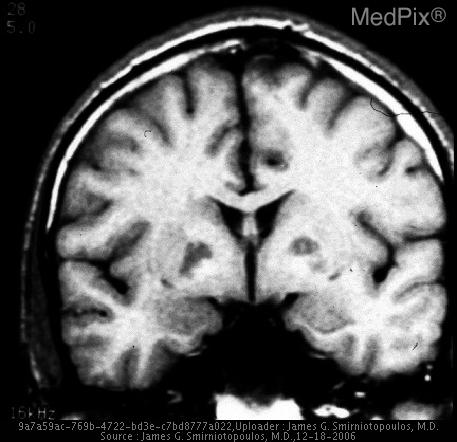
**Imaging Modality:** Magnetic Resonance Imaging (MRI), T1-weighted sequence.

**Anatomical Region:** Coronal section of the brain at the level of the basal ganglia and lateral ventricles.

**Observed Pathology:** Carbon monoxide (CO) poisoning.

**Characteristic Visual Features:** The image demonstrates bilateral, relatively symmetric areas of signal abnormality localized to the globus pallidus. These lesions appear as well-defined, focal regions of hypointensity on this T1-weighted sequence. The surrounding white matter and cortical structures appear grossly preserved, though there is a subtle suggestion of generalized cerebral volume loss.

**Clinical Context:** Bilateral necrosis or signal alteration of the globus pallidus is a hallmark radiologic finding of acute or subacute carbon monoxide toxicity, resulting from the high metabolic demand of these nuclei and the carboxyhemoglobin-induced hypoxic-ischemic insult.

**Key Diagnostic Features:** Symmetric involvement of the globus pallidus is a classic "signature" finding that helps differentiate CO poisoning from other causes of basal ganglia lesions, such as Wilson's disease, cyanide poisoning, or Leigh syndrome.

**Imaging Modality:** Magnetic Resonance Imaging (MRI), T1-weighted sequence. **Anatomical Region:** Coronal section of the brain at the level of the basal ganglia and lateral ventricles. **Observed Pathology:** Carbon monoxide (CO) poisoning. **Characteristic Visual Features:** The image demonstrates bilateral, relatively symmetric areas of signal abnormality localized to the globus pallidus. These lesions appear as well-defined, focal regions of hypointensity on this T1-weighted sequence. The surrounding white matter and cortical structures appear grossly preserved, though there is a subtle suggestion of generalized cerebral volume loss. **Clinical Context:** Bilateral necrosis or signal alteration of the globus pallidus is a hallmark radiologic finding of acute or subacute carbon monoxide toxicity, resulting from the high metabolic demand of these nuclei and the carboxyhemoglobin-induced hypoxic-ischemic insult. **Key Diagnostic Features:** Symmetric involvement of the globus pallidus is a classic "signature" finding that helps differentiate CO poisoning from other causes of basal ganglia lesions, such as Wilson's disease, cyanide poisoning, or Leigh syndrome.

Reading File
Reading File
Reading File
Reading File
Reading File
Loading Image
Reading File
Here is a comprehensive, textbook-grounded guide to carbon monoxide poisoning:

Carbon Monoxide (CO) Poisoning

What Is CO and Why Is It Dangerous?

Carbon monoxide is a colorless, tasteless, odorless gas (sometimes described as having a faint garlicky smell) produced by the incomplete combustion of any carbon-containing material. Because you cannot see, smell, or taste it, it is nicknamed the "silent killer."
Common sources:
  • Car and truck exhaust (7-13% CO) - a 20 HP car can make a small closed garage lethal in under 10 minutes
  • Faulty gas heaters, furnaces, boilers
  • Charcoal grills, portable generators used indoors
  • House fires and burning buildings
  • Coal gas (4-10% CO)
  • Paint strippers containing methylene chloride (metabolized by the liver to CO)
  • Gunpowder and mine explosions (up to 8%)
  • City dwellers and smokers already carry 3-5% carboxyhemoglobin (COHb) baseline
(PC Dikshit Textbook of Forensic Medicine and Toxicology; Miller's Anesthesia 10e)

Mechanism of Toxicity - How CO Kills

CO is a chemical asphyxiant that attacks the body through multiple mechanisms simultaneously:

1. Hemoglobin Binding - Functional Anemia

CO binds hemoglobin with 200-300x greater affinity than oxygen, forming carboxyhemoglobin (COHb). This has two lethal effects:
  • The CO-occupied hemoglobin is completely unavailable to carry oxygen (functional anemia)
  • The remaining hemoglobin grips oxygen more tightly (left shift of the oxyhemoglobin dissociation curve), making it harder to release oxygen to tissues at the capillary level

2. Intracellular Poisoning

CO also binds to intracellular proteins - particularly cytochrome aa3 (the terminal enzyme of the mitochondrial electron transport chain) and myoglobin in muscle. This directly poisons cellular respiration at the level of the mitochondria, independent of hemoglobin effects. This explains why patients can still be severely symptomatic even after COHb levels normalize.

3. Inflammatory Cascade

CO exposure triggers platelet-neutrophil aggregation and neutrophil activation, leading to oxidative stress, endothelial injury, and lipid peroxidation - particularly damaging to the brain and heart.

4. Cardiac Toxicity

CO has a direct toxic effect on the myocardium and causes myocardial ischemia. The heart, like the brain, is extremely sensitive to oxygen deprivation.
(Miller's Anesthesia 10e, p. 10398; Adams and Victor's Principles of Neurology 12e)

Symptoms - Correlated to COHb Levels

COHb LevelSymptoms
3-5%Normal in smokers; no symptoms
10-20%Headache (frontal), mild dizziness, exertional dyspnea
20-30%Throbbing headache, nausea, vomiting, weakness, impaired judgment
30-40%Severe headache, confusion, visual disturbances, ataxia, tachycardia
40-50%Syncope, tachypnea, chest pain, seizures
50-60%Coma, decerebrate or decorticate posturing, cardiovascular collapse
>60%Death
Important caveat: COHb levels measured on arrival correlate poorly with clinical severity. Oxygen given at the scene reduces COHb before the test is done. Patients may still have severe symptoms (mental obtundation, vomiting, persistent headache) despite a normal COHb on arrival because CO remains bound to intracellular sites. (Miller's Anesthesia 10e)
Classic sign - Cherry-red skin: The cherry-red discoloration of skin, lips, and nail beds is often cited but is actually an infrequent finding in living patients; cyanosis is more common. Cherry-red color is much more reliably seen post-mortem (livor mortis).

The Brain in CO Poisoning - A Special Focus

The brain is the most vulnerable organ because of its high metabolic demand and near-zero tolerance for oxygen deprivation.

Acute Brain Injury

  • Cerebral edema
  • Hypodensities in the globus pallidus bilaterally - the hallmark CT/MRI finding

Characteristic MRI Finding - Globus Pallidus Necrosis

MRI brain showing bilateral globus pallidus signal changes in CO poisoning
Bilateral symmetric lesions in the globus pallidus (basal ganglia) are the pathognomonic radiologic signature of CO poisoning. These occur due to the extremely high metabolic demand of these nuclei combined with the hypoxic-ischemic insult from COHb.

Delayed Neuropsychiatric Syndrome (DNS)

This is one of the most feared complications of CO poisoning. After an apparent recovery and a "lucid interval" of days to weeks, patients develop:
  • Parkinsonism (shuffling gait, bradykinesia, mask-like face)
  • Memory and cognitive impairment
  • Personality change, psychosis
  • Urinary incontinence
DNS occurs in ~3% of all CO poisoning cases and up to 12% of hospitalized patients. Three-quarters of patients with DNS recover within a year. Risk is higher in those who experienced prolonged coma and in older patients (≥36 years). (Adams and Victor's Principles of Neurology 12e, p. 1142)

Diagnosis

Clinical: History of exposure is the most important clue. Classic presentation: multiple people in the same household develop headache and flu-like symptoms simultaneously (without fever) - strongly suggests CO leak.
Blood test: Serum COHb level by co-oximetry (standard pulse oximetry falsely reads normal SpO2 because it cannot distinguish oxyhemoglobin from carboxyhemoglobin). Venous or arterial blood - COHb is stable for several days in anticoagulated samples.
Point-of-care: The Masimo Rad-57 pulse CO-oximeter can non-invasively screen for elevated COHb, useful in triage.
Masimo Rad-57 pulse CO-oximeter showing elevated CO reading
ECG: Look for myocardial ischemia, arrhythmias. Troponin should be measured in moderate-severe cases.
Brain imaging (CT/MRI): Not required for diagnosis but useful for prognosis - lesions in the globus pallidus AND white matter together predict poor long-term outcomes.

Treatment

Step 1 - Remove from Source

Get the patient out of the contaminated environment immediately.

Step 2 - 100% Normobaric Oxygen

High-flow 100% oxygen via a non-rebreather mask is the cornerstone of treatment. It works by:
  • Outcompeting CO for hemoglobin binding sites
  • Dramatically reducing the COHb half-life:
Breathing air (room air)~5 hours
100% O₂ at normal pressure~60-90 minutes
Hyperbaric O₂ at 2.5 ATA~20 minutes

Step 3 - Hyperbaric Oxygen Therapy (HBOT)

HBOT is indicated for severe or high-risk cases. Consensus guidelines recommend 2.8-3 ATA for 1-3 sessions until clinically stable. (Miller's Anesthesia 10e)
Indications for HBOT in CO poisoning include:
  • Loss of consciousness (any duration)
  • Neurologic symptoms (confusion, seizures, focal deficits)
  • COHb > 25%
  • Myocardial ischemia or arrhythmia
  • Metabolic acidosis
  • Pregnancy (fetal hemoglobin is especially susceptible to CO)
  • Age ≥ 36 years (higher risk of DNS)
  • Persistent symptoms despite normobaric oxygen
How HBOT works here: At 2.8-3 ATA, the massively increased oxygen partial pressure displaces CO from hemoglobin AND from intracellular binding sites (cytochrome aa3, myoglobin) far more rapidly. It also floods ischemic brain and heart tissue with dissolved plasma oxygen, and reduces the neuroinflammatory cascade that drives DNS.
A landmark RCT (Weaver et al., NEJM 2002) showed HBOT significantly reduced cognitive sequelae at 6, 12, and 24 weeks follow-up compared to normobaric oxygen.

Supportive Care

  • IV fluids
  • Treat seizures (benzodiazepines)
  • Manage arrhythmias
  • Suspected concomitant cyanide poisoning (in fire victims): treat with hydroxocobalamin empirically - cyanide and CO frequently co-occur in smoke inhalation and produce synergistic toxicity

Special Populations

Pregnancy

The fetus is especially vulnerable - fetal hemoglobin has even higher affinity for CO than adult hemoglobin, and fetal tissues have a high metabolic demand. Pregnant women with any significant CO exposure should receive HBOT. The benefits outweigh theoretical fetal risks.

Pre-existing Conditions

Patients with anemia, coronary artery disease, or pulmonary disease tolerate CO poisoning far less well and may be critically ill at COHb levels that would only cause mild symptoms in healthy adults.

Post-mortem / Forensic Features

  • Cherry-red livor mortis - the classic post-mortem finding; skin, mucous membranes, and internal organs have a bright pink-red color because COHb cannot be reduced by post-mortem tissue metabolism
  • Bullous skin lesions similar to third-degree burns - diagnostic of CO poisoning at autopsy
  • In fire deaths, COHb > 50% confirms CO as the cause of death
  • CO poisoning is mostly accidental; suicidal CO poisoning is more common in Western countries (car exhaust in a closed garage)
(PC Dikshit Forensic Medicine and Toxicology; Adams and Victor's Neurology 12e)

Summary Table

FeatureDetail
Gas propertiesColorless, odorless, tasteless
Mechanism200-300x affinity for Hb → COHb; also poisons mitochondria
Key targetsBrain (globus pallidus), heart
Classic symptomHeadache + nausea in multiple people simultaneously
Pulse oximetryFalsely normal - use co-oximetry
Half-life on air~5 hours
Half-life on 100% O₂~60-90 min
Half-life on HBOT~20 min
Key complicationDelayed Neuropsychiatric Syndrome (days to weeks post-exposure)
Hallmark imagingBilateral globus pallidus necrosis on CT/MRI
First aidRemove from source + 100% O₂
Definitive treatmentHBOT at 2.8-3 ATA

make a summary of it in one paragarph

Carbon monoxide (CO) poisoning is a potentially fatal condition caused by inhaling this colorless, odorless gas produced by the incomplete combustion of carbon-based fuels from sources such as car exhaust, faulty heaters, generators, and house fires. CO binds hemoglobin with 200-300 times greater affinity than oxygen, forming carboxyhemoglobin (COHb) that cannot carry oxygen, while simultaneously shifting the oxyhemoglobin dissociation curve leftward and poisoning mitochondrial cytochrome aa3 - causing cellular energy failure independent of blood oxygen levels. Symptoms range from headache, nausea, and dizziness at low COHb levels (10-20%), progressing to confusion, seizures, coma, and death at levels above 50-60%. The brain and heart are the most vulnerable organs; the hallmark imaging finding is bilateral globus pallidus necrosis on CT/MRI. A feared late complication is Delayed Neuropsychiatric Syndrome, where patients appear to recover but then develop Parkinsonism, memory loss, and personality changes days to weeks later. Diagnosis requires co-oximetry (standard pulse oximetry gives falsely normal readings) and COHb levels, though these correlate poorly with clinical severity. Treatment starts with immediate removal from the source and 100% normobaric oxygen (which cuts COHb half-life from ~5 hours to ~60-90 minutes), with hyperbaric oxygen therapy (HBOT at 2.8-3 ATA, ~20-minute half-life) reserved for severe cases involving loss of consciousness, neurologic symptoms, COHb >25%, cardiac ischemia, or pregnancy.

What are the signs of cyanide poisoning and how do they differ from CO poisoning?oth edition and Moores clinically orientated anatomy.

Finding Sources
Searching the Web

cyanide poisoning signs symptoms vs carbon monoxide poisoning differences clinical

Searching Images

cyanide poisoning mechanism cytochrome oxidase vs carbon monoxide comparison

This pathophysiology diagram illustrates the mechanism of carbon monoxide (CO) mediated inhibition of the intrinsic apoptosis pathway. Panel (a) shows the standard intrinsic pathway: Cytochrome c (cyt c) functions within the mitochondrial intermembrane space, interacting with the electron transport chain (Complexes I-V) and cardiolipin (CL) on the inner mitochondrial membrane. Peroxidation of CL to hydroperoxycardiolipin (CL-OOH) facilitates cyt c release through Bax pores in the outer mitochondrial membrane. Once in the cytosol, cyt c binds with APAF1 and Caspase-9 to form the apoptosome, activating Caspase-3 and triggering apoptosis. Panel (b) depicts the inhibitory mechanism of sub-clinical CO. CO molecules diffuse across the outer membrane into the intermembrane space and bind to the cytochrome c-cardiolipin complex (CL-cyt c). This binding inhibits cyt c peroxidase activity, preventing CL oxidation and the subsequent release of cyt c into the cytosol. The diagram demonstrates how CO blocks the upstream signals required for apoptosome assembly and caspase activation, thereby suppressing programmed cell death.
This pathophysiology diagram illustrates the mechanism of carbon monoxide (CO) mediated inhibition of the intrinsic apoptosis pathway. Panel (a) shows the standard intrinsic pathway: Cytochrome c (cyt c) functions within the mitochondrial intermembrane space, interacting with the electron transport chain (Complexes I-V) and cardiolipin (CL) on the inner mitochondrial membrane. Peroxidation of CL to hydroperoxycardiolipin (CL-OOH) facilitates cyt c release through Bax pores in the outer mitochondrial membrane. Once in the cytosol, cyt c binds with APAF1 and Caspase-9 to form the apoptosome, activating Caspase-3 and triggering apoptosis. Panel (b) depicts the inhibitory mechanism of sub-clinical CO. CO molecules diffuse across the outer membrane into the intermembrane space and bind to the cytochrome c-cardiolipin complex (CL-cyt c). This binding inhibits cyt c peroxidase activity, preventing CL oxidation and the subsequent release of cyt c into the cytosol. The diagram demonstrates how CO blocks the upstream signals required for apoptosome assembly and caspase activation, thereby suppressing programmed cell death.

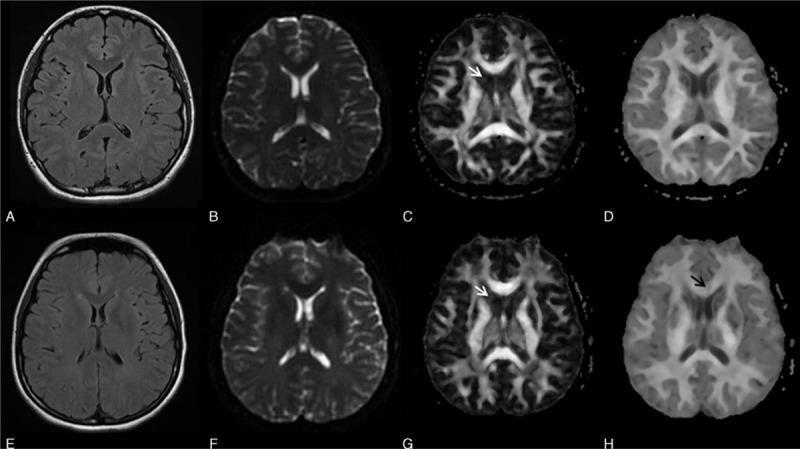
This diagnostic comparison uses axial brain MRI sequences to illustrate neuroimaging findings in acute carbon monoxide (CO) poisoning. The top row (A-D) shows a healthy control subject, while the bottom row (E-H) represents a patient four days after CO exposure. The imaging modalities include Fluid-Attenuated Inversion Recovery (FLAIR; A, E), T2-weighted imaging (B, F), Fractional Anisotropy (FA) maps (C, G), and Mean Kurtosis (MK) maps (D, H). While conventional FLAIR, T2, and FA maps appear unremarkable and show no visible pathology in the acute phase, the MK map (H) reveals a distinct region of hypointensity in the genu of the corpus callosum (indicated by a black arrow), reflecting early microstructural white matter changes. Additionally, white arrows highlight that the MK maps (D, H) provide superior anatomical delineation between the caudate nuclei and lateral ventricles compared to FA maps (C, G), due to reduced sensitivity to cerebrospinal fluid (CSF) contamination. This educational comparison demonstrates the increased sensitivity of Diffusional Kurtosis Imaging (DKI) in detecting acute toxic-ischemic encephalopathy.
This diagnostic comparison uses axial brain MRI sequences to illustrate neuroimaging findings in acute carbon monoxide (CO) poisoning. The top row (A-D) shows a healthy control subject, while the bottom row (E-H) represents a patient four days after CO exposure. The imaging modalities include Fluid-Attenuated Inversion Recovery (FLAIR; A, E), T2-weighted imaging (B, F), Fractional Anisotropy (FA) maps (C, G), and Mean Kurtosis (MK) maps (D, H). While conventional FLAIR, T2, and FA maps appear unremarkable and show no visible pathology in the acute phase, the MK map (H) reveals a distinct region of hypointensity in the genu of the corpus callosum (indicated by a black arrow), reflecting early microstructural white matter changes. Additionally, white arrows highlight that the MK maps (D, H) provide superior anatomical delineation between the caudate nuclei and lateral ventricles compared to FA maps (C, G), due to reduced sensitivity to cerebrospinal fluid (CSF) contamination. This educational comparison demonstrates the increased sensitivity of Diffusional Kurtosis Imaging (DKI) in detecting acute toxic-ischemic encephalopathy.

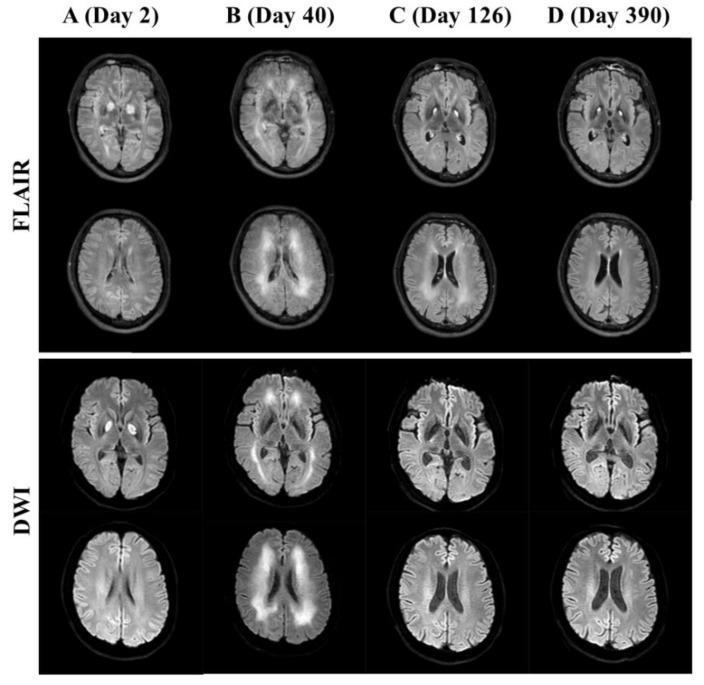
This diagnostic image grid displays serial axial brain magnetic resonance imaging (MRI) of a patient following carbon monoxide (CO) poisoning. The grid compares two modalities—Fluid-Attenuated Inversion Recovery (FLAIR) and Diffusion-Weighted Imaging (DWI)—across four time points: Day 2 (A), Day 40 (B), Day 126 (C), and Day 390 (D).

Key findings include:
- Day 2: Symmetric hyperintense lesions are prominent in the bilateral globus pallidus, characteristic of acute CO-induced necrosis.
- Day 40: Development of extensive, symmetric hyperintensities in the subcortical and periventricular white matter, representing delayed neuropsychiatric syndrome (DNS) or leukoencephalopathy.
- Day 126: Significant interval reduction in the intensity and extent of the white matter lesions.
- Day 390: Resolution of the white matter abnormalities, while the bilateral globus pallidus lesions persist as chronic findings.

The comparison demonstrates the temporal evolution of CO-induced brain injury, showing the transition from acute basal ganglia damage to delayed white matter involvement and eventual partial radiological recovery. This series is an educational example of neurotoxicology and metabolic encephalopathy.
This diagnostic image grid displays serial axial brain magnetic resonance imaging (MRI) of a patient following carbon monoxide (CO) poisoning. The grid compares two modalities—Fluid-Attenuated Inversion Recovery (FLAIR) and Diffusion-Weighted Imaging (DWI)—across four time points: Day 2 (A), Day 40 (B), Day 126 (C), and Day 390 (D). Key findings include: - Day 2: Symmetric hyperintense lesions are prominent in the bilateral globus pallidus, characteristic of acute CO-induced necrosis. - Day 40: Development of extensive, symmetric hyperintensities in the subcortical and periventricular white matter, representing delayed neuropsychiatric syndrome (DNS) or leukoencephalopathy. - Day 126: Significant interval reduction in the intensity and extent of the white matter lesions. - Day 390: Resolution of the white matter abnormalities, while the bilateral globus pallidus lesions persist as chronic findings. The comparison demonstrates the temporal evolution of CO-induced brain injury, showing the transition from acute basal ganglia damage to delayed white matter involvement and eventual partial radiological recovery. This series is an educational example of neurotoxicology and metabolic encephalopathy.

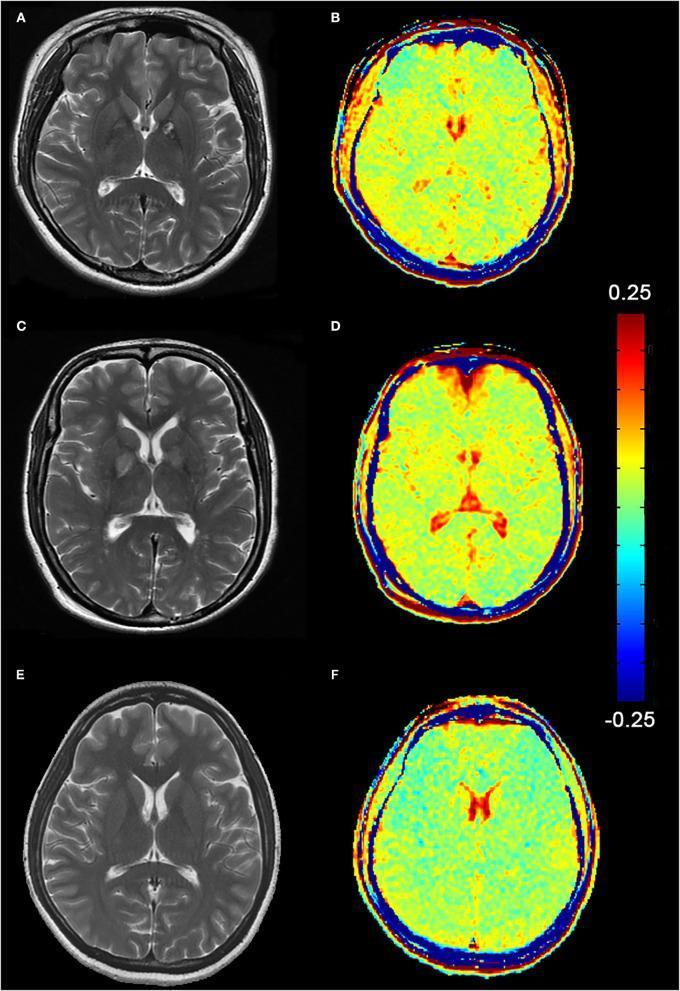
A comparative diagnostic imaging panel showing axial brain MRI slices from two patients with acute carbon monoxide (CO) poisoning (A-D) and one healthy control (E-F). The panel contrasts structural T2-weighted imaging (T2WI) with functional Glutamate Chemical Exchange Saturation Transfer (GluCEST) mapping. Subfigures A and C (T2WI) reveal bilateral hyperintensities in the globus pallidus, a characteristic sign of CO-induced hypoxic-ischemic injury. Subfigures B and D display the corresponding GluCEST maps, where a color-coded scale (ranging from -0.25 to 0.25) indicates higher glutamate levels in shades of yellow and red. These maps demonstrate markedly elevated GluCEST signals in the basal ganglia and cerebral white matter of the patients compared to the control. In contrast, subfigures E (T2WI) and F (GluCEST) show normal neuroanatomy and a uniform, low-intensity glutamate distribution. This educational comparison highlights the utility of metabolic CEST imaging in detecting neurochemical alterations that correlate with structural damage in toxic encephalopathy.
A comparative diagnostic imaging panel showing axial brain MRI slices from two patients with acute carbon monoxide (CO) poisoning (A-D) and one healthy control (E-F). The panel contrasts structural T2-weighted imaging (T2WI) with functional Glutamate Chemical Exchange Saturation Transfer (GluCEST) mapping. Subfigures A and C (T2WI) reveal bilateral hyperintensities in the globus pallidus, a characteristic sign of CO-induced hypoxic-ischemic injury. Subfigures B and D display the corresponding GluCEST maps, where a color-coded scale (ranging from -0.25 to 0.25) indicates higher glutamate levels in shades of yellow and red. These maps demonstrate markedly elevated GluCEST signals in the basal ganglia and cerebral white matter of the patients compared to the control. In contrast, subfigures E (T2WI) and F (GluCEST) show normal neuroanatomy and a uniform, low-intensity glutamate distribution. This educational comparison highlights the utility of metabolic CEST imaging in detecting neurochemical alterations that correlate with structural damage in toxic encephalopathy.

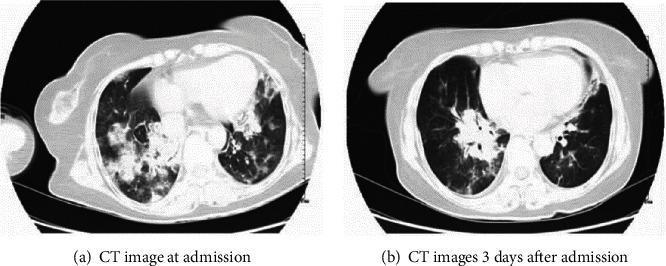
This Comparison Chart features two side-by-side axial non-contrast CT scans of the chest demonstrating the progression of pulmonary complications in a patient with acute carbon monoxide poisoning and aspiration pneumonia. Image (a), taken at admission, shows diffuse bilateral thickening of the lung texture with extensive ground-glass opacities (GGO) and multifocal, high-density nodular and patchy shadows. These abnormalities exhibit fuzzy margins and are predominantly distributed in the inner and middle lung zones, particularly in the upper lobes, resulting in significantly decreased overall pulmonary light transmittance. Image (b), obtained 3 days post-admission, reveals a marked radiological improvement. While some residual patchy shadows and ground-glass opacities persist, the density and extent of the pulmonary edema and inflammatory infiltrates have substantially diminished. This series illustrates the acute parenchymal changes and rapid initial recovery typical of CO-induced toxic pulmonary edema when managed with supportive care. The content is suitable for intermediate to advanced medical students and radiology residents focusing on emergency medicine and pulmonary pathology.
This Comparison Chart features two side-by-side axial non-contrast CT scans of the chest demonstrating the progression of pulmonary complications in a patient with acute carbon monoxide poisoning and aspiration pneumonia. Image (a), taken at admission, shows diffuse bilateral thickening of the lung texture with extensive ground-glass opacities (GGO) and multifocal, high-density nodular and patchy shadows. These abnormalities exhibit fuzzy margins and are predominantly distributed in the inner and middle lung zones, particularly in the upper lobes, resulting in significantly decreased overall pulmonary light transmittance. Image (b), obtained 3 days post-admission, reveals a marked radiological improvement. While some residual patchy shadows and ground-glass opacities persist, the density and extent of the pulmonary edema and inflammatory infiltrates have substantially diminished. This series illustrates the acute parenchymal changes and rapid initial recovery typical of CO-induced toxic pulmonary edema when managed with supportive care. The content is suitable for intermediate to advanced medical students and radiology residents focusing on emergency medicine and pulmonary pathology.

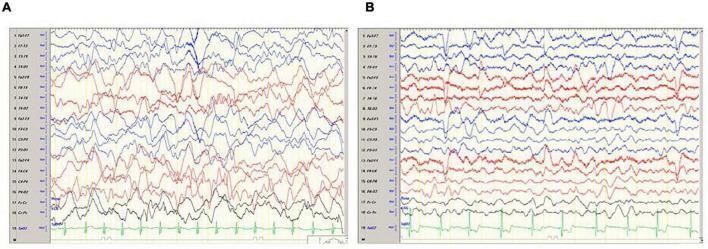
This diagnostic image shows a side-by-side comparison of two longitudinal bipolar montage electroencephalograms (EEG) from a pediatric patient following carbon monoxide (CO) poisoning, illustrating the progression of encephalopathy. Panel A (day 6 post-exposure) displays severe diffuse slowing characterized by high-amplitude delta wave activity (<4 Hz) across all leads, with a lack of normal posterior dominant rhythm and absence of focal or epileptiform discharges. Panel B (day 10 post-exposure) demonstrates clinical and neurophysiological improvement, showing a transition to lower-amplitude, higher-frequency theta waves (4–7 Hz). While some residual delta activity remains, the overall background activity reflects a recovering cortical state. Both panels include a single-lead EKG rhythm strip at the bottom for cardiac monitoring. This comparison serves as a diagnostic tool for monitoring neurological recovery and the severity of toxic-ischemic brain injury in acute CO poisoning cases.

This diagnostic image shows a side-by-side comparison of two longitudinal bipolar montage electroencephalograms (EEG) from a pediatric patient following carbon monoxide (CO) poisoning, illustrating the progression of encephalopathy. Panel A (day 6 post-exposure) displays severe diffuse slowing characterized by high-amplitude delta wave activity (<4 Hz) across all leads, with a lack of normal posterior dominant rhythm and absence of focal or epileptiform discharges. Panel B (day 10 post-exposure) demonstrates clinical and neurophysiological improvement, showing a transition to lower-amplitude, higher-frequency theta waves (4–7 Hz). While some residual delta activity remains, the overall background activity reflects a recovering cortical state. Both panels include a single-lead EKG rhythm strip at the bottom for cardiac monitoring. This comparison serves as a diagnostic tool for monitoring neurological recovery and the severity of toxic-ischemic brain injury in acute CO poisoning cases.

Make short notes on head and neck region using Moore's clinically oriented anatomy and BD Chaurasia's 10th edition and according to main topic and its subtopic.

Finding Sources
Finding Sources
Finding Sources
Finding Sources
Finding Sources
Finding Sources
Your credits are exhausted. You can purchase a top-up or subscribe to a plan to continue using Orris. If you're already subscribed, your daily credits will reset tomorrow.
This is a shared conversation. Sign in to Orris to start your own chat.