
Role of PDL1 in cancer therapy
PD-L1 cancer immunotherapy checkpoint inhibitor
PD-L1 PD-1 checkpoint pathway cancer immunotherapy mechanism
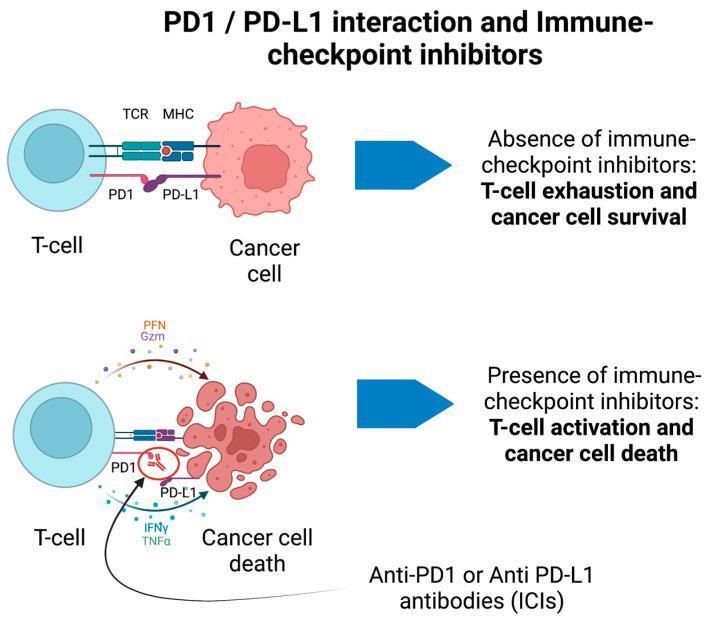
A pathophysiology diagram illustrating the mechanism of immune checkpoint inhibitors (ICIs) in cancer immunotherapy, specifically focusing on the PD1/PD-L1 pathway. The diagram is split into two comparative scenarios. The top section depicts the 'Absence of immune-checkpoint inhibitors,' where a T-cell's PD1 receptor binds to a cancer cell's PD-L1 receptor. Despite TCR-MHC engagement, this inhibitory binding leads to T-cell exhaustion and cancer cell survival. The bottom section depicts the 'Presence of immune-checkpoint inhibitors,' where anti-PD1 or anti-PD-L1 antibodies (ICIs) block the PD1/PD-L1 interaction (represented by a red 'no' symbol). This blockade results in T-cell activation, evidenced by the release of effector molecules like Perforin (PFN), Granzyme (Gzm), Interferon-gamma (IFNy), and Tumor Necrosis Factor-alpha (TNFa). The consequence is visualized as 'Cancer cell death,' shown by the fragmentation and lysis of the cancer cell. The diagram serves as an educational tool for oncology and immunology, explaining how checkpoint blockade restores the cytotoxic antitumor response.
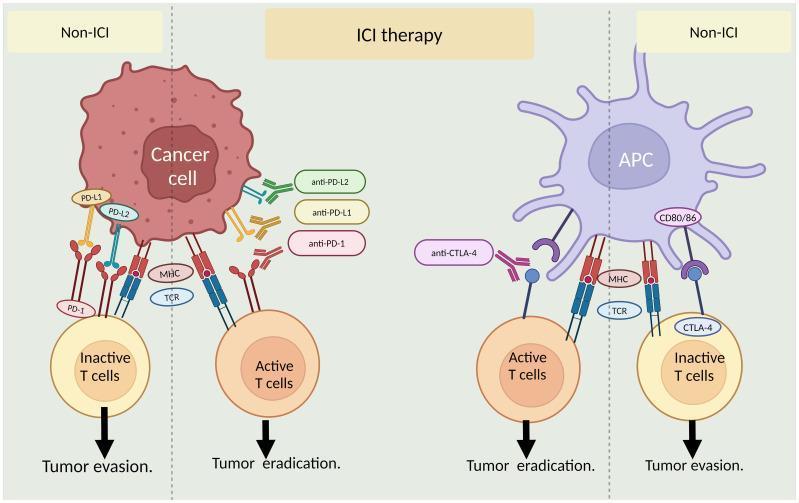
A pathophysiology diagram illustrating the mechanism of immune checkpoint inhibitors (ICI) in cancer immunotherapy. The illustration is divided into two main panels comparing 'Non-ICI' and 'ICI therapy' conditions. The left panel depicts interactions between a cancer cell and a T-cell; in the 'Non-ICI' state, PD-L1/PD-L2 on the cancer cell binds to PD-1 on the T-cell, leading to T-cell inactivation and tumor evasion. Under 'ICI therapy,' antibodies (anti-PD-1, anti-PD-L1, anti-PD-L2) block these inhibitory receptors, resulting in an active T-cell and tumor eradication. The right panel shows the interaction between an antigen-presenting cell (APC) and a T-cell. In the 'Non-ICI' state, CD80/86 on the APC binds to CTLA-4 on the T-cell, causing inactivation and tumor evasion. Under 'ICI therapy,' anti-CTLA-4 antibodies block this pathway, facilitating T-cell activation and tumor eradication. Both panels include common MHC-TCR complex signaling. This educational graphic demonstrates how monoclonal antibodies restore the anti-tumor immune response by preventing inhibitory checkpoint signaling.
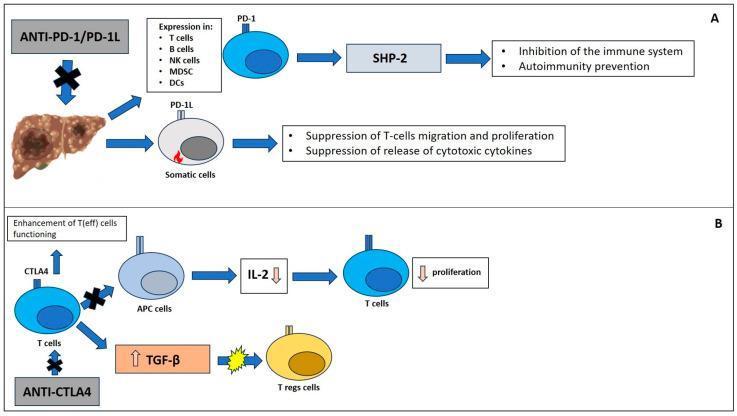
This medical illustration depicts two major immune checkpoint pathways, PD-1/PD-L1 and CTLA-4, in the context of cancer immunology and immunotherapy. Section A illustrates the PD-1/PD-L1 pathway, showing a tumor-burdened liver associated with the expression of PD-1 in various immune cells including T cells, B cells, NK cells, MDSC, and DCs. This signaling involves the tyrosine phosphatase SHP-2, leading to the inhibition of the immune system and prevention of autoimmunity. Simultaneously, PD-L1 expression on somatic cells is shown to suppress T-cell migration, proliferation, and the release of cytotoxic cytokines. Section B details the CTLA-4 pathway, demonstrating how CTLA-4 expression on T cells interacts with Antigen-Presenting Cells (APCs), resulting in decreased IL-2 levels and subsequent inhibition of T-cell proliferation. It also shows the role of CTLA-4 in stimulating TGF-β, which influences Regulatory T cells (Tregs). The diagram highlights the clinical application of Anti-PD-1/PD-L1 and Anti-CTLA-4 therapies (Immune Checkpoint Inhibitors) in enhancing effector T-cell function (T(eff)) for treating malignancies such as hepatocellular carcinoma (HCC).
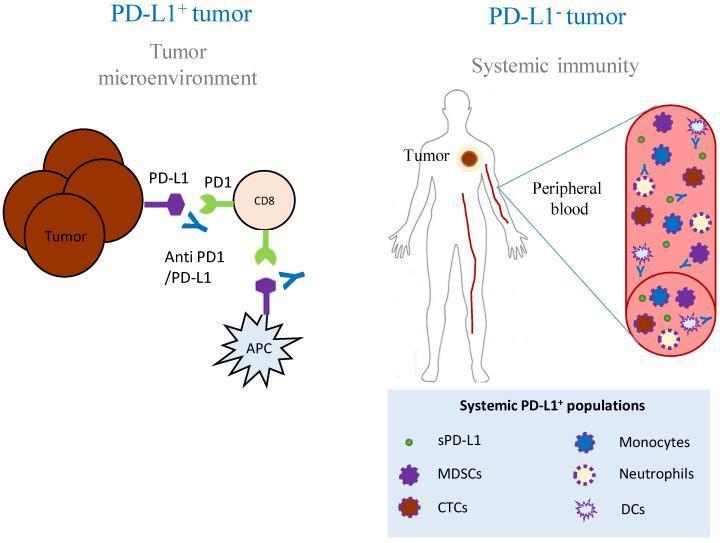
This medical pathophysiology diagram illustrates the role of PD-L1 expression in cancer immunotherapy, specifically comparing a PD-L1 positive tumor microenvironment (TME) with systemic PD-L1 expression in patients with PD-L1 negative tumors. The left panel shows a PD-L1 positive tumor where tumor cells and antigen-presenting cells (APCs) utilize the PD-L1/PD-1 pathway to inhibit CD8+ T cells. Therapeutic anti-PD1/PD-L1 antibodies are depicted blocking these interactions to restore immune response. The right panel illustrates the concept of 'Systemic Immunity' in a PD-L1 negative tumor context, featuring a human silhouette with an enlarged view of peripheral blood. This section identifies systemic PD-L1 positive populations that may influence clinical responses even when the primary tumor is PD-L1 negative. These populations include soluble PD-L1 (sPD-L1), myeloid-derived suppressor cells (MDSCs), circulating tumor cells (CTCs), monocytes, neutrophils, and dendritic cells (DCs). This diagram highlights the significance of the myeloid compartment and circulating biomarkers in patient stratification for immune checkpoint inhibitor (ICI) therapy in oncology.
Role of PD-L1 in Cancer Therapy
1. What Is PD-L1?
2. Physiological Role - The PD-1/PD-L1 Pathway
- Inhibition of TCR signaling
- Reduced T-cell proliferation
- Decreased cytokine secretion (IFN-γ, TNF-α)
- Promotion of T-cell exhaustion and apoptosis
3. How Cancers Exploit PD-L1 - Immune Evasion
a) Constitutive/Intrinsic Expression
b) Adaptive Immune Resistance (the dominant mechanism)
4. Immune Checkpoint Blockade - The Therapeutic Strategy
- Increased IFN-γ, TNF-α, perforin, and granzyme B release
- Cancer cell lysis
- Durable antitumor memory responses
5. FDA-Approved Agents Targeting PD-L1 and PD-1
Anti-PD-L1 Antibodies (directly target PD-L1 on tumor cells)
| Drug | Class | Approvals |
|---|---|---|
| Atezolizumab | Humanized IgG1 mAb | Urothelial cancer, NSCLC, SCLC (+carboplatin/etoposide), TNBC (+paclitaxel), HCC (+bevacizumab), melanoma (+cobimetinib/vemurafenib) |
| Durvalumab | Human IgG1κ mAb | Metastatic urothelial cancer, advanced NSCLC, SCLC (+etoposide/platinum) |
| Avelumab | Human IgG1κ mAb | Merkel cell carcinoma, urothelial cancer, RCC (+axitinib) |
- Goodman & Gilman's, pp. 1443-1284
Anti-PD-1 Antibodies (block PD-1 on T cells, preventing PD-L1/PD-L2 engagement)
| Drug | Notes |
|---|---|
| Pembrolizumab | Humanized IgG4; broadest approvals (melanoma, NSCLC, bladder, MSI-H cancers, TNBC, cervical, endometrial, TMB-high solid tumors, others) |
| Nivolumab | Human IgG4; melanoma, NSCLC, RCC, bladder, HNSCC, HCC, CRC, esophageal cancer |
| Cemiplimab | Human IgG4; cutaneous SCC, BCC, NSCLC with high PD-L1 |
| Dostarlimab | Humanized IgG4; mismatch repair-deficient endometrial cancer |
6. Clinical Efficacy - Key Trial Evidence
Bladder Cancer (strongest PD-L1 evidence in GU oncology)
- Pembrolizumab vs. chemotherapy (Phase III): Median OS 10.3 months vs. 7.4 months (P = 0.002); ORR 21.1% vs. 11.4% in platinum-refractory disease. - Campbell-Walsh Urology, p. 1751
- Atezolizumab (IMvigor 210, Phase II): ORR 14.8% in second-line urothelial cancer; ORR 23% as first-line in cisplatin-ineligible patients.
- Five anti-PD-1/PD-L1 agents are FDA-approved for second-line metastatic bladder cancer with ORRs of 15-23%.
Renal Cell Carcinoma (RCC)
- Nivolumab vs. everolimus (CheckMate 025, Phase III): Median OS 25.0 months vs. 19.6 months; ORR 24% vs. 5%. - Campbell-Walsh Urology, p. 1751
Advanced Melanoma
- Ipilimumab (anti-CTLA-4) + nivolumab (anti-PD-1): >50% tumor response rate; 5-year OS of 52% vs. 44% with nivolumab alone and 26% with ipilimumab alone. - Goodman & Gilman's, p. 1444
Lung Cancer (NSCLC - 2026 Update)
Prostate Cancer (limited response)
7. PD-L1 as a Biomarker
- Combined Positive Score (CPS): Counts PD-L1-positive tumor cells, lymphocytes, and macrophages relative to total tumor cells. Used for pembrolizumab in multiple indications (threshold varies: CPS ≥1, ≥10, ≥22 depending on cancer type).
- Tumor Proportion Score (TPS): Only counts PD-L1 expression on tumor cells. Used for NSCLC; TPS ≥50% selects for pembrolizumab monotherapy.
- Intratumoral heterogeneity (expression varies within the same tumor)
- Discordance between primary and metastatic sites
- Some PD-L1-negative tumors still respond; some PD-L1-high tumors do not
- Other biomarkers (tumor mutational burden/TMB, microsatellite instability/MSI, tumor-infiltrating lymphocyte density) are complementary
8. Combination Strategies
Anti-PD-L1 + Anti-CTLA-4 (Dual Checkpoint Blockade)
Anti-PD-L1 + Chemotherapy
Anti-PD-L1 + Targeted Therapy
- Atezolizumab + bevacizumab (anti-VEGF) in HCC - VEGF suppresses immune activity, so its blockade complements PD-L1 inhibition.
- Avelumab + axitinib (VEGFR inhibitor) in RCC.
Anti-PD-L1 + Antibody-Drug Conjugates (ADCs)
Anti-PD-L1 + PARP Inhibitors
9. Immune-Related Adverse Events (irAEs)
| System | Adverse Event |
|---|---|
| Pulmonary | Pneumonitis |
| Gastrointestinal | Colitis, diarrhea |
| Hepatic | Immune hepatitis |
| Endocrine | Hypothyroidism, hyperthyroidism, hypophysitis, adrenal insufficiency, Type 1 diabetes |
| Neurological | Myasthenia gravis, Guillain-Barré syndrome |
| Dermatologic | Pruritus, rash |
| Renal | Nephritis |
10. Novel and Emerging Targets Beyond PD-L1/PD-1
Summary
- PD-L1 expression drives patient selection but is imperfect
- Anti-PD-L1 and anti-PD-1 drugs have overlapping but distinct profiles
- Combination strategies (dual checkpoint, + chemo, + targeted therapy) extend benefit
- irAEs require early recognition and immunosuppressive management
- Resistance (primary and acquired) remains the major unsolved challenge
Sources: Goodman & Gilman's Pharmacological Basis of Therapeutics, pp. 1441-1444; Campbell-Walsh Urology, pp. 1748-1753; Recent PubMed evidence: PMIDs 39454548, 39614285, 40031426, 41038207, 42240993