
Nephrotic syndrome in pediatrics
"nephrotic syndrome"[MeSH Terms] AND child[MeSH Terms]
nephrotic syndrome pediatric minimal change disease histology
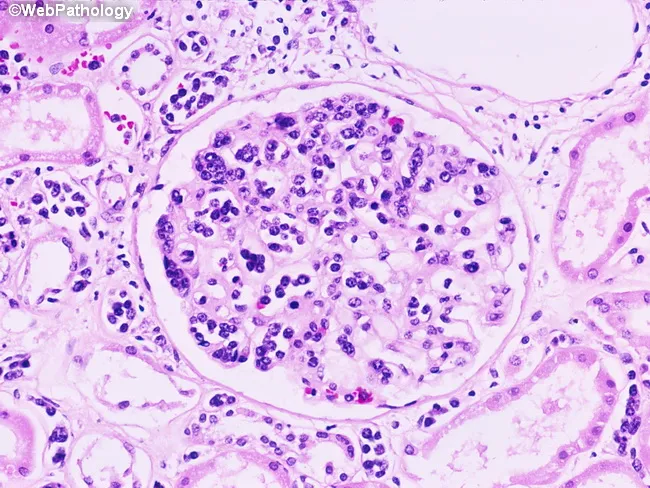
Imaging modality: Histopathology, brightfield light microscopy of hematoxylin and eosin–stained renal tissue from a kidney biopsy. The primary subject is intravascular large B-cell lymphoma (IVLBCL) involving the kidney, with conspicuous localization of neoplastic lymphocytes within glomerular capillaries. The glomerulus shows densely packed, round to irregular lymphoid cells occupying intravascular lumina, often compressing capillary loops. The surrounding glomerular tuft is variably preserved; endothelial cells may be reactive, without overt basement membrane destruction. Nuclear morphology is pleomorphic with prominent nucleoli and scant cytoplasm; mitotic figures may be present. Extracapillary invasion is limited in this field. This intravascular pattern argues for IVLBCL over typical glomerulonephritis and may be associated with minimal change disease clinically. Immunohistochemical confirmation (not shown) would demonstrate CD20 positivity and B-cell markers, with relative absence of T-cell markers, supporting a B-cell neoplasm. Diagnostic significance rests on recognizing renal involvement as part of systemic IVLBCL; confirms disease and informs staging and chemoimmunotherapy (R-CHOP). Clinical correlation includes possible renal dysfunction, nephrotic syndrome, or minimal change disease, with cutaneous, CNS, pulmonary, hepatic, and adrenal involvement reported in IVLBCL. Potential use cases include differential diagnosis of nephrotic-range proteinuria with atypical histology and guiding targeted therapy. This image exemplifies diagnostic pathology guiding timely therapy decisively.
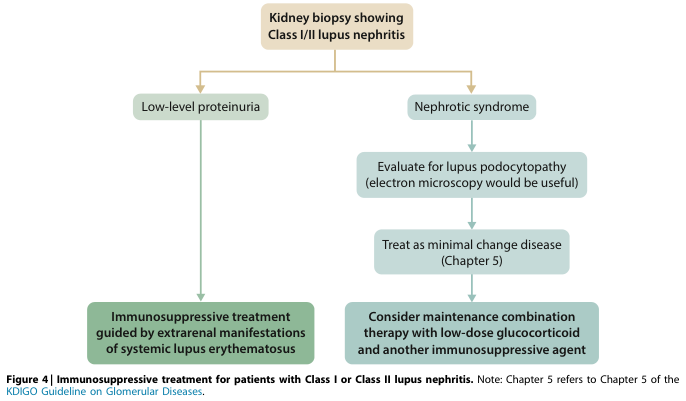
Summary : This flowchart outlines the recommended immunosuppressive treatment strategies for patients with Class I or Class II lupus nephritis, based on kidney biopsy findings and clinical presentation (low-level proteinuria vs. nephrotic syndrome). flowchart: # Nodes : • Kidney biopsy showing Class I/II lupus nephritis (rounded rectangle, top node) • Low-level proteinuria (rounded rectangle, left branch) • Nephrotic syndrome (rounded rectangle, right branch) • Immunosuppressive treatment guided by extrarenal manifestations of systemic lupus erythematosus (rounded rectangle, leftmost bottom node) • Evaluate for lupus podocytopathy (electron microscopy would be useful) (rounded rectangle, right branch, intermediate node) • Treat as minimal change disease (Chapter 5) (rounded rectangle, right branch, intermediate node) • Consider maintenance combination therapy with low-dose glucocorticoid and another immunosuppressive agent (rounded rectangle, rightmost bottom node, bolded text) # Connectors : • Downward arrows from the top node to "Low-level proteinuria" and "Nephrotic syndrome" (branching into two paths). • "Low-level proteinuria" leads directly down to "Immunosuppressive treatment guided by extrarenal manifestations of systemic lupus erythematosus". • "Nephrotic syndrome" leads down to "Evaluate for lupus podocytopathy (electron microscopy would be useful)". • "Evaluate for lupus podocytopathy" leads down to "Treat as minimal change disease (Chapter 5)". • "Treat as minimal change disease" leads down to "Consider maintenance combination therapy with low-dose glucocorticoid and another immunosuppressive agent". # Layout : • Vertical flow, starting from a single top node, splitting into two parallel branches (left: low-level proteinuria, right: nephrotic syndrome). • Left branch is a single-step path; right branch is a multi-step path with three nodes. • All nodes are rounded rectangles; the final rightmost node uses bold text for emphasis. # Analysis : • The flowchart distinguishes treatment approaches based on proteinuria severity in lupus nephritis. • Patients with low-level proteinuria receive immunosuppression based on extrarenal lupus activity. • Patients with nephrotic syndrome are evaluated for lupus podocytopathy and treated as minimal change disease, with consideration for maintenance combination therapy (low-dose glucocorticoid plus another immunosuppressive agent). • The right branch is more complex, reflecting additional diagnostic and therapeutic steps for nephrotic syndrome. • The chart references Chapter 5 of the KDIGO Guideline for further details on minimal change disease management.
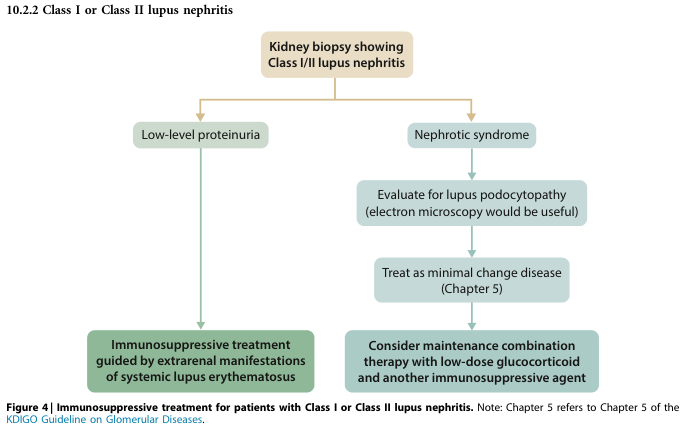
Summary : This flowchart outlines the immunosuppressive treatment approach for patients with Class I or Class II lupus nephritis, based on kidney biopsy findings and clinical presentation (low-level proteinuria vs. nephrotic syndrome). flowchart: # Nodes : • Kidney biopsy showing Class I/II lupus nephritis (rounded rectangle, top/starting node) • Low-level proteinuria (rounded rectangle, left branch) • Immunosuppressive treatment guided by extrarenal manifestations of systemic lupus erythematosus (rounded rectangle, leftmost terminal node) • Nephrotic syndrome (rounded rectangle, right branch) • Evaluate for lupus podocytopathy (electron microscopy would be useful) (rounded rectangle, right branch, intermediate node) • Treat as minimal change disease (Chapter 5) (rounded rectangle, right branch, intermediate node) • Consider maintenance combination therapy with low-dose glucocorticoid and another immunosuppressive agent (rounded rectangle, rightmost terminal node) # Connectors : • The starting node splits into two branches: one to "Low-level proteinuria" (left), one to "Nephrotic syndrome" (right). • "Low-level proteinuria" leads directly to "Immunosuppressive treatment guided by extrarenal manifestations of systemic lupus erythematosus". • "Nephrotic syndrome" leads to "Evaluate for lupus podocytopathy (electron microscopy would be useful)". • "Evaluate for lupus podocytopathy" leads to "Treat as minimal change disease (Chapter 5)". • "Treat as minimal change disease" leads to "Consider maintenance combination therapy with low-dose glucocorticoid and another immunosuppressive agent". # Layout : • Top-down hierarchical structure. • Two main branches (left: low-level proteinuria, right: nephrotic syndrome). • Right branch has additional sequential steps before reaching the terminal node. • All nodes are rounded rectangles; connectors are straight arrows. # Analysis : • The flowchart distinguishes treatment pathways based on the presence of low-level proteinuria versus nephrotic syndrome in patients with Class I/II lupus nephritis. • For low-level proteinuria, treatment is guided by extrarenal lupus manifestations. • For nephrotic syndrome, further evaluation for lupus podocytopathy is recommended, with subsequent treatment as minimal change disease and consideration of maintenance combination therapy. • The right branch is more complex, indicating a need for additional diagnostic steps and combination therapy.
Summary : This flowchart outlines the immunosuppressive treatment approach for patients with Class I or Class II lupus nephritis (LN) based on kidney biopsy findings, differentiating management according to the presence of low-level proteinuria or nephrotic syndrome. flowchart: # Nodes : • Kidney biopsy showing Class I/II lupus nephritis (rounded rectangle, top/starting node) • Low-level proteinuria (rectangle, left branch) • Nephrotic syndrome (rectangle, right branch) • Immunosuppressive treatment guided by extrarenal manifestations of systemic lupus erythematosus (rectangle, leftmost terminal node) • Evaluate for lupus podocytopathy (electron microscopy would be useful) (rectangle, right branch, intermediate node) • Treat as minimal change disease (Chapter 5) (rectangle, right branch, intermediate node) • Consider maintenance combination therapy with low-dose glucocorticoid and another immunosuppressive agent (rectangle, rightmost terminal node) # Connectors : • Downward arrows from the starting node to two branches: "Low-level proteinuria" and "Nephrotic syndrome". • From "Low-level proteinuria" → arrow to "Immunosuppressive treatment guided by extrarenal manifestations of systemic lupus erythematosus". • From "Nephrotic syndrome" → arrow to "Evaluate for lupus podocytopathy (electron microscopy would be useful)". • From "Evaluate for lupus podocytopathy" → arrow to "Treat as minimal change disease (Chapter 5)". • From "Treat as minimal change disease" → arrow to "Consider maintenance combination therapy with low-dose glucocorticoid and another immunosuppressive agent". # Layout : • Top-down hierarchical structure. • Initial node at the top, splitting into two parallel branches (left: low-level proteinuria; right: nephrotic syndrome). • Left branch is a single-step pathway; right branch is a multi-step pathway with three sequential nodes. • Terminal nodes at the bottom of each branch. # Analysis : • The flowchart distinguishes treatment based on proteinuria severity: low-level proteinuria leads to immunosuppression guided by extrarenal lupus activity, while nephrotic syndrome prompts evaluation for lupus podocytopathy, treatment as minimal change disease, and consideration of maintenance combination therapy. • The right branch (nephrotic syndrome) involves more diagnostic and therapeutic steps, reflecting greater disease severity. • The chart emphasizes the importance of extrarenal manifestations in guiding therapy for milder renal involvement.
minimal change disease electron microscopy foot process effacement nephrotic
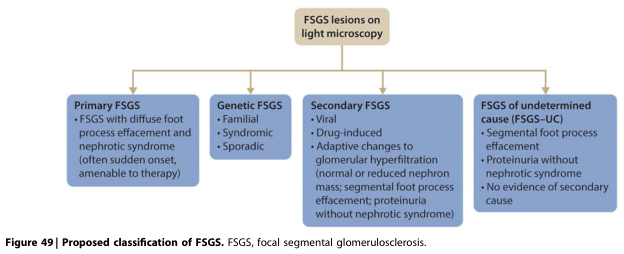
Summary : This figure presents a proposed classification scheme for focal segmental glomerulosclerosis (FSGS) based on the nature and cause of lesions observed on light microscopy. It divides FSGS into four main categories: primary, genetic, secondary, and undetermined cause, with defining features for each. flowchart: # Nodes : • FSGS lesions on light microscopy (rectangle, top central node) • Primary FSGS (rectangle) – FSGS with diffuse foot process effacement and nephrotic syndrome (often sudden onset, amenable to therapy) • Genetic FSGS (rectangle) – Familial – Syndromic – Sporadic • Secondary FSGS (rectangle) – Viral – Drug-induced – Adaptive changes to glomerular hyperfiltration (normal or reduced nephron mass; segmental foot process effacement; proteinuria without nephrotic syndrome) • FSGS of undetermined cause (FSGS-UC) (rectangle) – Segmental foot process effacement – Proteinuria without nephrotic syndrome – No evidence of secondary cause # Connectors : • Single downward arrows from "FSGS lesions on light microscopy" to each of the four category nodes (Primary FSGS, Genetic FSGS, Secondary FSGS, FSGS-UC). • No further branching or merging. # Layout : • Hierarchical, top-down arrangement. • Central top node ("FSGS lesions on light microscopy") branches downward to four horizontally aligned category nodes. # Analysis : • The classification distinguishes FSGS types by etiology and clinical features, separating primary (diffuse effacement, nephrotic syndrome), genetic (familial/syndromic/sporadic), secondary (viral, drug, adaptive hyperfiltration), and undetermined cause (segmental effacement, proteinuria without nephrotic syndrome, no secondary cause). • The scheme emphasizes both pathological findings (foot process effacement) and clinical presentation (nephrotic syndrome, proteinuria), aiding differential diagnosis and guiding therapy.
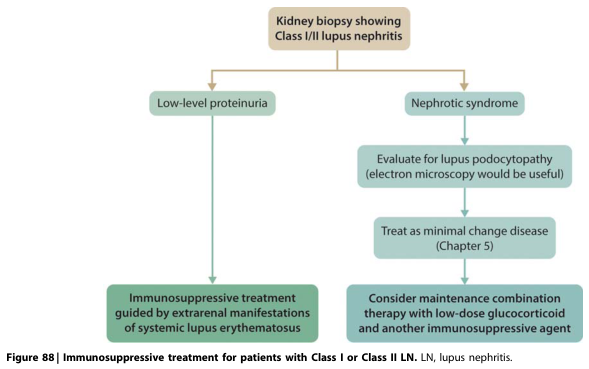
Summary : This flowchart outlines the immunosuppressive treatment approach for patients with Class I or Class II lupus nephritis (LN) based on kidney biopsy findings, differentiating management according to the presence of low-level proteinuria or nephrotic syndrome. flowchart: # Nodes : • Kidney biopsy showing Class I/II lupus nephritis (rounded rectangle, top/starting node) • Low-level proteinuria (rectangle, left branch) • Nephrotic syndrome (rectangle, right branch) • Immunosuppressive treatment guided by extrarenal manifestations of systemic lupus erythematosus (rectangle, leftmost terminal node) • Evaluate for lupus podocytopathy (electron microscopy would be useful) (rectangle, right branch, intermediate node) • Treat as minimal change disease (Chapter 5) (rectangle, right branch, intermediate node) • Consider maintenance combination therapy with low-dose glucocorticoid and another immunosuppressive agent (rectangle, rightmost terminal node) # Connectors : • Downward arrows from the starting node to two branches: "Low-level proteinuria" and "Nephrotic syndrome". • From "Low-level proteinuria" → arrow to "Immunosuppressive treatment guided by extrarenal manifestations of systemic lupus erythematosus". • From "Nephrotic syndrome" → arrow to "Evaluate for lupus podocytopathy (electron microscopy would be useful)". • From "Evaluate for lupus podocytopathy" → arrow to "Treat as minimal change disease (Chapter 5)". • From "Treat as minimal change disease" → arrow to "Consider maintenance combination therapy with low-dose glucocorticoid and another immunosuppressive agent". # Layout : • Top-down hierarchical structure. • Initial node at the top, splitting into two parallel branches (left: low-level proteinuria; right: nephrotic syndrome). • Left branch is a single-step pathway; right branch is a multi-step pathway with three sequential nodes. • Terminal nodes at the bottom of each branch. # Analysis : • The flowchart distinguishes treatment based on proteinuria severity: low-level proteinuria leads to immunosuppression guided by extrarenal lupus activity, while nephrotic syndrome prompts evaluation for lupus podocytopathy, treatment as minimal change disease, and consideration of maintenance combination therapy. • The right branch (nephrotic syndrome) involves more diagnostic and therapeutic steps, reflecting greater disease severity. • The chart emphasizes the importance of extrarenal manifestations in guiding therapy for milder renal involvement.
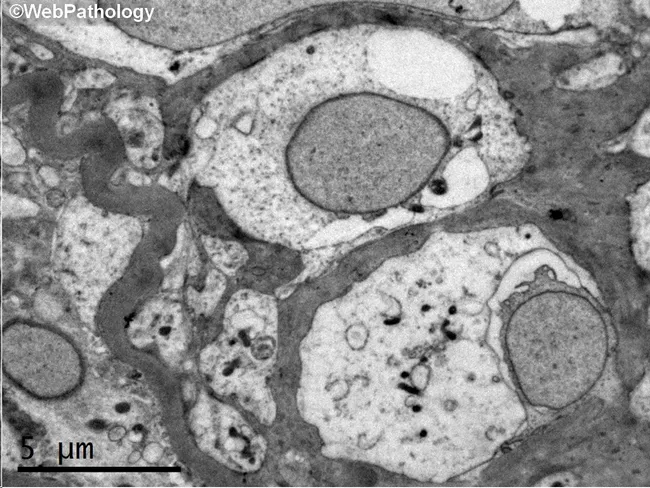
This Transmission Electron Microscopy (TEM) image of a renal glomerulus demonstrates diffuse thickening of the glomerular basement membrane (GBM), an ultrastructural hallmark of diabetic nephropathy. The sample is a renal biopsy from a patient with type 1 diabetes mellitus, illustrating early intraglomerular microangiopathy within approximately two years of disease onset. In TEM, the GBM appears markedly thickened, with increased electron density and reduced capillary luminal space; podocyte foot processes may show effacement, though not clearly identifiable in this static field. The specimen is oriented in the glomerular capillary loops within the renal cortex; scale bar indicates 5 μm, reflecting ultrastructural resolution. Clinically, GBM thickening correlates with progression to overt proteinuria and chronic kidney disease; however, nodular sclerosis (Kimmelstiel-Wilson lesions) and overt glomerulosclerosis develop later. This image underscores the value of electron microscopy for early detection of diabetic microangiopathy when light microscopy may be less sensitive. Diagnostic significance lies in confirming diabetic nephropathy in the appropriate clinical context, differentiating from other glomerulopathies where GBM thickening may occur, such as membranous nephropathy or hypertensive nephrosclerosis. Potential uses include educational illustration of early diabetic kidney disease, research into ultrastructural changes in diabetes, and aiding pathology concordance with clinical diabetes management and nephrology planning.
nephrotic syndrome edema proteinuria pathophysiology diagram children
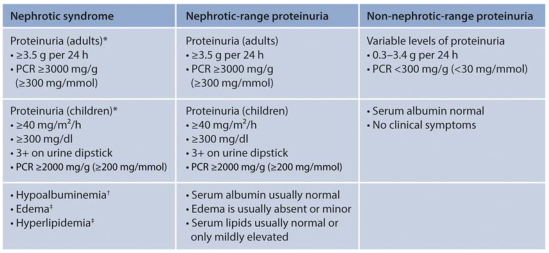
<table><thead><tr><th>Nephrotic syndrome</th><th>Nephrotic-range proteinuria</th><th>Non-nephrotic-range proteinuria</th></tr></thead><tbody><tr><td>Proteinuria (adults)*<br>• ≥3.5 g per 24 h<br>• PCR ≥3000 mg/g<br>(≥300 mg/mmol)</td><td>Proteinuria (adults)<br>• ≥3.5 g per 24 h<br>• PCR ≥3000 mg/g<br>(≥300 mg/mmol)</td><td>Variable levels of proteinuria<br>• 0.3–3.4 g per 24 h<br>• PCR <300 mg/g (<30 mg/mmol)</td></tr><tr><td>Proteinuria (children)*<br>• ≥40 mg/m²/h<br>• ≥300 mg/dl<br>• 3+ on urine dipstick<br>• PCR ≥2000 mg/g (≥200 mg/mmol)</td><td>Proteinuria (children)<br>• ≥40 mg/m²/h<br>• ≥300 mg/dl<br>• 3+ on urine dipstick<br>• PCR ≥2000 mg/g (≥200 mg/mmol)</td><td>• Serum albumin normal<br>• No clinical symptoms</td></tr><tr><td>• Hypoalbuminemia†<br>• Edema†<br>• Hyperlipidemia‡</td><td>• Serum albumin usually normal<br>• Edema is usually absent or minor<br>• Serum lipids usually normal or<br> only mildly elevated</td><td></td></tr></tbody></table>
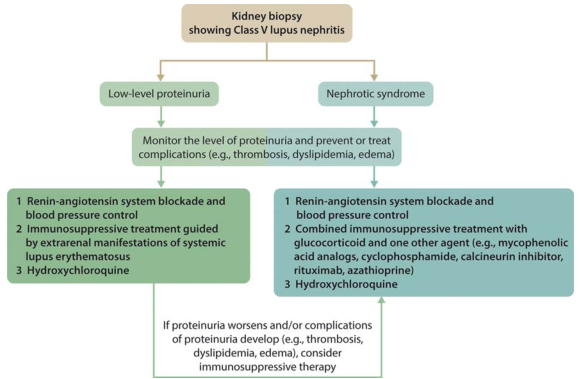
Summary : This flowchart outlines the management of Class V lupus nephritis based on kidney biopsy findings, stratified by the level of proteinuria (low-level vs. nephrotic syndrome), and details recommended treatments and monitoring steps. flowchart: # Nodes : • Start (rectangle): "Kidney biopsy showing Class V lupus nephritis" • Decision (split into two rectangles): "Low-level proteinuria" and "Nephrotic syndrome" • Process (rectangle, shared): "Monitor the level of proteinuria and prevent or treat complications (e.g., thrombosis, dyslipidemia, edema)" • Treatment (rectangle, left branch for low-level proteinuria): 1. "Renin-angiotensin system blockade and blood pressure control" 2. "Immunosuppressive treatment guided by extrarenal manifestations of systemic lupus erythematosus" 3. "Hydroxychloroquine" • Treatment (rectangle, right branch for nephrotic syndrome): 1. "Renin-angiotensin system blockade and blood pressure control" 2. "Combined immunosuppressive treatment with glucocorticoid and one other agent (e.g., mycophenolic acid analogs, cyclophosphamide, calcineurin inhibitor, rituximab, azathioprine)" 3. "Hydroxychloroquine" • Conditional (rectangle, bottom): "If proteinuria worsens and/or complications of proteinuria develop (e.g., thrombosis, dyslipidemia, edema), consider immunosuppressive therapy" # Connectors : • Downward arrows from "Kidney biopsy showing Class V lupus nephritis" to both "Low-level proteinuria" and "Nephrotic syndrome" • Downward arrows from both "Low-level proteinuria" and "Nephrotic syndrome" to the shared monitoring node • Downward arrows from the monitoring node to each respective treatment node (left and right) • Downward arrows from both treatment nodes to the conditional node at the bottom # Layout : • Top-down hierarchical structure • Initial node at the top, branching into two parallel pathways (left: low-level proteinuria, right: nephrotic syndrome) • Both pathways converge at the bottom conditional node • All nodes are rectangles; no diamonds or ellipses # Analysis : • The flowchart provides a clear decision-making pathway for managing Class V lupus nephritis based on proteinuria severity. • Both pathways include renin-angiotensin system blockade, blood pressure control, and hydroxychloroquine. • Immunosuppressive therapy is tailored: guided by extrarenal manifestations for low-level proteinuria, and combined with glucocorticoid plus another agent for nephrotic syndrome. • Monitoring for complications is emphasized, with escalation to immunosuppressive therapy if proteinuria worsens or complications arise. • The structure supports individualized treatment escalation based on clinical progression.
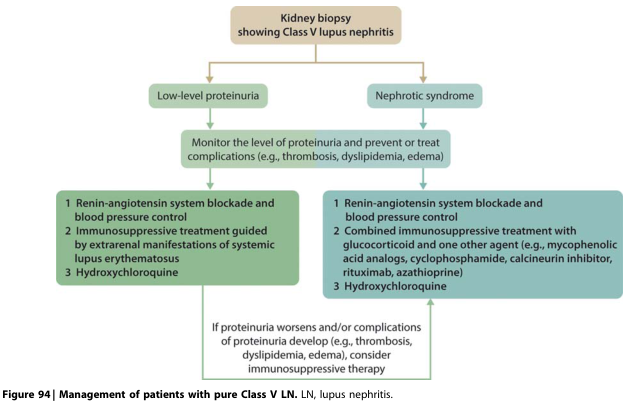
Summary : This flowchart outlines the management of patients with pure Class V lupus nephritis (LN) based on kidney biopsy findings, stratified by the level of proteinuria (low-level vs. nephrotic syndrome), and details the recommended monitoring and treatment steps for each scenario. flowchart: # Nodes : • Start node: "Kidney biopsy showing Class V lupus nephritis" (rectangle, top center) • Decision node: splits into "Low-level proteinuria" (left) and "Nephrotic syndrome" (right) (rounded rectangles) • Common process node: "Monitor the level of proteinuria and prevent or treat complications (e.g., thrombosis, dyslipidemia, edema)" (rectangle, center) • Left treatment node (for low-level proteinuria): 1. "Renin-angiotensin system blockade and blood pressure control" 2. "Immunosuppressive treatment guided by extrarenal manifestations of systemic lupus erythematosus" 3. "Hydroxychloroquine" • Right treatment node (for nephrotic syndrome): 1. "Renin-angiotensin system blockade and blood pressure control" 2. "Combined immunosuppressive treatment with glucocorticoid and one other agent (e.g., mycophenolic acid analogs, cyclophosphamide, calcineurin inhibitor, rituximab, azathioprine)" 3. "Hydroxychloroquine" • Bottom process node: "If proteinuria worsens and/or complications of proteinuria develop (e.g., thrombosis, dyslipidemia, edema), consider immunosuppressive therapy" (rectangle, bottom center) # Connectors : • Downward arrow from "Kidney biopsy showing Class V lupus nephritis" to both "Low-level proteinuria" and "Nephrotic syndrome" • Both "Low-level proteinuria" and "Nephrotic syndrome" connect downward to the shared node: "Monitor the level of proteinuria and prevent or treat complications..." • From the shared monitoring node, left arrow to the left treatment node (low-level proteinuria), right arrow to the right treatment node (nephrotic syndrome) • Both treatment nodes have downward arrows merging into the bottom process node about worsening proteinuria/complications # Layout : • Vertical, top-down flow with a split into two parallel branches (left: low-level proteinuria, right: nephrotic syndrome), then reconverging at the bottom for escalation of therapy if needed. • All nodes are rectangular or rounded rectangles; no diamonds or ellipses. # Analysis : • The flowchart provides a clear, stepwise approach to managing Class V lupus nephritis, emphasizing initial stratification by proteinuria level. • Both pathways include renin-angiotensin system blockade, blood pressure control, and hydroxychloroquine, but differ in the intensity and type of immunosuppressive therapy. • The chart highlights the importance of monitoring for complications and escalating immunosuppression if proteinuria worsens or complications arise. • The structure supports individualized treatment based on disease severity and response.
Nephrotic Syndrome in Pediatrics
Definition and Diagnostic Criteria
| Parameter | Threshold |
|---|---|
| Proteinuria | ≥ 40 mg/m²/hour, or urine protein:creatinine ratio ≥ 2.0 mg/mg, or 3+/4+ on dipstick |
| Hypoalbuminemia | < 3 g/dL (< 30 g/L) |
| Edema | Clinically apparent |
| Hyperlipidemia | Elevated total cholesterol and triglycerides |
Classification
1. By Age of Onset
- Perinatal infections: rubella, toxoplasmosis, syphilis, CMV
- Inherited genetic disorders (Finnish-type - NPHS1/nephrin mutations; Denys-Drash syndrome - WT1 gene; Finnish type shows large placenta, dilated proximal tubules)
- Immunosuppressives are ineffective; management is conservative (sodium/fluid restriction, albumin + loop diuretics, hypercaloric diet, thyroid replacement)
2. By Etiology
| Category | Details |
|---|---|
| Primary (idiopathic) | No identifiable underlying cause; ~90% of childhood cases |
| Secondary | ~10% - infections (hepatitis B/C, HIV, malaria), SLE, Henoch-Schönlein purpura, malignancy, drugs (NSAIDs, mercury, gold) |
| Genetic/inherited | Mutations in >30 genes (NPHS1, NPHS2/podocin, ACTN4, TRPC6, WT1) |
3. By Histology (Primary NS)
| Type | Frequency in Children | Key Features |
|---|---|---|
| Minimal Change Disease (MCD) | 90% of cases < 10 yr; 70-80% of all pediatric NS | Normal LM; effacement of foot processes on EM; steroid-sensitive |
| Focal Segmental Glomerulosclerosis (FSGS) | Most common in steroid-resistant NS | Segmental sclerosis on LM; higher in African-Americans, Hispanics; < 25% steroid-responsive |
| Membranous Nephropathy (MN) | Rare in childhood | Subepithelial immune deposits; often secondary; anti-PLA2R antibodies in primary MN |
| Mesangial Proliferation (MES) | Minority | Mesangial hypercellularity |
| Membranoproliferative GN (MPGN) | Less common | Often secondary (infections, complement disorders) |
- Campbell Walsh Wein Urology, p. 459; Quick Compendium of Clinical Pathology
Pathophysiology
Underfill vs. Overfill Edema
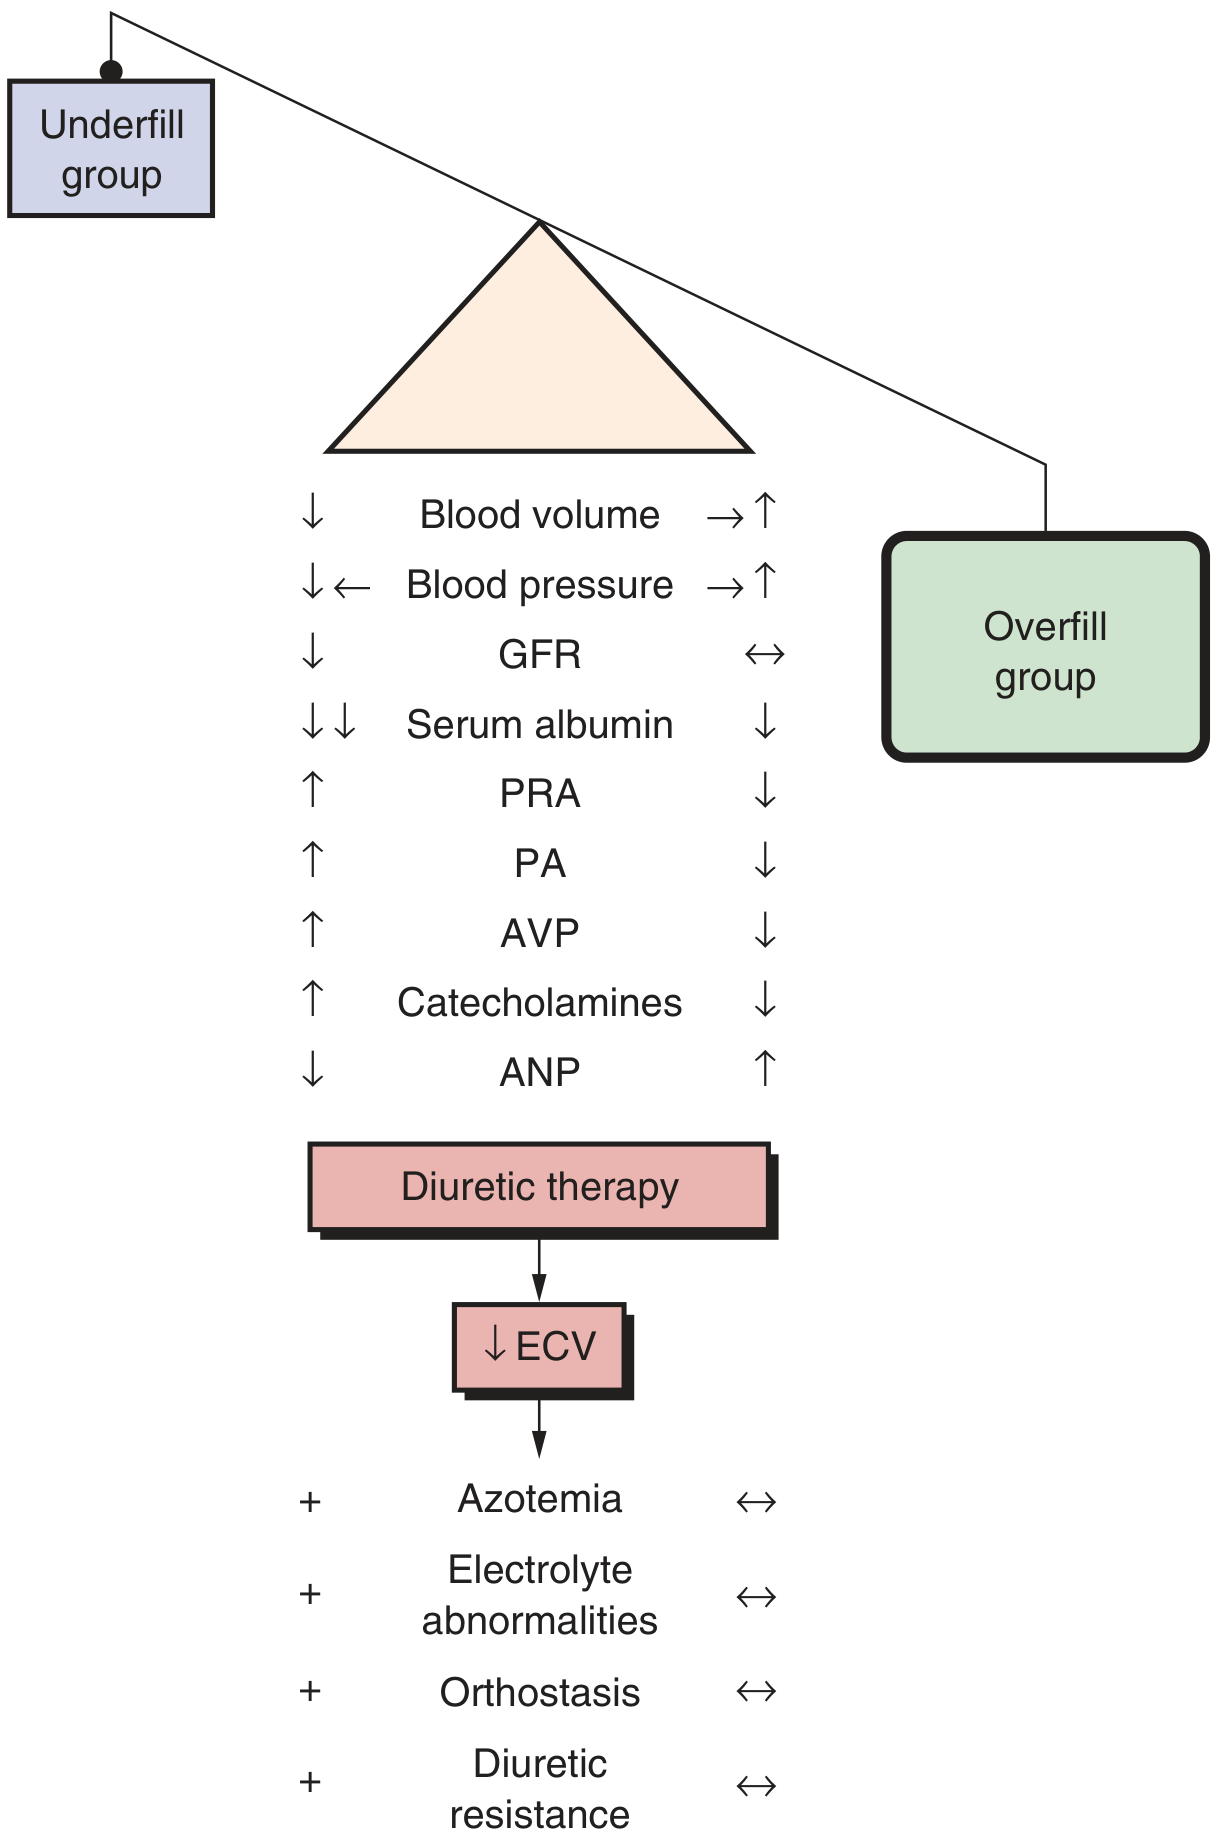
- Underfill (MCD): Hypoalbuminemia → reduced plasma oncotic pressure → fluid shifts to interstitium → contracted plasma volume → activated RAAS, elevated PRA, aldosterone, AVP, and catecholamines
- Overfill (other causes): Primary renal sodium retention → expanded plasma volume → suppressed RAAS, elevated ANP
Clinical Features
- Edema: The cardinal sign; begins as periorbital edema (especially in the morning), progresses to dependent edema, scrotal/labial swelling, ascites, pleural effusions, and anasarca. Some children present with weight gain before edema is recognized
- Triggers: Often preceded by a viral upper respiratory tract infection
- Hypertension: Not typical of MCD; suggests FSGS or secondary NS
- Hematuria: Microscopic in ~20% of MCD patients; macroscopic is unusual
- Oliguria/AKI: Rare but can occur
- Age < 1 year
- Macroscopic hematuria
- Persistent hypertension
- Hypocomplementemia
- Extrarenal symptoms (rash, arthritis)
Complications
Infections (Leading cause of morbidity and mortality)
- Loss of immunoglobulins (IgG) in urine + corticosteroid use = immune compromise
- Spontaneous bacterial peritonitis (SBP) - Streptococcus pneumoniae most common
- Sepsis, pneumonia - also E. coli and encapsulated organisms (H. influenzae)
- Pneumococcal vaccine recommended
Thromboembolism
- Loss of antithrombin III, proteins C and S + hypercoagulable state from increased procoagulant factors
- Sites: renal vein, sagittal sinus, pulmonary artery, deep veins
- Consider anticoagulation in high-risk patients
Dyslipidemia
- Hypercholesterolemia, hypertriglyceridemia
- Increased cardiovascular risk in relapsing/chronic disease
Acute Kidney Injury
- Rare but possible; especially in volume-depletion state with overzealous diuresis
Steroid Response Classification
| Category | Definition |
|---|---|
| Steroid-Sensitive NS (SSNS) | Remission (protein-free urine) within 8 weeks of full-dose prednisone |
| Frequently-Relapsing NS (FRNS) | ≥ 2 relapses within 6 months of initial response, OR ≥ 4 relapses within any 12-month period |
| Steroid-Dependent NS (SDNS) | Two consecutive relapses during steroid taper, or inability to maintain remission without continuous steroids |
| Steroid-Resistant NS (SRNS) | Failure to achieve remission after 6-8 weeks of full-dose prednisone (15-20% of idiopathic NS) |
- Campbell Walsh Wein Urology, p. 459
Management
Initial Treatment (First Presentation)
- No biopsy needed if presentation is typical (age 1-10 yr, no atypical features)
- Prednisone: 60 mg/m²/day (or 2 mg/kg/day, max 60 mg) once daily for 4-6 weeks, then alternate-day dosing tapered over 6+ weeks
- Up to 90% of MCNS achieves remission with initial steroids
- Dietary sodium restriction for edema; diuretics if needed
Relapsing Disease (FRNS / SDNS) - Steroid-Sparing Agents
| Agent | Mechanism |
|---|---|
| Cyclophosphamide (oral) | Alkylating agent; induces prolonged remission in FRNS |
| Mycophenolate Mofetil (MMF) | Inhibits purine synthesis in lymphocytes |
| Calcineurin Inhibitors (CNIs) - cyclosporine, tacrolimus | Suppress T-cell activation; effective but high relapse rate on discontinuation |
| Rituximab | B-cell depletion (anti-CD20); effective in SDNS, including steroid-dependent refractory cases |
Steroid-Resistant NS (SRNS)
- Biopsy first (FSGS found in majority)
- Options: IV pulse steroids, high-dose corticosteroids + alkylating agents, CNIs (cyclosporine/tacrolimus)
- Patients refractory to steroids + CNIs rarely respond to other therapies
- FSGS can recur post-transplant; plasmapheresis + rituximab + CNIs used in some
Congenital NS
- Immunosuppressives not effective
- Conservative: sodium/fluid restriction, IV albumin + loop diuretics, hyercaloric diet, thyroid hormone replacement, thrombosis prophylaxis, aggressive infection management
Genetics of Inherited Nephrotic Syndrome
| Gene | Protein | Syndrome | Features |
|---|---|---|---|
| NPHS1 | Nephrin | Congenital Finnish-type NS | Autosomal recessive; severe proteinuria in utero; dilated proximal tubules on biopsy |
| NPHS2 | Podocin | Autosomal recessive SRNS | Early childhood onset; biopsy resembles MCD then transforms to FSGS |
| WT1 | Wilms tumor suppressor | Denys-Drash / Frasier syndrome | Wilms tumor + male pseudohermaphroditism; mesangial sclerosis; gonadoblastoma in Frasier |
| ACTN4 | α-actinin-4 | Autosomal dominant FSGS | Adolescent/young adult onset |
| TRPC6 | TRP cation channel 6 | Autosomal dominant FSGS | Later onset |
- Quick Compendium of Clinical Pathology
Investigations
- Urine dipstick, spot urine protein:creatinine ratio, 24-hour urine protein
- Serum albumin, total protein, cholesterol, triglycerides
- BMP (electrolytes, BUN, creatinine)
- CBC (hemoconcentration in underfill state)
- Complement levels (C3, C4) - low in MPGN, SLE, post-infectious GN
- ANA, anti-dsDNA (SLE)
- Hepatitis B & C serology, HIV
- Anti-PLA2R antibodies (primary membranous)
- Genetic testing in congenital/infantile NS
- Age < 1 year (or > 12 years, consider)
- Steroid resistance
- Atypical features (macro-hematuria, hypertension, hypocomplementemia, extrarenal signs)
- Suspected secondary cause
Disposition (Emergency Setting)
Recent Evidence
- MCD is the cause in 90% of children < 10 years - expect steroid sensitivity
- Biopsy before steroids only if atypical features are present
- Prednisone 60 mg/m²/day is the standard induction dose
- Infections (especially S. pneumoniae) and thromboembolism are the most dangerous complications
- FSGS dominates in steroid-resistant cases and carries a worse prognosis