Ecg all
Reading File
Asking for Preferences
Finding Sources
Finding Sources
Searching the Web
ECG basics interpretation comprehensive guide P wave QRS T wave
Reading File
Finding Sources
Searching Images
ECG normal waveform P wave QRS complex T wave intervals diagram
Reading File
Finding Sources
Reading File
Reading File
Reading File
Loading Image
Loading Image
Loading Image
Loading Image
Now I have comprehensive material. Let me compile the full ECG basics & interpretation guide.
ECG Basics & Interpretation — Complete Guide
Source: Harrison's Principles of Internal Medicine 22E (2025)
1. What is an ECG?
The electrocardiogram (ECG/EKG) records the electrical activity of the heart from the body surface. It is the single most important bedside cardiac test — providing information on rhythm, conduction, ischemia, hypertrophy, electrolyte disturbances, and drug effects.
2. ECG Paper & Calibration
| Feature | Value |
|---|---|
| Paper speed | 25 mm/s |
| 1 small box (1 mm) | 40 ms (0.04 s) horizontal |
| 1 large box (5 mm) | 200 ms (0.20 s) horizontal |
| Standard voltage | 1 mV = 10 mm vertical |
Heart rate calculation:
- Count large boxes between two R waves → divide 300 by that number
- Or: divide 1500 by the number of small boxes between R waves
3. ECG Waveforms & Intervals
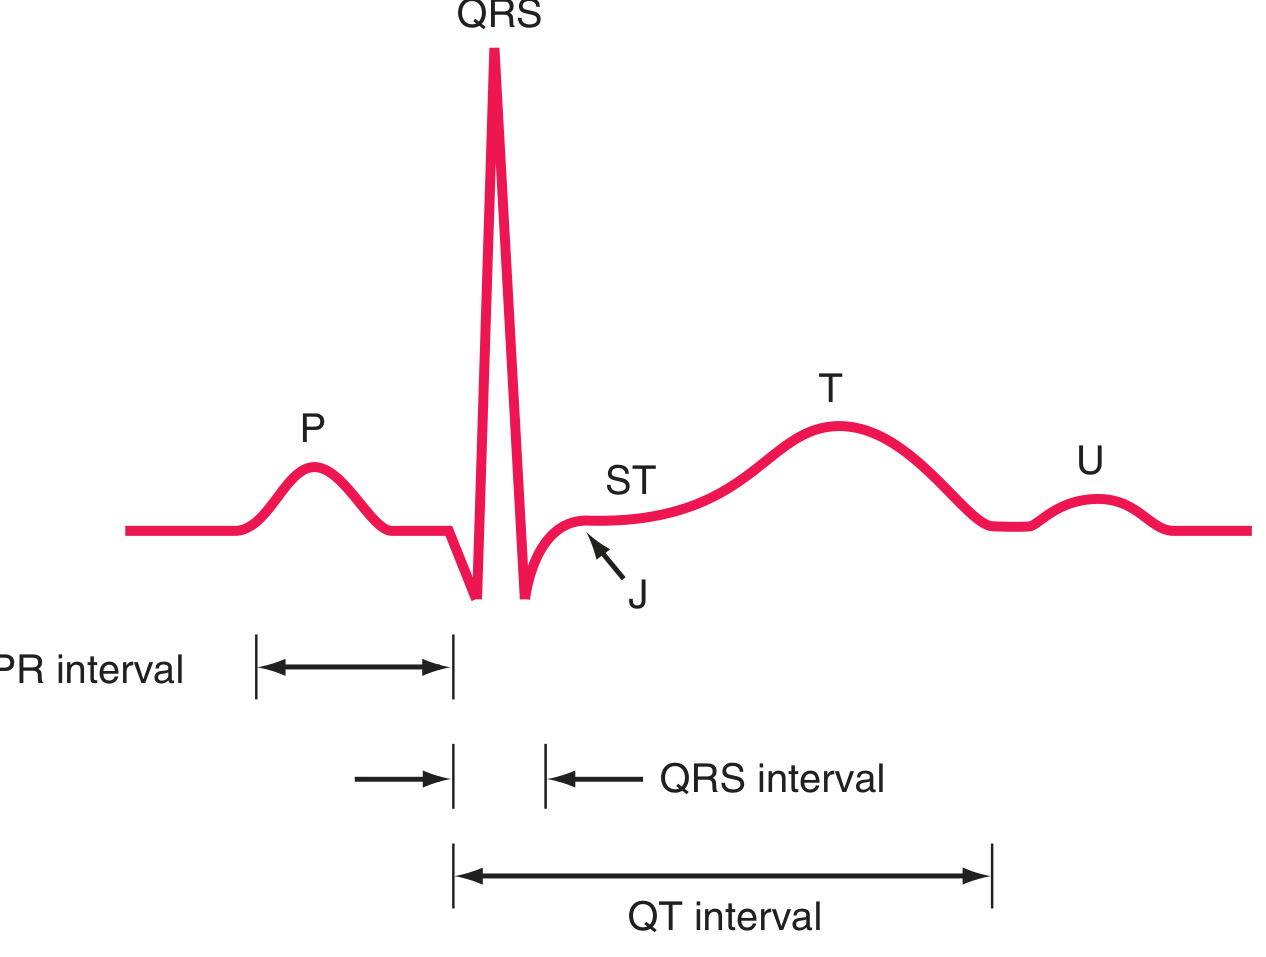
| Component | What it represents | Normal values |
|---|---|---|
| P wave | Atrial depolarization | Duration < 120 ms; amplitude < 2.5 mm |
| PR interval | Atrial depol. + AV nodal delay | 120–200 ms (3–5 small boxes) |
| QRS complex | Ventricular depolarization | ≤ 100–110 ms (≤ 2.5 small boxes) |
| ST segment | Isoelectric (plateau of action potential, phase 2) | At baseline |
| J point | Junction of QRS end and ST start | At or near baseline |
| T wave | Ventricular repolarization (phase 3) | Same direction as QRS |
| QT interval | Total ventricular depol. + repol. | ≤ 460 ms (women), ≤ 450 ms (men) |
| U wave | Purkinje/slow repolarization | Small; same direction as T wave |
Action potential correlation: QRS = rapid phase 0 upstroke; isoelectric ST = plateau (phase 2); T wave = active repolarization (phase 3).
4. The 12 ECG Leads
The standard ECG uses 12 leads — 6 limb leads + 6 precordial (chest) leads.
Limb Leads (Frontal Plane)
| Lead | Type | Views |
|---|---|---|
| I | Bipolar | Left lateral |
| II | Bipolar | Inferior (most useful rhythm strip) |
| III | Bipolar | Inferior |
| aVR | Unipolar augmented | Cavity (right shoulder) |
| aVL | Unipolar augmented | Left lateral |
| aVF | Unipolar augmented | Inferior |
Precordial Leads (Horizontal Plane)
| Lead | Position | Views |
|---|---|---|
| V1 | 4th ICS, right sternal border | Septal/RV |
| V2 | 4th ICS, left sternal border | Septal/RV |
| V3 | Between V2 and V4 | Anterior |
| V4 | 5th ICS, midclavicular | Anterior |
| V5 | 5th ICS, anterior axillary | Lateral |
| V6 | 5th ICS, midaxillary | Lateral |
Each lead is like a "camera" recording electrical events from a different angle. A positive deflection occurs when the depolarization wave moves toward the positive pole of that lead.
5. Normal 12-Lead ECG Example
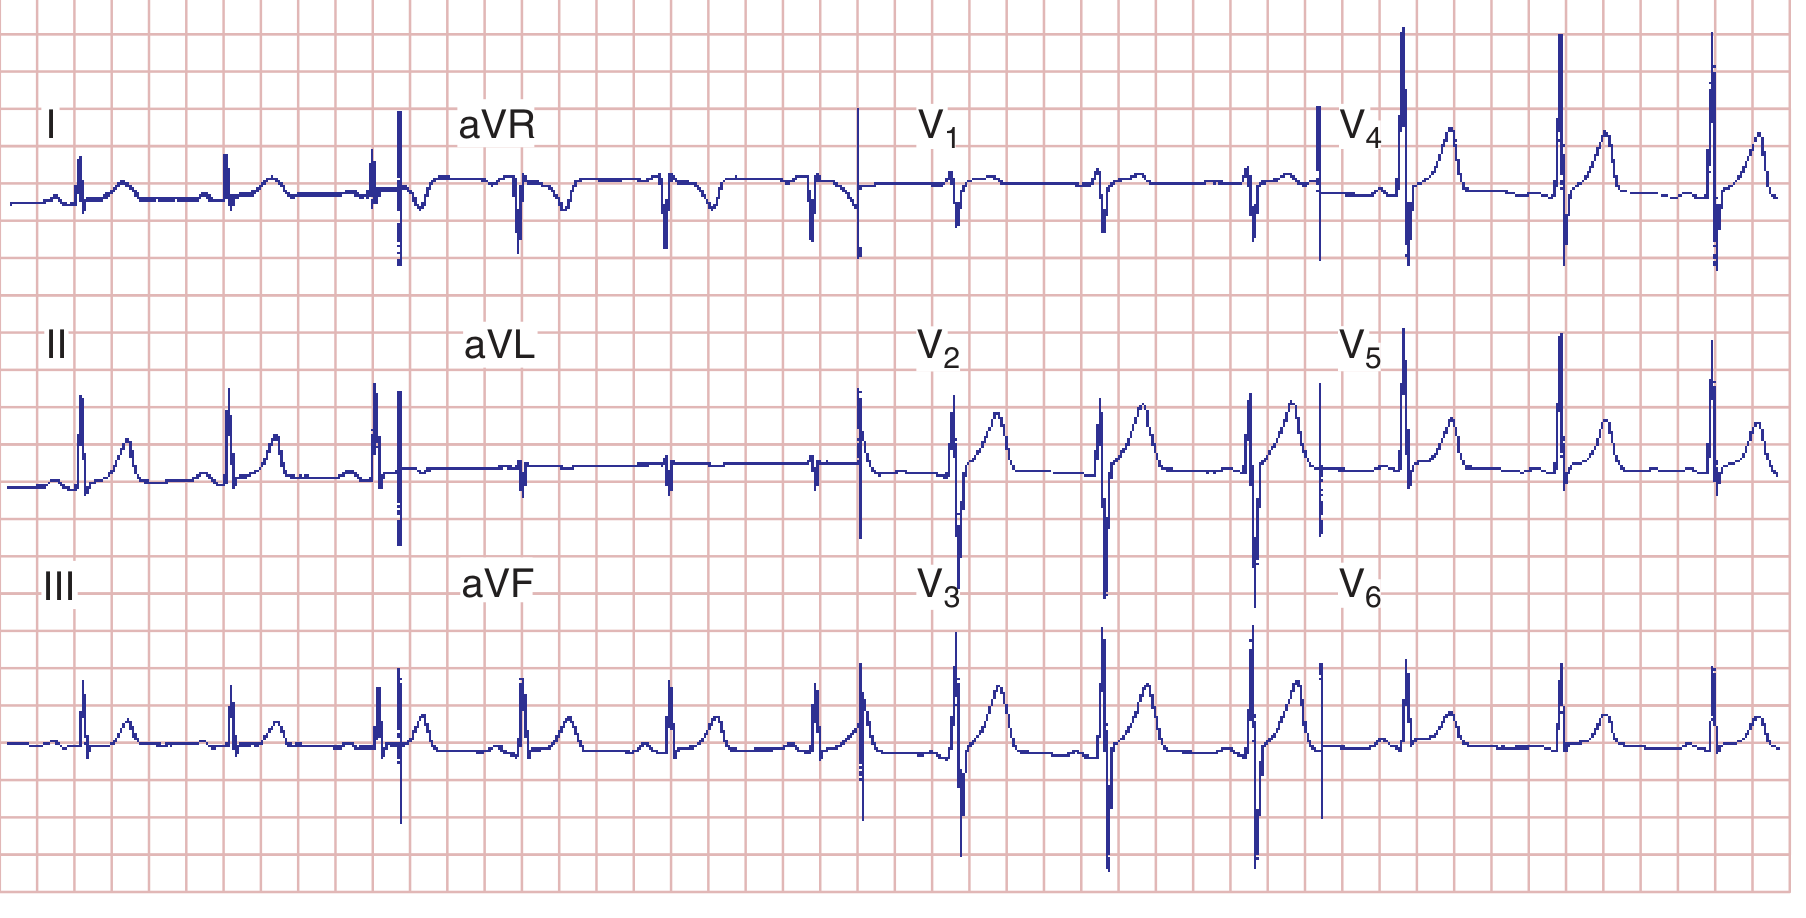
Normal ECG: HR 75 bpm, PR 160 ms, QRS 80 ms, QTc ~390 ms, mean QRS axis ~+70°
6. Genesis of Normal Waveforms
P Wave
- Originates from the sinoatrial (SA) node
- Vector directed downward and leftward → positive in lead II, negative in aVR
- In V1: may be biphasic (positive right atrial component → small negative left atrial component)
- Retrograde P waves (negative in II, positive in aVR) = ectopic atrial or junctional pacemaker
QRS Complex
- Normal ventricular depolarization: rapid spread through Purkinje system
- R-wave progression: R waves should increase from V1 → V5
- Transition zone (R = S amplitude) normally occurs at V3–V4
- Septal Q waves: small, narrow Q waves are normal in I, aVL, V5–V6 (septal depolarization left→right)
ST Segment
- Normally isoelectric (flat, at baseline)
- Elevation or depression > 1 mm = significant (see ischemia section)
T Wave
- Normally in same direction as QRS
- Asymmetrical — slower rise, faster fall
7. Mean QRS Axis
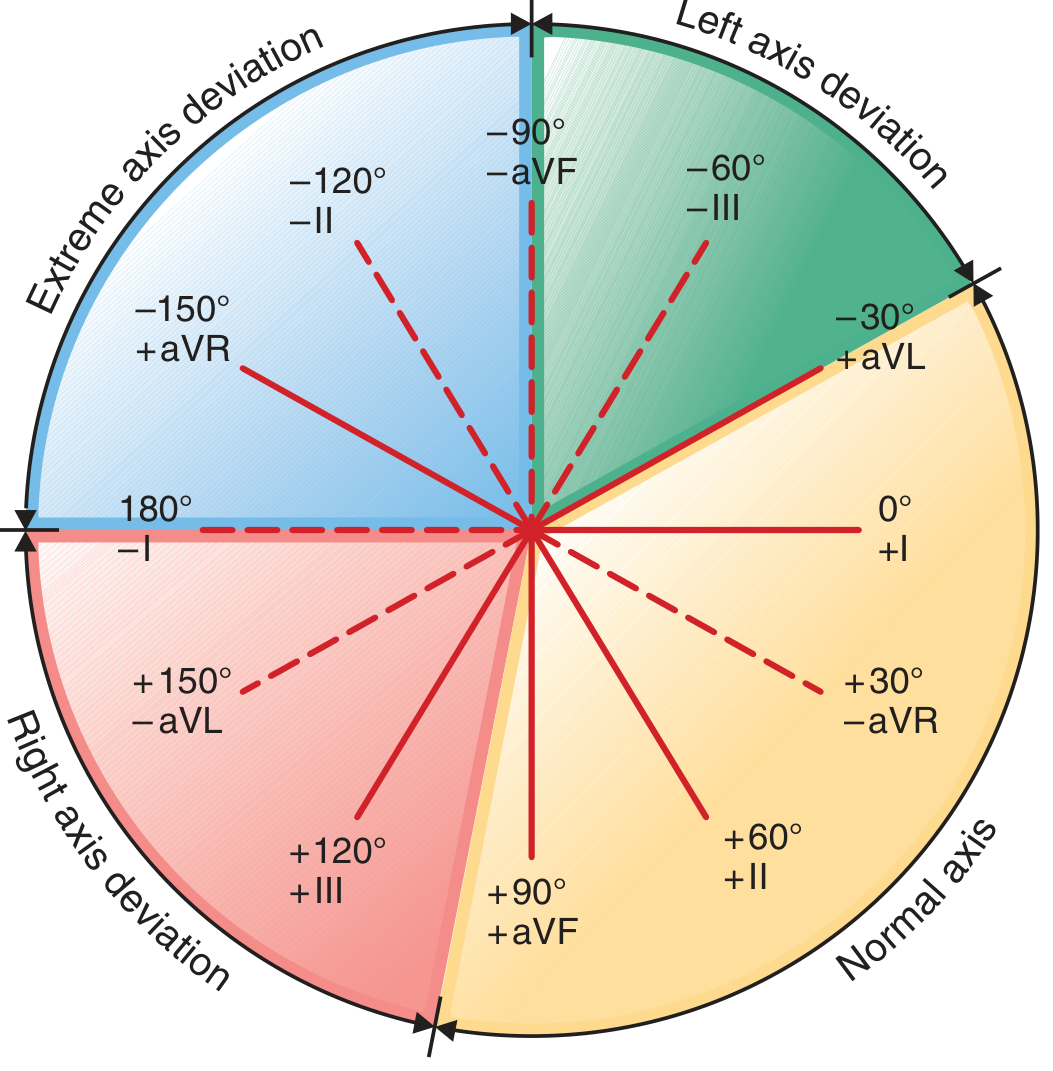
| Axis | Range |
|---|---|
| Normal | −30° to +90° |
| Left axis deviation (LAD) | −30° to −90° |
| Right axis deviation (RAD) | +90° to +180° |
| Extreme (indeterminate) | −90° to ±180° |
Quick method:
- Lead I positive + aVF positive → Normal axis
- Lead I positive + aVF negative → LAD
- Lead I negative + aVF positive → RAD
- Lead I negative + aVF negative → Extreme axis deviation
8. Systematic 14-Step Interpretation (Harrison's)
Every ECG should be analyzed systematically:
- Standardization & technical quality (calibration, lead placement, artifacts)
- Rhythm — sinus vs. non-sinus
- Heart rate
- PR interval / AV conduction
- QRS duration
- QT/QTc interval
- Mean QRS electrical axis
- P waves (morphology, size)
- QRS voltages (hypertrophy criteria)
- Precordial R-wave progression
- Abnormal Q waves
- ST segments
- T waves
- U waves
Always compare with previous ECGs when available.
9. Key Abnormalities at a Glance
Rate
| Finding | Value |
|---|---|
| Bradycardia | < 60 bpm |
| Normal | 60–100 bpm |
| Tachycardia | > 100 bpm |
Intervals
| Abnormality | Finding | Causes |
|---|---|---|
| 1st-degree AV block | PR > 200 ms | AV nodal disease, digoxin, vagal tone |
| Short PR | PR < 120 ms | WPW, LGL syndrome, junctional rhythm |
| Wide QRS | QRS > 120 ms | BBB, ventricular rhythm, WPW, hyperkalemia |
| Long QT | QTc > 450 ms (M) / 460 ms (F) | Drugs, electrolytes, congenital LQTS |
| Short QT | QTc < 340 ms | Hypercalcemia, digoxin, hereditary short QT |
P Wave Abnormalities
| Finding | Cause |
|---|---|
| Tall peaked P in II (P pulmonale, > 2.5 mm) | Right atrial enlargement |
| Broad notched P in II + biphasic in V1 (P mitrale) | Left atrial abnormality |
ST Changes
| Finding | Significance |
|---|---|
| ST elevation ≥ 1 mm (limb) / ≥ 2 mm (precordial) | STEMI, pericarditis, Brugada, early repolarization |
| ST depression | Subendocardial ischemia, reciprocal changes, digoxin |
| Diffuse saddle-shaped ST elevation | Pericarditis |
T Wave Changes
| Finding | Significance |
|---|---|
| Inverted T waves V1–V4 | Anterior ischemia, RVH, RBBB |
| Peaked symmetric T waves | Hyperkalemia, hyperacute MI |
| Wellens T waves (deep inv. V2–V3) | Critical LAD stenosis |
| Flattened/inverted diffuse | Ischemia, cardiomyopathy, metabolic |
Hypertrophy
| Finding | Criteria |
|---|---|
| LVH | S in V1 + R in V5 or V6 ≥ 35 mm (Sokolow-Lyon) |
| RVH | R > S in V1, right axis deviation, T inversion V1–V3 |
Bundle Branch Blocks
| RBBB | LBBB | |
|---|---|---|
| QRS duration | ≥ 120 ms | ≥ 120 ms |
| rSR' pattern | V1 | — |
| Broad notched R | — | V5–V6 |
| Axis | Normal or RAD | LAD |
10. QTc Correction Formulas
| Formula | Method |
|---|---|
| Bazett (classic) | QTc = QT / √RR (in seconds) — inaccurate at extremes of HR |
| Framingham (preferred) | QT = QT + 0.154 × (1000 − RR) in ms |
11. Precordial R-Wave Progression
- R wave should increase from V1 to V5
- Poor R-wave progression (PRWP): R < 3 mm in V3 → anterior MI, LVH, LBBB, incorrect lead placement
- Reverse R-wave progression: R decreasing across precordium → pathological
Summary Mnemonic: "RIPS, QATV"
A systematic approach:
- Rate & Rhythm
- Intervals (PR, QRS, QT)
- P waves
- Segments (ST)
- Q waves (pathological)
- Axis
- T waves
- Voltage (hypertrophy)
Harrison's Principles of Internal Medicine 22E (2025), Chapter 247 — Electrocardiography
This is a shared conversation. Sign in to Orris to start your own chat.