
Measure of Central tendancy psm topic
Reading File
Measures of Central Tendency is a core topic in Preventive & Social Medicine (PSM) / Biostatistics. Let me search the library for detailed content.
Searching sources...
Finding Sources
Finding Sources
Good results found. Let me read the most relevant sections in parallel.
Reading File
Reading File
Reading File
Reading File
Finding Sources
Reading File
Finding Sources
Reading File
Finding Sources
Now let me fetch the Gaussian distribution image and compile the full answer.
Loading Image
Here is a complete PSM / Biostatistics note on Measures of Central Tendency:
Measures of Central Tendency - PSM / Biostatistics
A measure of central tendency is a single summary value that represents the center or typical value of a dataset. The three classical measures are: Mean, Median, and Mode.
1. MEAN (Arithmetic Mean)
Definition: Sum of all observations divided by the total number of observations.
$$\bar{x} = \frac{\sum x_i}{n}$$
- It is a parametric method - derived from a defined formula.
- Uses every value in the dataset, so it is the most sensitive to extreme values (outliers).
- Best used when data are normally (symmetrically) distributed.
Types of Mean
| Type | Formula | When Used |
|---|---|---|
| Arithmetic Mean | Σx / n | Routine data; symmetric distributions |
| Geometric Mean | ⁿ√(x₁ × x₂ × ... × xₙ) | Log-normal distributions; minimizes effect of extreme values. Log GM = Σ(log xᵢ)/n |
| Weighted Mean | Σ(wᵢxᵢ) / Σwᵢ | When observations have different importance/weight |
| Harmonic Mean | n / Σ(1/xᵢ) | Rates and ratios (e.g., speed, dilution titers) |
Example of Geometric Mean vs Arithmetic Mean:
For values: 3, 3, 4, 4, 5, 5, 5, 6, 6, 8, 9, 10, 15, 21
-
Arithmetic Mean = 7.2
-
Geometric Mean = 6.09 (better reflects the cluster of lower values)
-
Henry's Clinical Diagnosis and Management by Laboratory Methods
2. MEDIAN
Definition: The middle value that divides the distribution exactly in half - one half above, one half below. Also called the 50th percentile.
- It is a non-parametric method - derived from a count, not a formula.
- Not affected by extreme values (outliers) - robust measure.
- Best used when data are skewed or when outliers are present.
- For ordinal data (e.g., pain score 0-5), the median is the preferred summary.
How to find:
- Arrange all values in ascending order.
- If n is odd: median = middle value [(n+1)/2 th term]
- If n is even: median = average of the two middle values
3. MODE
Definition: The most frequently occurring value in a dataset.
-
Not very useful for comparing datasets, but helpful for understanding the shape of a distribution.
-
A dataset can be unimodal (one mode), bimodal (two modes - suggests two subpopulations), or multimodal.
-
Skewness does not affect the mode.
-
Henry's Clinical Diagnosis and Management by Laboratory Methods, p. 150
Relationship in Different Distributions
Normal (Gaussian / Bell-Shaped) Distribution
In a perfect Gaussian distribution:
Mean = Median = Mode
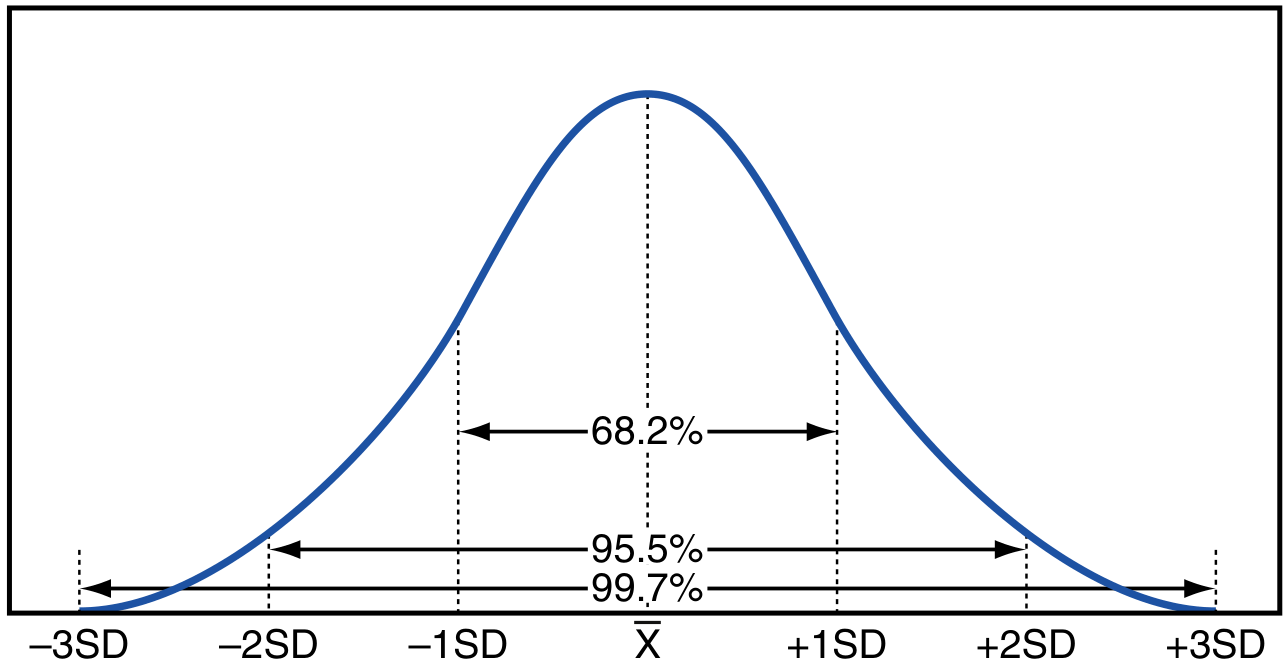
Figure: Idealized Gaussian distribution - areas under the curve at ±1, 2, and 3 SD from the mean - Henry's Clinical Diagnosis and Management
The SD properties of a normal distribution:
- Mean ± 1 SD covers 68.2% of values
- Mean ± 2 SD covers 95.5% of values
- Mean ± 2 SD covers 99.7% of values
Skewed Distributions
Skewness shifts the mean but the mode stays fixed.
| Distribution | Relationship | Tail Direction |
|---|---|---|
| Positively skewed (right skewed) | Mode < Median < Mean | Tail toward right (high values) |
| Negatively skewed (left skewed) | Mean < Median < Mode | Tail toward left (low values) |
Key: Mean is always pulled toward the long tail. In a positively skewed dataset, mean > median > mode.
- Quick Compendium of Clinical Pathology 5th Edition
Which Measure to Use?
| Situation | Best Measure |
|---|---|
| Normally distributed data | Mean |
| Skewed data / outliers present | Median |
| Nominal / categorical data | Mode |
| Log-normal distribution (e.g., antibody titers, bacterial counts) | Geometric Mean |
| Ordinal variables (e.g., pain scale, Likert) | Median |
| Bimodal distribution | Mode (or report both peaks) |
Quick Comparison Table
| Feature | Mean | Median | Mode |
|---|---|---|---|
| Formula-based | Yes (parametric) | No (non-parametric) | No |
| Uses all values | Yes | No | No |
| Affected by outliers | Most affected | Least affected | Not affected |
| Affected by skewness | Yes | Moderate | No |
| Best for | Normal distribution | Skewed data | Nominal/bimodal data |
| Position in +ve skew | Highest | Middle | Lowest |
PSM Exam High-Yield Points
- "Which is not a measure of central tendency?" - Standard Deviation (SD), Variance, Range - these are measures of dispersion, not central tendency.
- In a positively skewed distribution: Mean > Median > Mode (tail is on the right, mean is pulled right).
- In a negatively skewed distribution: Mean < Median < Mode.
- Geometric mean is used for antibody titer calculations and log-normal data.
- The median is the measure of choice for income data (highly skewed due to extreme earners).
- Regression to the mean: Patients selected because of an unusually high/low test result tend to have values closer to the mean on repeat testing - important concept in clinical trial design.
Sources: Henry's Clinical Diagnosis and Management by Laboratory Methods; Quick Compendium of Clinical Pathology 5th Ed.; Rockwood and Green's Fractures in Adults 10th Ed.; Swanson's Family Medicine Review
Inshort pls
Measures of Central Tendency - Quick Notes
3 Main Measures
| Measure | Definition | Formula |
|---|---|---|
| Mean | Sum ÷ total observations | x̄ = Σx / n |
| Median | Middle value (50th percentile) | Count-based |
| Mode | Most frequent value | Count-based |
Skewed Distribution - KEY RULE
| Distribution | Order |
|---|---|
| Normal | Mean = Median = Mode |
| Positive skew (right tail) | Mode < Median < Mean |
| Negative skew (left tail) | Mean < Median < Mode |
Mean is always pulled toward the tail.
Which to Use?
| Data Type | Use |
|---|---|
| Normal data | Mean |
| Skewed / outliers | Median |
| Categorical | Mode |
| Log-normal (antibody titers) | Geometric Mean |
Exam Points
- SD, Variance, Range = measures of dispersion, NOT central tendency
- Geometric Mean minimizes effect of extreme values
- Median is best for income data (skewed)
- Mean is most affected by outliers; Mode is least affected
This is a shared conversation. Sign in to Orris to start your own chat.